
Plenty of tools flag a breakout after the fact. This one grades it first. The breakout probability indicator TradingView build scores every breakout bar against four checks: range compression, volume building, ATR expansion and EMA trend alignment. Each check pays up to 25 points. The four add up to a 0-100 meter. A trade marker prints only when that meter clears your threshold, 70 by default.
It is free and open source. You can add it to any chart from the Breakout Probability Meter script page on TradingView, and the full Pine source is published there for you to read.
What Breakout Probability Meter plots on the price chart
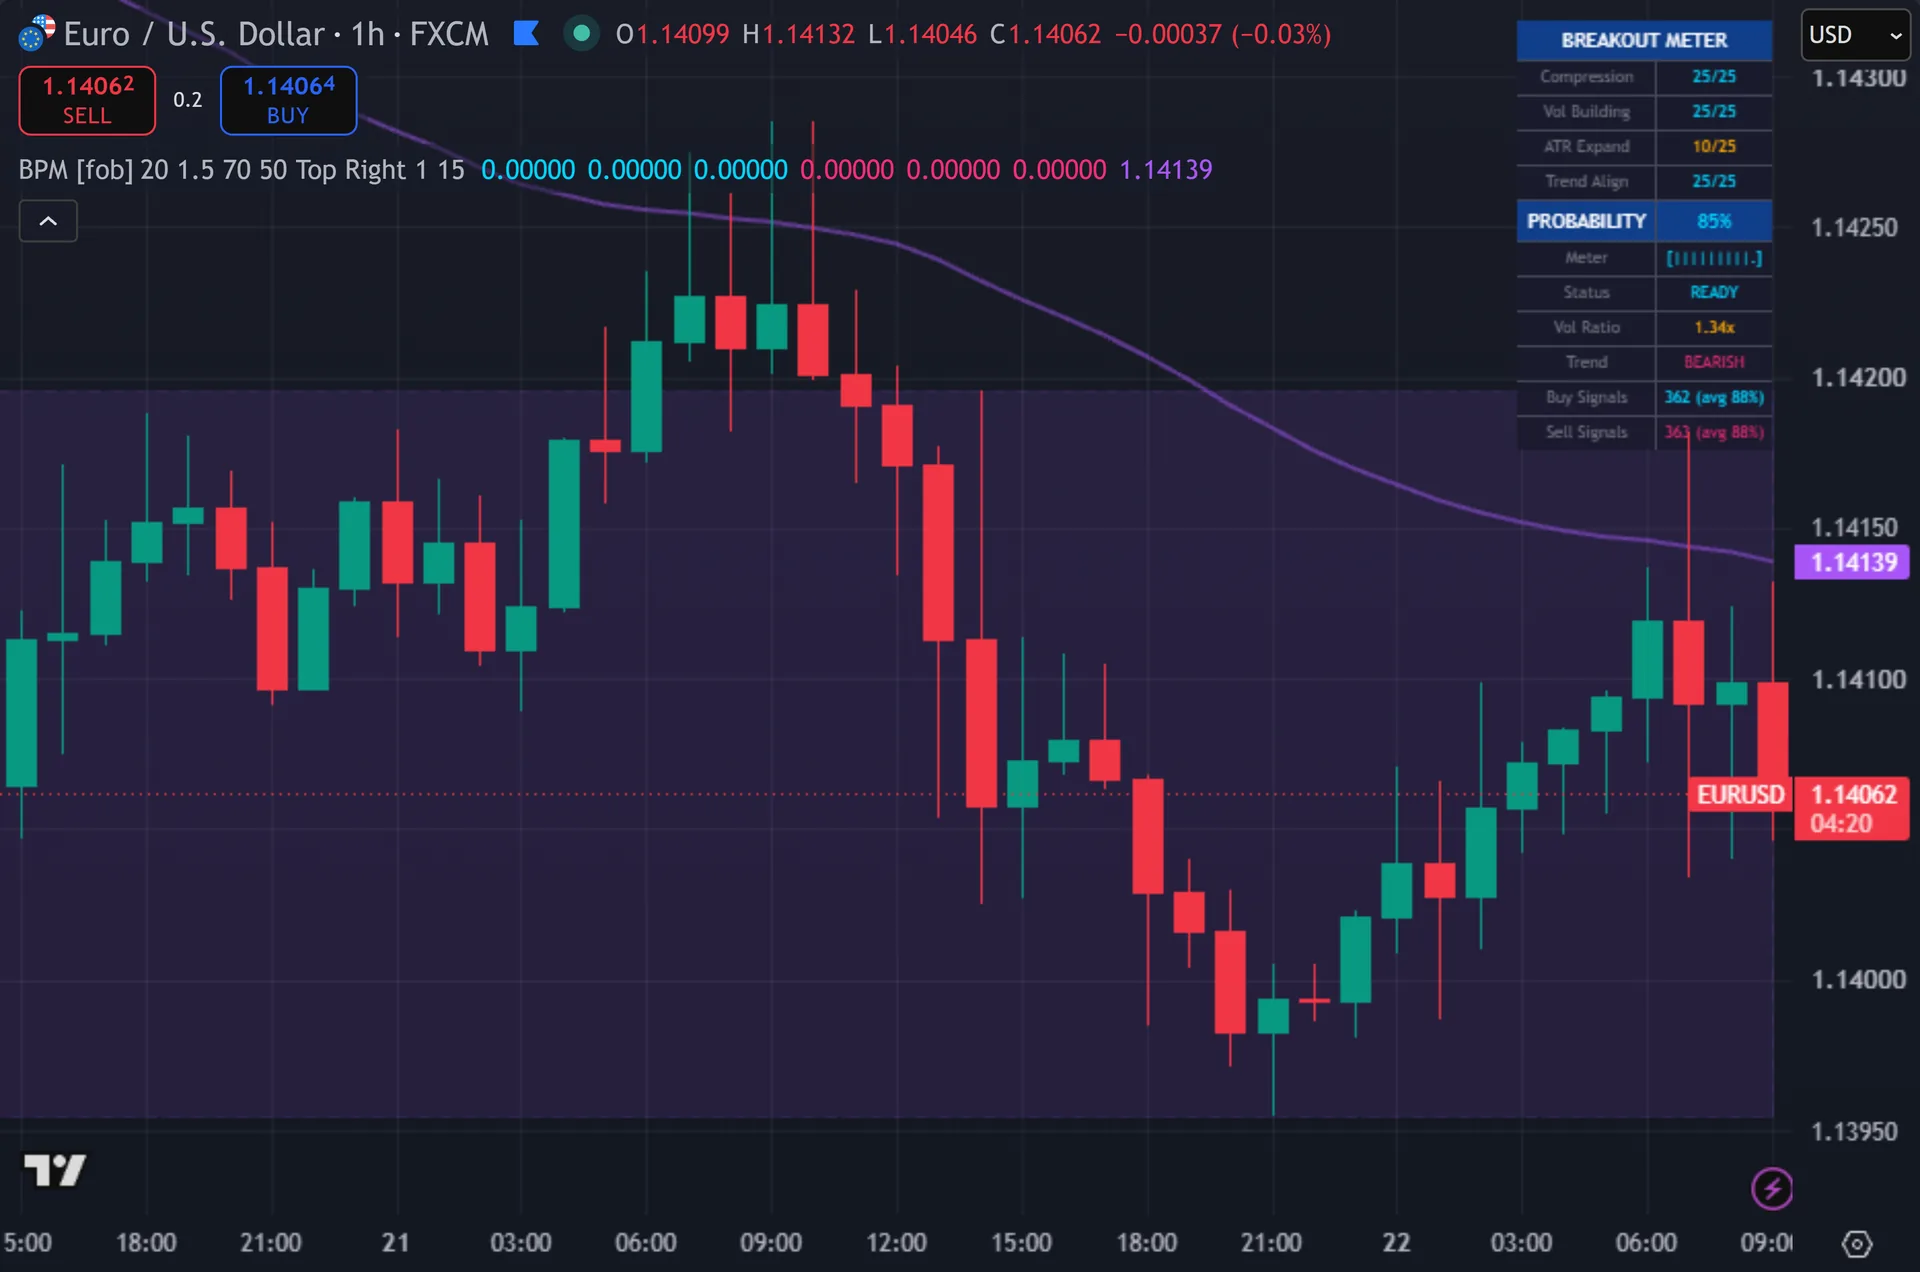
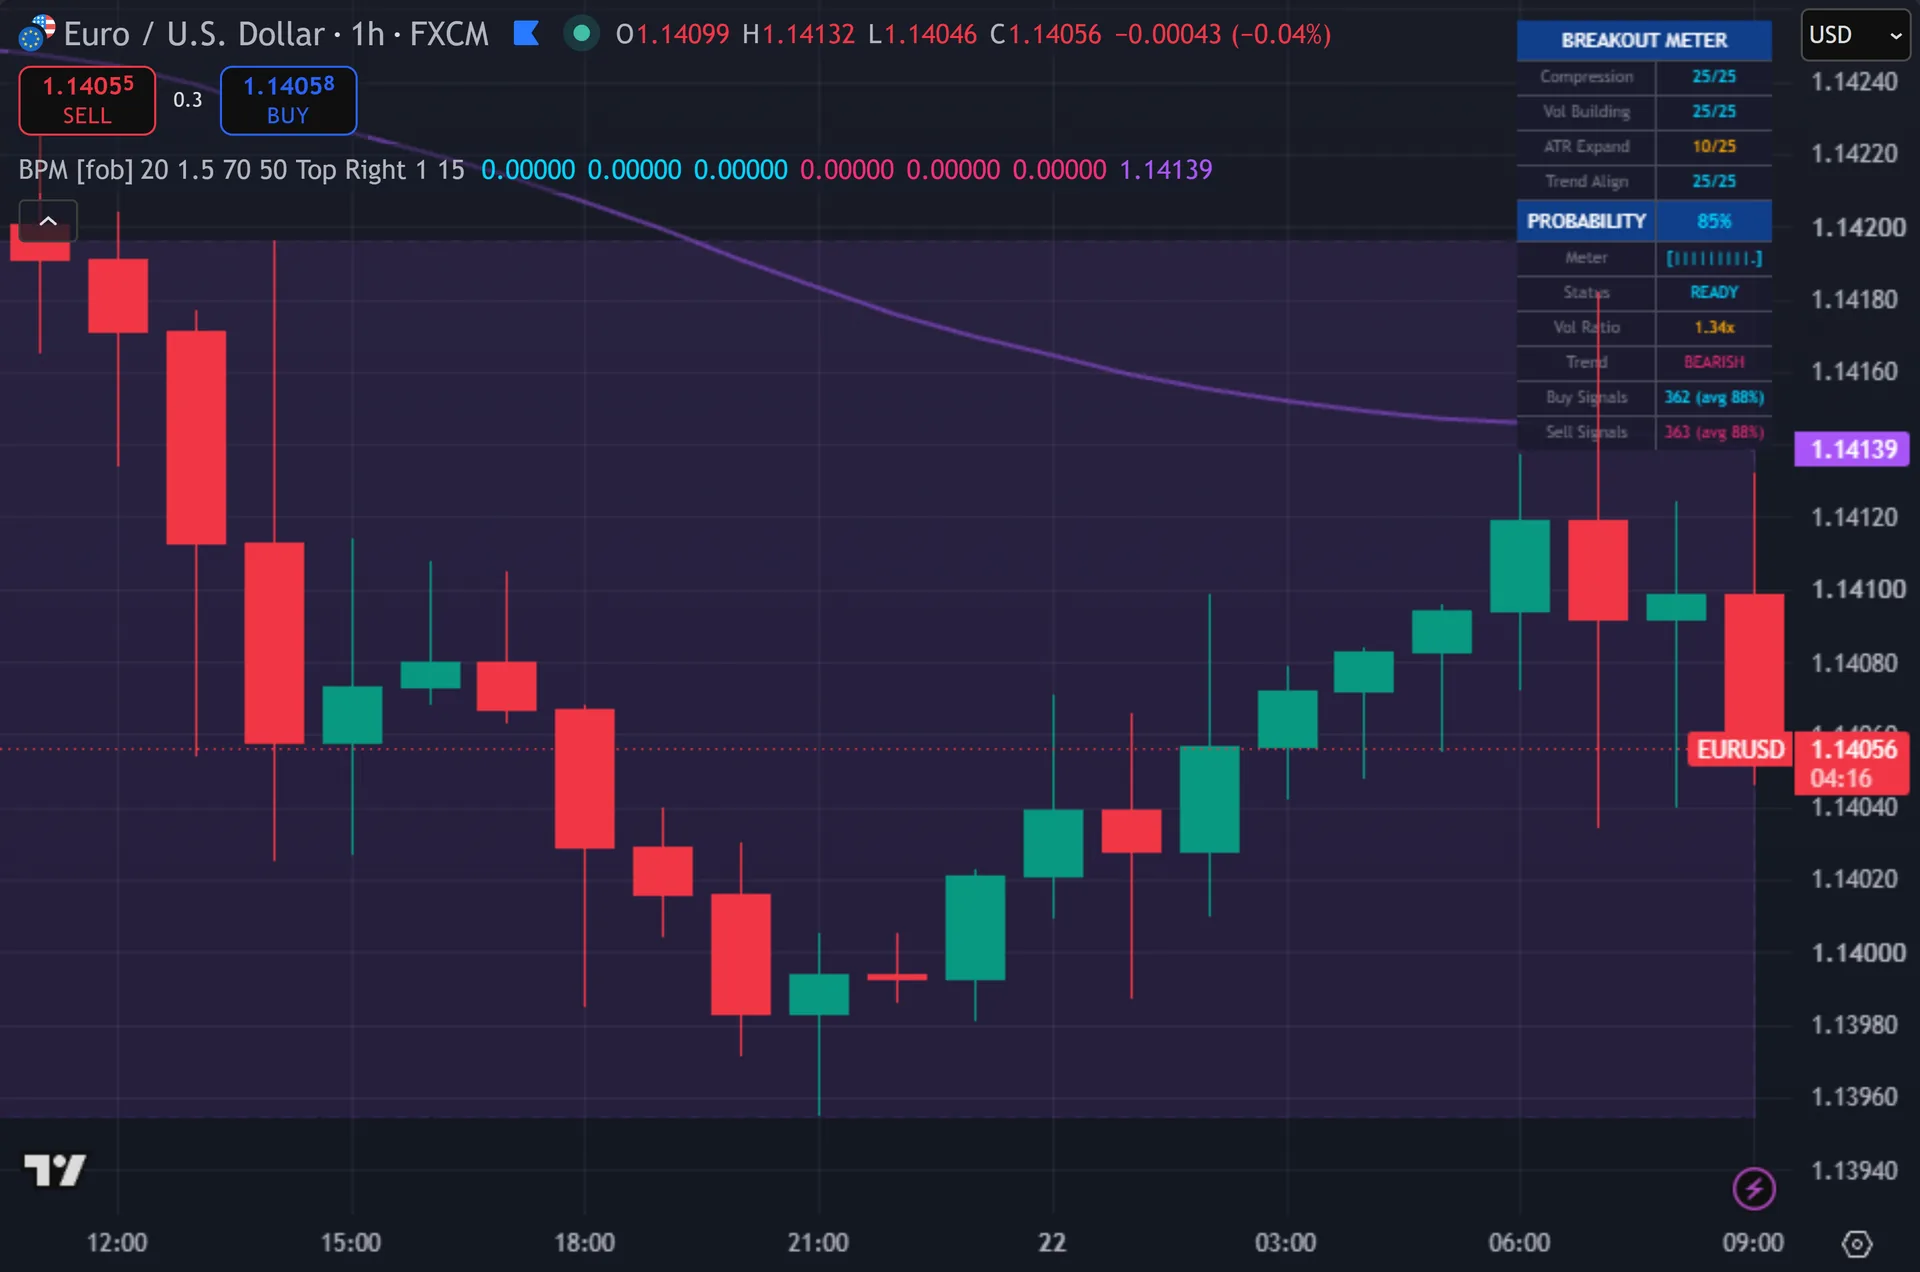
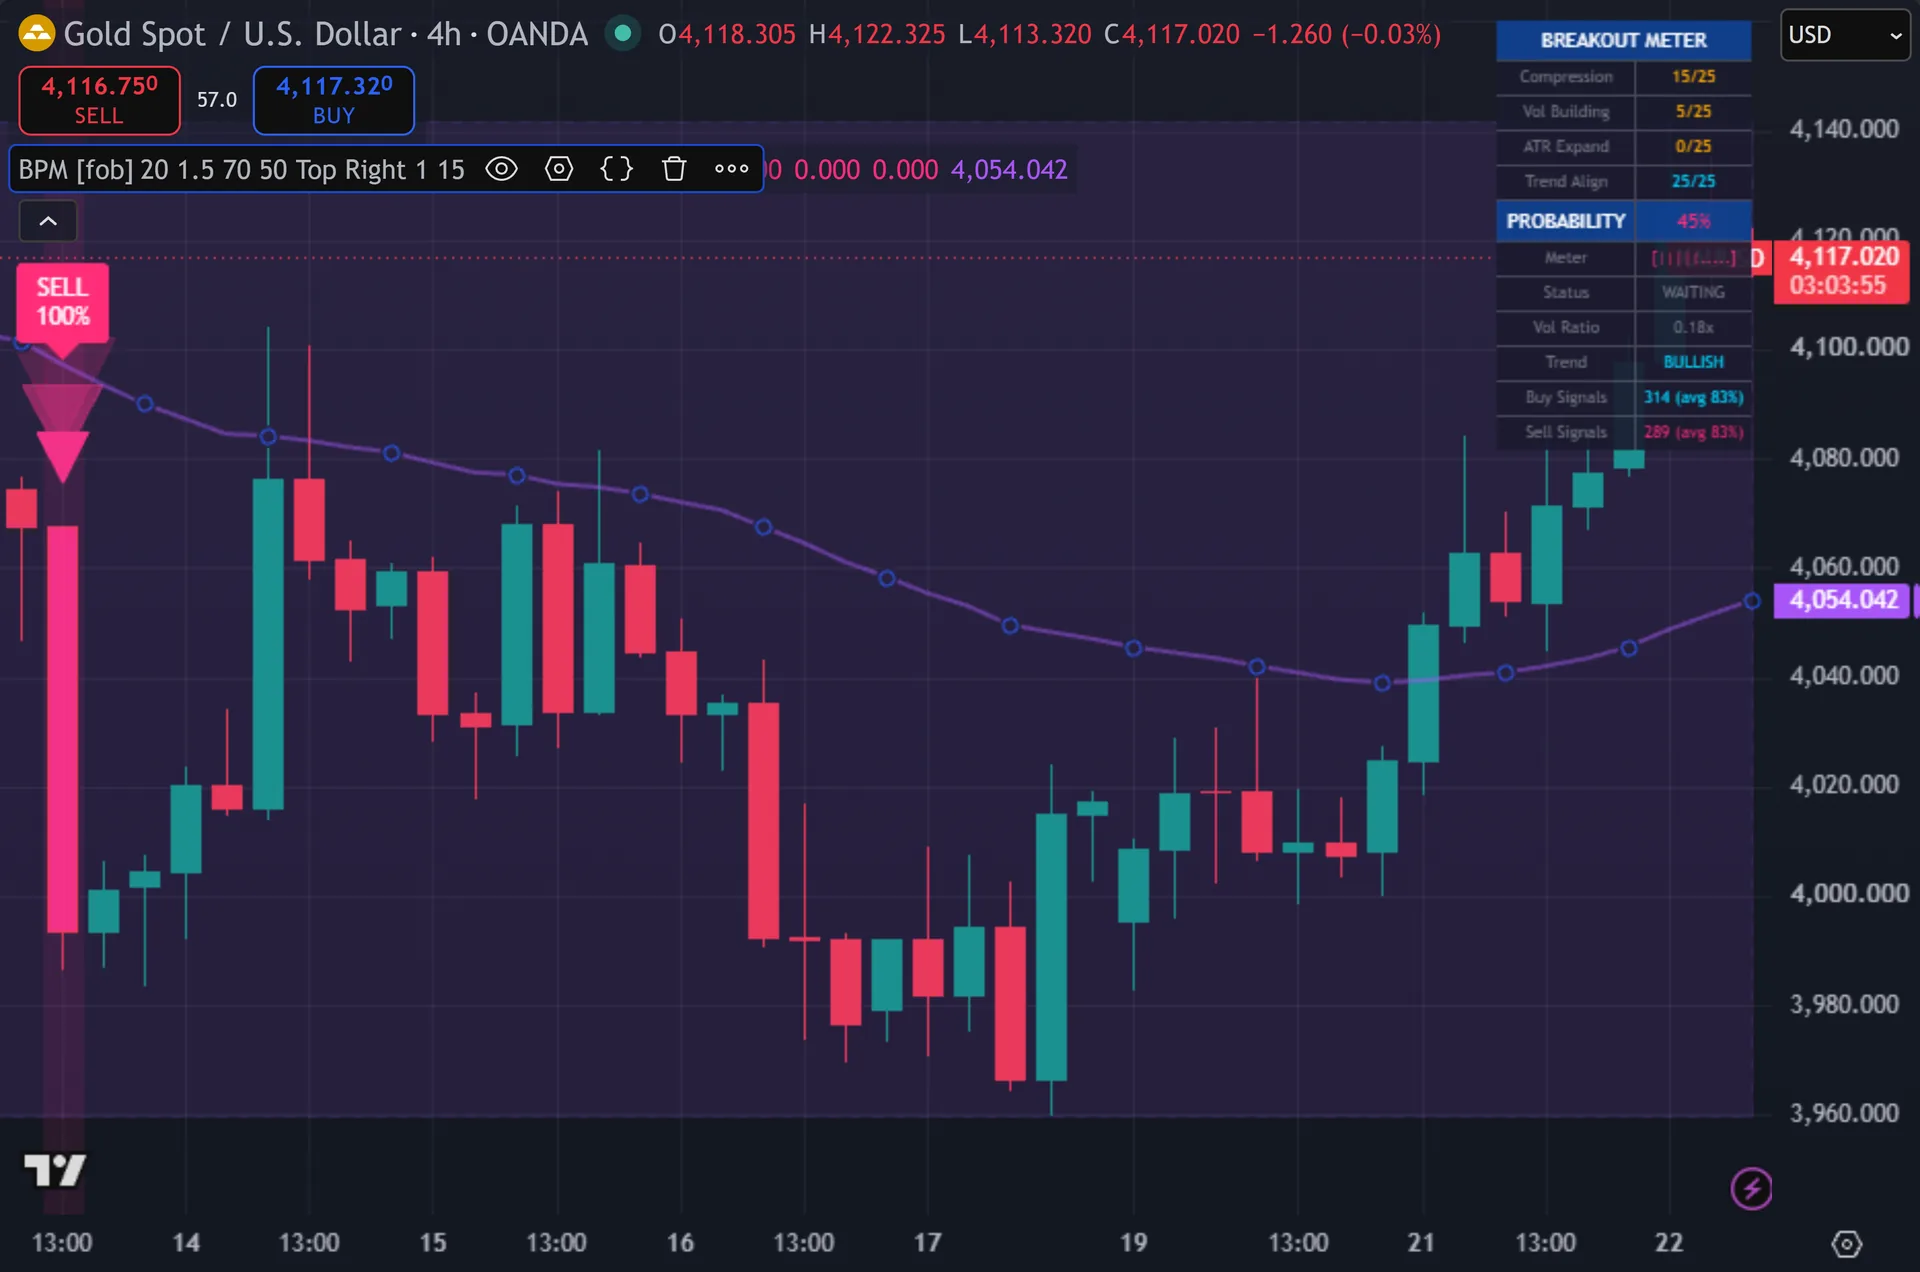
The script draws on the price chart. A violet 50-period EMA runs under price as the trend reference. Signal bars get a three-layer triangle: a huge faint glow, a large mid glow, then a solid arrow below or above the bar. A label carries the word BUY or SELL plus the probability, such as 84%. A dashed violet box tracks the live compression zone and stretches right while compression holds. Signal bars recolor, and a faint tint washes the background. A twelve-row table reports every factor score.
How Breakout Probability Meter is built
The four scoring factors
Factor one measures compression. The script takes the highest high and lowest low over 20 bars. It then divides that range by the average bar range times 20. A ratio under 0.30 pays 25 points. Under 0.50 pays 15. Under 0.70 pays 8. Anything wider pays nothing.
Factor two watches volume inside the squeeze. It compares a 10-bar volume average against a 5-bar volume average. If the recent average beats the earlier one by 20 percent, the factor pays 25 points. A smaller lead pays 15. A shrinking average pays 5.
Factor three checks range expansion. It divides the current bar range by the previous ATR(14) value. Above 2.25 times pays 25 points. Above 1.50 pays 20. Above 1.00 pays 10. Factor four is simpler. A close above the 50 EMA pays a bull breakout 25 points, and 10 when price sits on the wrong side.
Gating the signal
Detection comes first. A bullish breakout needs a close above the highest high of the previous 20 bars. A bearish breakout needs a close below the prior 20-bar low. Both conditions require barstate.isconfirmed, so the script judges closed bars only. It does not repaint.
Three more gates follow. The probability must reach the threshold, 70 by default and adjustable from 50 to 95. Volume must exceed its own 20-bar SMA times the multiplier, 1.0 out of the box. At least 15 bars must pass since the last marker, which stops clusters inside one move.
The script also keeps a running ledger. It counts buy and sell signals separately. It also tracks the average probability of each side across the loaded history. Those two rows sit at the bottom of the table. They show how selective your current settings really are on this symbol and timeframe.
How to read the signals
Start with the table, not the arrows. The four factor rows show where the score comes from. A reading of 70 built on compression and trend differs from a 70 built on volume and range expansion. The Status row flips to READY once the running total clears your threshold.
The dashed box marks the coil. While it stretches to the right, price still sits inside the compression window and the setup stays unresolved. The break of that box, paired with a printed arrow and a probability in the label, is the event the script exists to catch.
Use the Vol Ratio row as a sanity check. A value near 1.00 means the breakout bar traded on ordinary participation. Values above 1.50 show real interest. Lower the threshold below 70 for more markers. Raise it toward 90 for fewer and stricter ones.
Every Breakout Probability Meter setting explained
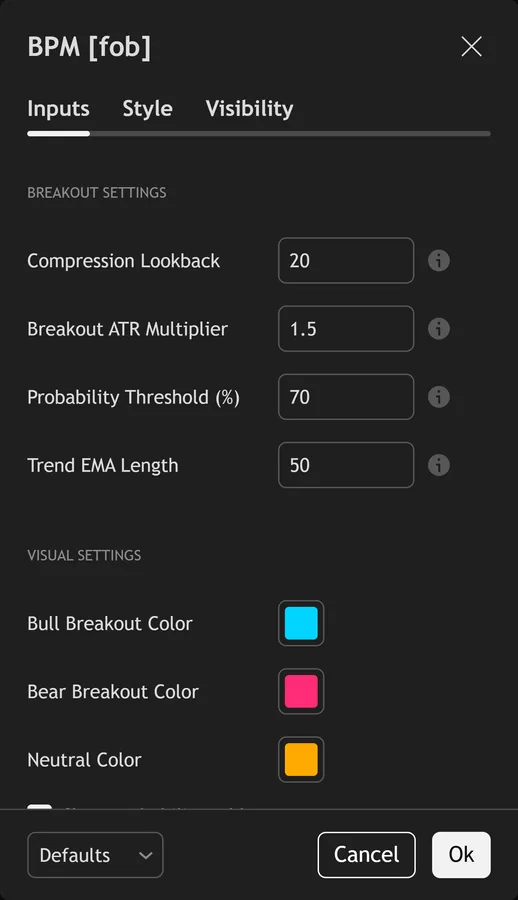
The script exposes 15 inputs, grouped in the settings panel exactly as shown below. Defaults are the published values.
Breakout Settings
| Setting | What it does | Default | Range |
|---|---|---|---|
| Compression Lookback | Number of bars to measure price compression | 20 | 5 to 100 |
| Breakout ATR Multiplier | How much ATR must expand on breakout bar | 1.5 | 0.5 to 5.0 |
| Probability Threshold (%) | Minimum probability to trigger signal | 70 | 50 to 95 |
| Trend EMA Length | EMA for trend alignment scoring | 50 | 10 to 200 |
Visual Settings
| Setting | What it does | Default | Range |
|---|---|---|---|
| Bull Breakout Color | Colour used for bull breakout color. | color.new(#00d4ff, 0) | |
| Bear Breakout Color | Colour used for bear breakout color. | color.new(#ff2d78, 0) | |
| Neutral Color | Colour used for neutral color. | color.new(#ffaa00, 0) | |
| Show Probability Table | Toggles show probability table on the chart. | on | on / off |
| Show Glow Effects | Toggles show glow effects on the chart. | on | on / off |
| Table Position | Choose the table position from the listed options. | Top Right | Top Right, Top Left, Bottom Right, Bottom Left |
Signal Filters
| Setting | What it does | Default | Range |
|---|---|---|---|
| Volume SMA(20) Multiplier | Volume must exceed SMA(20) * this value | 1.0 | 0.5 to 3.0 |
| Signal Cooldown (bars) | Sets the signal cooldown (bars) used in the calculation. | 15 | 5 to 50 |
Statistics
| Setting | What it does | Default | Range |
|---|---|---|---|
| Show Signal Statistics | Track and display signal performance stats | on | on / off |
| Show Compression Zone | Highlight active compression zones on chart | on | on / off |
| Compression Zone Color | Colour used for compression zone color. | color.new(#a855f7, 88) |
Alerts built into Breakout Probability Meter
The script ships 11 alert conditions. Open the alert dialog on the chart, pick the indicator as the condition source, then choose the event you want. Alerts fire on the close of the bar, so they follow the same confirmed-bar rule the on-chart signals use.
- BPM Buy Signal
- BPM Sell Signal
- BPM Any Signal
- Breakout Up Detected
- Breakout Down Detected
- High Probability Breakout
- High Compression
- Volume Building
- ATR Expanding
Other markets and timeframes
Every threshold in the script works in relative terms. Compression divides range by the average range. Expansion divides bar range by ATR. Volume compares against its own 20-bar SMA. Nothing uses pips, ticks or dollars directly, so the maths travels across forex, indices, metals and crypto without edits. One caveat matters. Forex feeds report tick volume rather than traded size, so the volume factor measures activity on those symbols.
Limitations worth knowing
The word probability describes a score, not a statistical forecast. The four factors carry fixed 25-point weights that the author chose. The meter does not learn from past outcomes. Nothing in the code measures what happened after previous signals. Treat the number as a setup grade.
Two of the four factors depend on volume. On instruments with thin or synthetic volume data, those 50 points turn noisy. The script also holds no exit logic. It plots entries only – no targets, no stops, no trailing rule – so you supply the risk plan.
The 15-bar cooldown and the confirmed-bar rule both cost you speed. A signal arrives at the close of the breakout bar, never during it. Strong trends that break out repeatedly show only the first move of each cluster until the cooldown expires.
Get Breakout Probability Meter on TradingView
Open Breakout Probability Meter on TradingView
If you also trade MetaTrader, the MT4 and MT5 indicator library is available below.
Get the complete indicator library
One email unlocks the full MT4 and MT5 indicator library. This TradingView script stays free on TradingView – the button above adds it to your chart.
Using it alongside MetaTrader
Adding a script on TradingView takes one click, so there is no install step here. If you want the same idea on MetaTrader, the MT4 and MT5 indicator installation guide walks through copying files into the data folder and attaching them to a chart. You can also browse the full MetaTrader indicator library, the MT4 indicators section, or the other free TradingView scripts published on this profile. For related chart tools see the MT5 indicators section and the forex trading strategies guides.
External references
- Average true range on Wikipedia
- Bollinger Bands at Investopedia
- Volatility Indices at StockCharts ChartSchool
Frequently asked questions
Does the Breakout Probability Meter repaint?
No. Both breakout conditions require barstate.isconfirmed, and the alerts fire with alert.freq_once_per_bar_close. The script judges closed bars, so a printed arrow stays where it printed.
What does the probability number actually measure?
It sums four factor scores worth 25 points each: range compression, volume building during the squeeze, ATR expansion on the breakout bar, and trend alignment with the 50 EMA. The script caps the total at 100. The number grades setup quality, not future outcome.
Which timeframe suits it best?
The defaults – 20-bar compression, ATR(14), 50 EMA – suit H1 and H4 charts. On M5 and M15, raise the compression lookback toward 30 or 40 and lift the threshold to 80. Intraday noise produces far more marginal breaks.
Can I use it on a chart without volume data?
You can, but expect weaker scoring. The volume-building factor and the volume filter both read the volume series. On symbols with no volume feed, the score loses up to 25 points and the filter blocks most signals. Lower the volume multiplier or pick symbols with a proper feed. Trading carries risk, and past performance does not indicate future results.
How much should I rely on this indicator?
Treat it as one input, not a decision. It is a chart analysis tool, not trading advice. Test it on your own markets and timeframes before relying on it. Results are not guaranteed; past performance is not indicative of future results.

About the author
Written by Dominic Walsh, a Forex trader and MT4/MT5 indicator, Expert Advisor and script developer. Every tool on forexmt4systems.com is tested on live charts before release and ships with ready-to-use compiled MT4 (.ex4) and MT5 (.ex5) files. Learn more about the trader and developer behind this site.
How we build, test and correct every tool: Editorial & Testing Policy. Trading carries risk; see the disclaimer.