
Most candlestick tools answer yes or no. Candle DNA Analyzer, a free candlestick pattern indicator TradingView traders can add to any chart, answers how strongly instead. It breaks each bar into its measurable parts – body, upper wick, lower wick, close position, range against ATR and volume against its own average – then scores five classic patterns from 0 to 100 and only marks the ones that clear a confidence threshold you set.
It is free and open source. You can add it to any chart from the Candle DNA Analyzer script page on TradingView, and the full Pine source is published there for you to read.
What Candle DNA Analyzer plots on the price chart
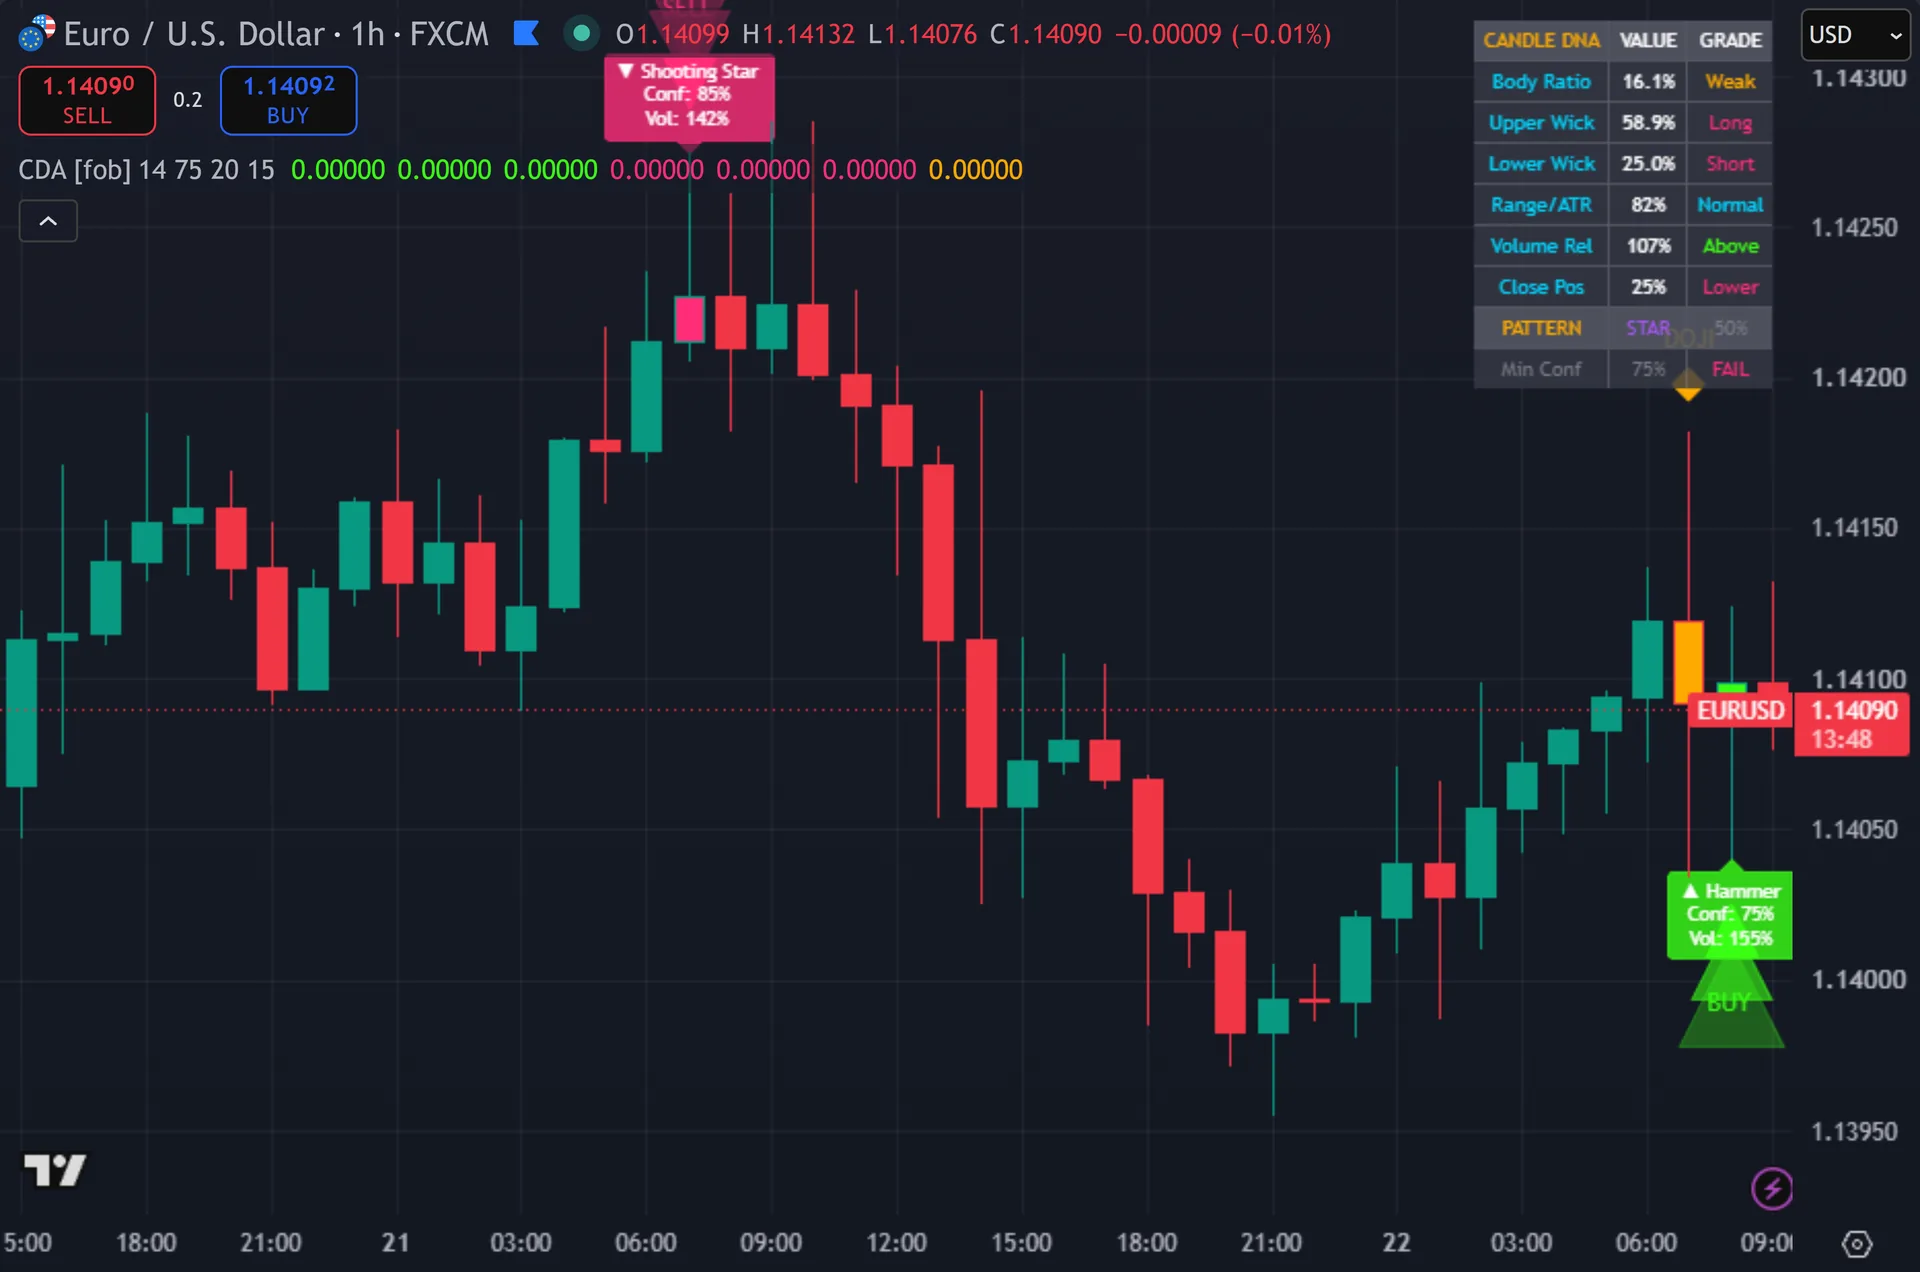
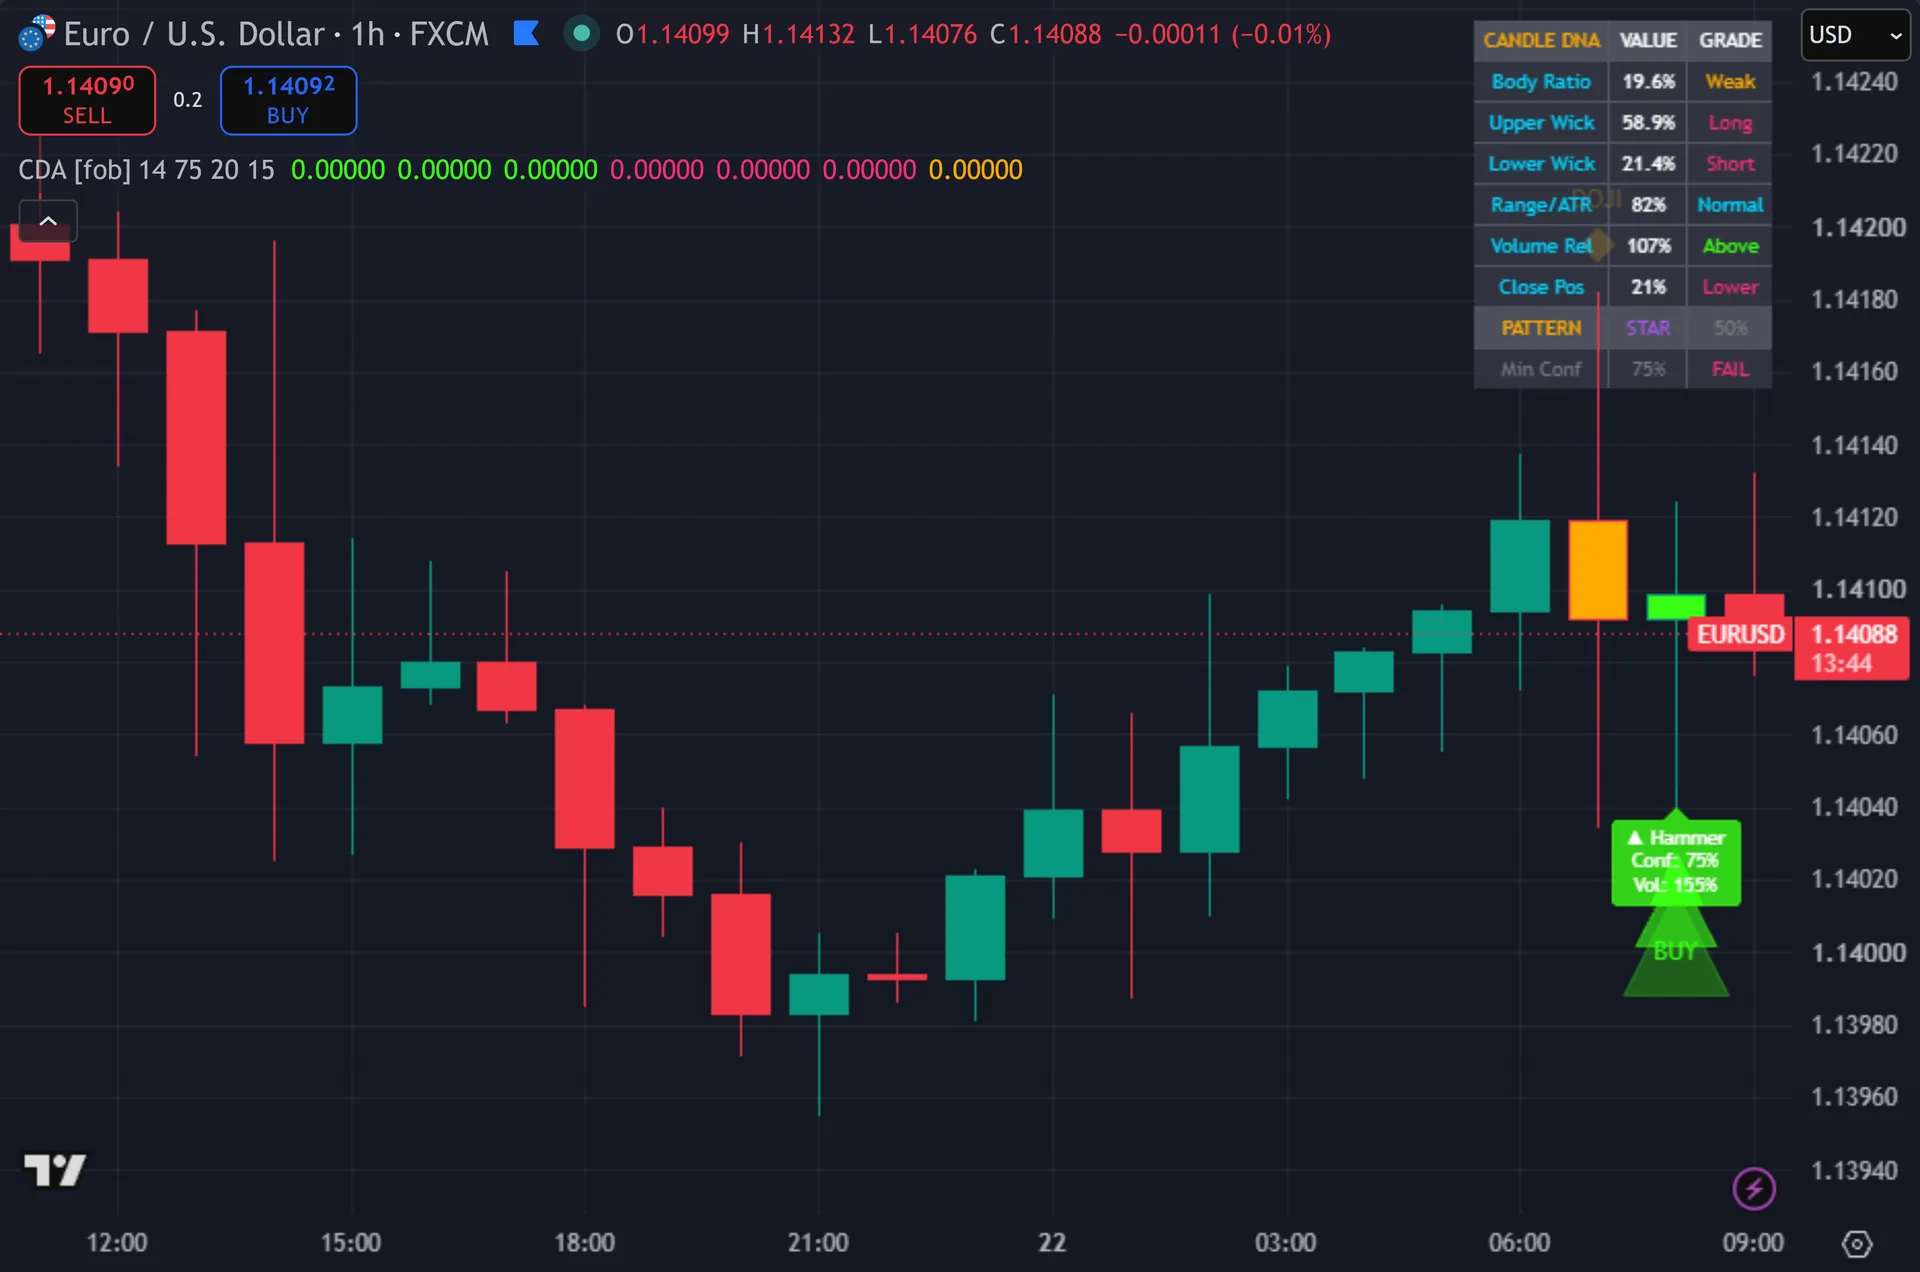
The indicator draws BUY and SELL arrows on qualifying bars. Each arrow carries a label with the pattern name and two numbers: the confidence score and volume against the 20-bar average. A dashboard sits in the top-right corner. It reads out the current bar live – body ratio, upper and lower wick percentages, range against ATR, relative volume and close position. Each row carries a plain-word grade such as Weak, Short, Long or Narrow. The indicator also tints the bar when a pattern fires.
How Candle DNA Analyzer is built
Step one: measure the candle
The script measures each bar before it names anything. It computes the total range, the body size, the upper wick and the lower wick. Then it turns the last three into percentages of the range. So a bar with a 66 percent lower wick and a 3 percent upper wick gets a numeric description first. The pattern name comes later.
Three context readings follow. The script divides range by ATR over your chosen period. That shows whether the bar runs large or small for current conditions, rather than in raw pips. It also divides volume by its own moving average to get a relative volume figure. Close position marks where the bar closed inside its range, from 0 at the low to 100 at the high.
Step two: score five patterns
Five scorers run side by side: hammer, shooting star, bullish engulfing, bearish engulfing and doji. Each builds a score out of 100 from graded thresholds. Take the hammer scorer. It awards 30 points for a lower wick above 60 percent of range. It adds 25 for an upper wick under 10 percent, 20 for a body under 35 percent, and 15 for a close in the upper third. Strong volume adds a final 10. A weaker version of the same shape still scores, just lower.
The engulfing scorers also weigh the current body against the previous one. They require the open and close to straddle the prior body. So a large candle that merely looks big will not qualify on size alone.
The script reports only the top-scoring pattern on each bar. That score must reach the Min Confidence percentage you set, which starts at 75. Three gates then apply. The bar must close first, so signals never flash up and vanish mid-candle. Volume must beat its moving average. And your cooldown must have elapsed since the last signal, which stops clusters of near-identical arrows in chop.
How to read the signals
Treat the arrow as the start of the question, not the answer. The label gives you three things: the pattern name, the confidence score and relative volume. Together they tell you how much weight the bar deserves. A hammer at 100 percent confidence on 132 percent volume beats one scraping through at 75 on 90.
Read it at structure. A bullish pattern printing where price has turned before, with a long lower wick and heavy volume, is exactly what the scoring aims to surface. The same arrow mid-range tells you far less.
Signals need a closed bar, so the arrow lands at the open of the next candle. That is deliberate. What you see on a historical chart matches what you would have seen live. Still, you act one bar after the pattern completed, so size and stops should allow for that bar’s range.
Every Candle DNA Analyzer setting explained
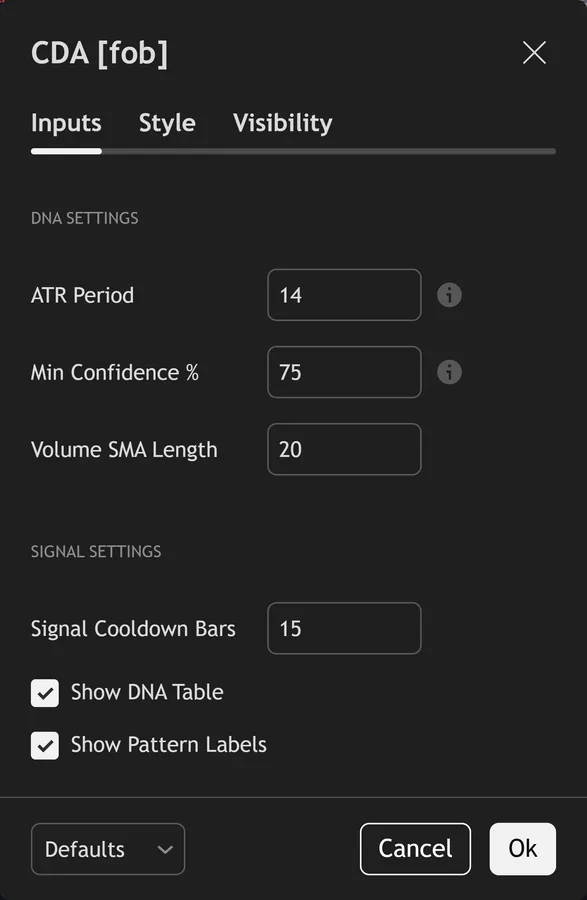
The script exposes 6 inputs, grouped in the settings panel exactly as shown below. Defaults are the published values.
DNA Settings
| Setting | What it does | Default | Range |
|---|---|---|---|
| ATR Period | ATR period for range comparison | 14 | 5 to 50 |
| Min Confidence % | Minimum confidence to trigger signal | 75 | 50 to 95 |
| Volume SMA Length | Sets the volume sma length used in the calculation. | 20 | 5 to 50 |
Signal Settings
| Setting | What it does | Default | Range |
|---|---|---|---|
| Signal Cooldown Bars | Sets the signal cooldown bars used in the calculation. | 15 | 5 to 50 |
| Show DNA Table | Toggles show dna table on the chart. | on | on / off |
| Show Pattern Labels | Toggles show pattern labels on the chart. | on | on / off |
Alerts built into Candle DNA Analyzer
The script ships 11 alert conditions. Open the alert dialog on the chart, pick the indicator as the condition source, then choose the event you want. Alerts fire on the close of the bar, so they follow the same confirmed-bar rule the on-chart signals use.
- CDA Bull Pattern
- CDA Bear Pattern
- CDA Hammer
- CDA Shooting Star
- CDA Bull Engulfing
- CDA Bear Engulfing
- CDA Doji
- CDA Any Signal
- CDA Doji Signal
Other markets and timeframes
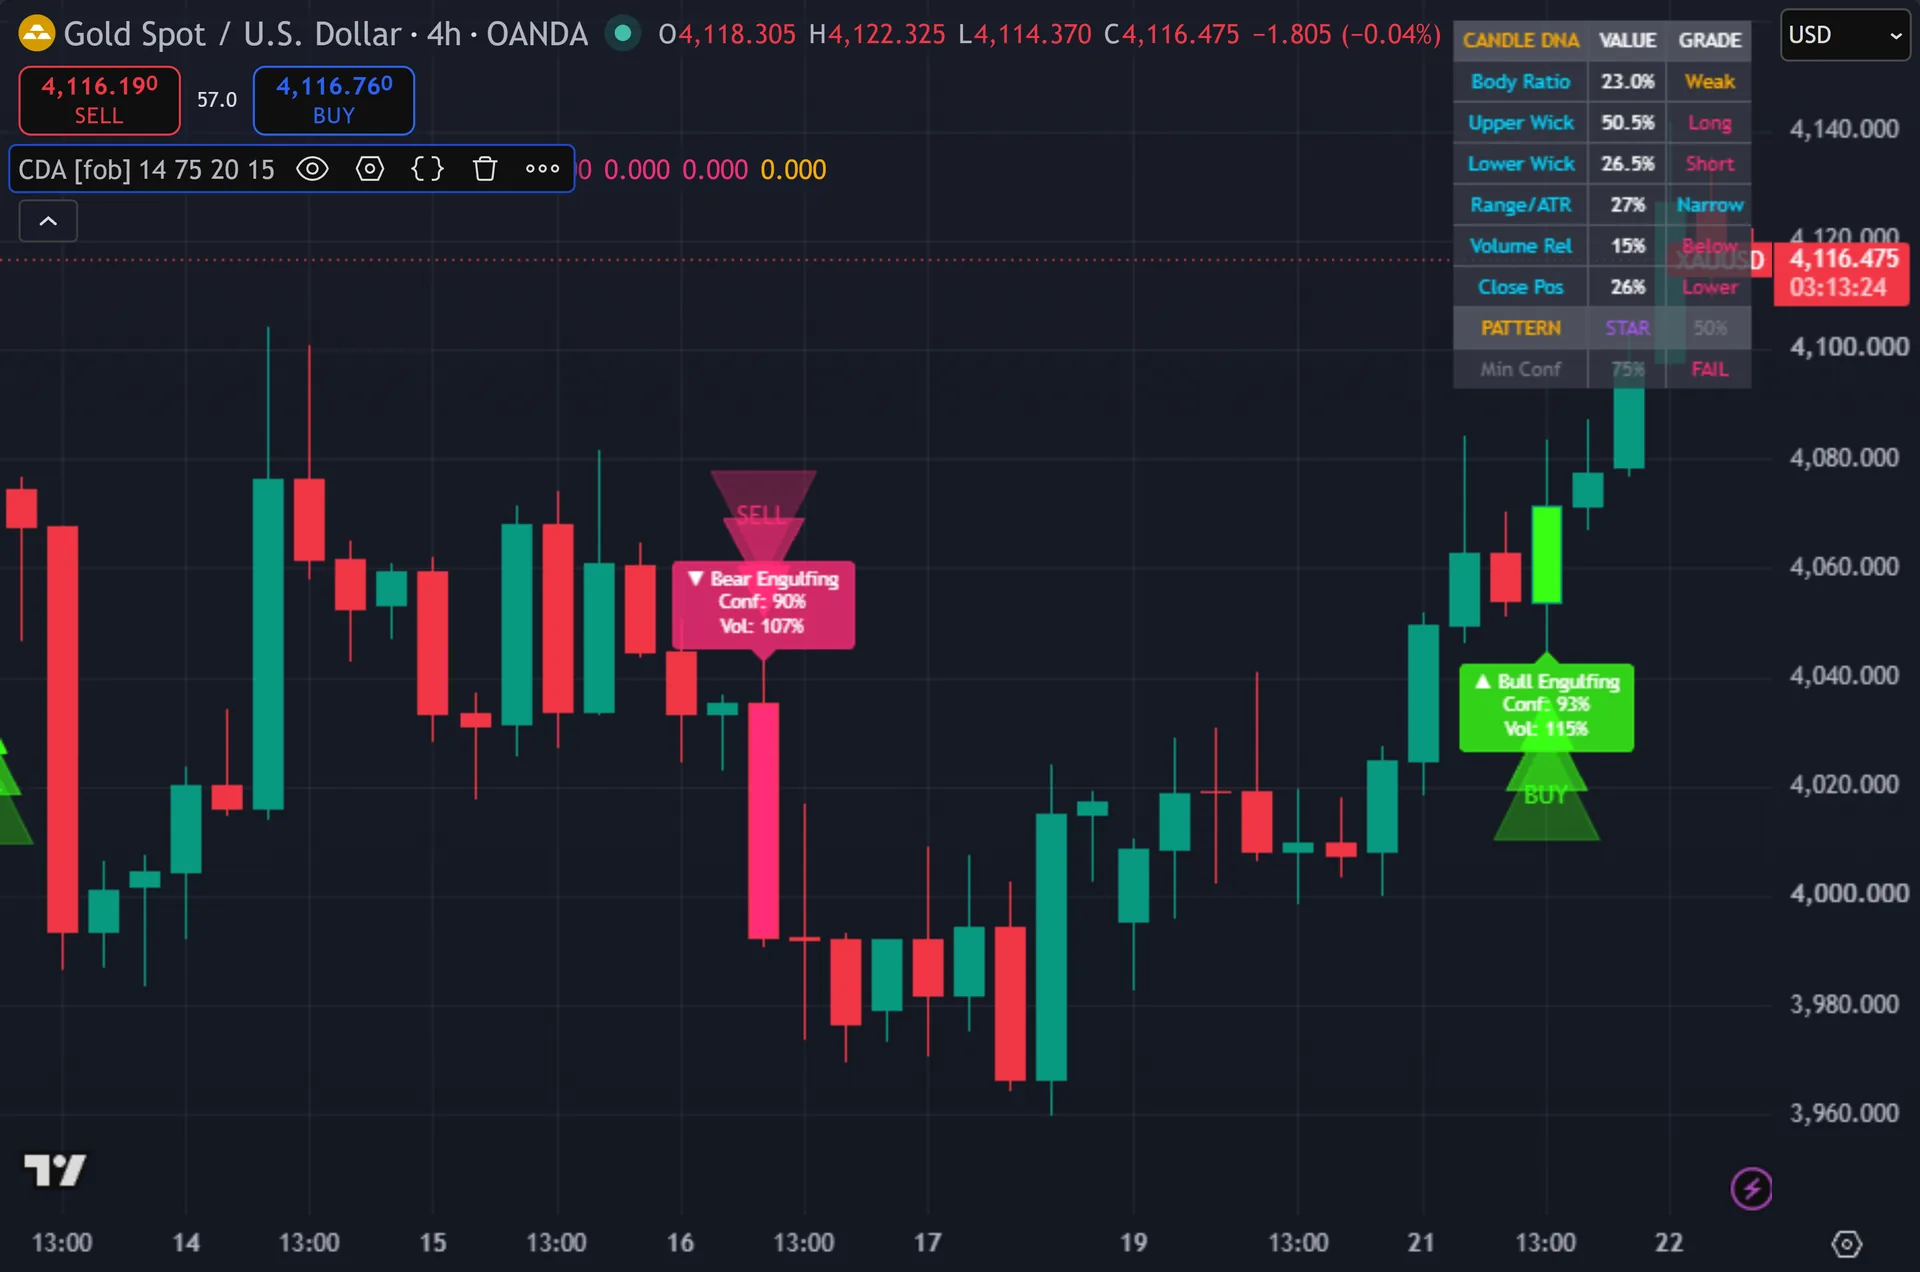
Nothing in the calculation is tied to forex. Every threshold is relative – wicks as a percentage of range, range against ATR, volume against its own average – so the same defaults transfer to gold, indices, crypto and equities without retuning. The screenshot below shows the identical settings running on gold on the 4-hour chart. The one input worth revisiting per market is the cooldown, since a fast intraday chart produces more qualifying bars than a daily one.
Limitations worth knowing
This filters pattern quality. It is not a trading system. It carries no view on trend, no stop or target logic, and no position sizing. It tells you a bar forms a strong hammer. It cannot tell you whether buying hammers works in the current regime.
The volume gate changes how the indicator behaves across instruments. Spot forex volume comes from broker tick counts, not an exchange, so relative volume acts as a proxy. On markets with no volume feed the gate blocks signals outright.
Raise Min Confidence and you get fewer, cleaner marks. Lower it and you get many more. No setting yields only the correct ones. The cooldown also suppresses a genuine second setup that follows soon after the first.
Get Candle DNA Analyzer on TradingView
Open Candle DNA Analyzer on TradingView
If you also trade MetaTrader, the MT4 and MT5 indicator library is available below.
Get the complete indicator library
One email unlocks the full MT4 and MT5 indicator library. This TradingView script stays free on TradingView – the button above adds it to your chart.
Using it alongside MetaTrader
Adding a script on TradingView takes one click, so there is no install step here. If you want the same idea on MetaTrader, the MT4 and MT5 indicator installation guide walks through copying files into the data folder and attaching them to a chart. You can also browse the full MetaTrader indicator library, the MT4 indicators section, or the other free TradingView scripts published on this profile. For related chart tools see the MT5 indicators section and the forex trading strategies guides.
External references
- Candlestick pattern on Wikipedia
- ATR at Investopedia
- Introduction to Candlesticks at StockCharts ChartSchool
Frequently asked questions
Does the Candle DNA Analyzer repaint?
No. The script gates every signal on barstate.isconfirmed, so it marks a pattern only after that bar closes. Arrows do not appear and vanish while the candle moves. The historical chart therefore matches what you would have seen in real time.
What does the confidence percentage measure?
It is the pattern’s score out of 100. Graded thresholds on wick ratios, body ratio, close position, range against ATR and relative volume all feed it. It measures how cleanly the bar matches the textbook shape. It is not the odds that a trade works.
Which timeframe suits it best?
Any of them, because every measurement stays relative. Higher timeframes give fewer and weightier marks. On very fast charts, raise the cooldown so signals spread further apart.
Why did an obvious hammer get no arrow?
Three gates can block it. The score fell under Min Confidence, volume sat at or below its moving average, or the cooldown had not yet elapsed. The dashboard shows the live pattern name and score, so you can see which gate stopped it.
How much should I rely on this indicator?
Treat it as one input, not a decision. It is a chart analysis tool, not trading advice. Test it on your own markets and timeframes before relying on it. Results are not guaranteed; past performance is not indicative of future results.

About the author
Written by Dominic Walsh, a Forex trader and MT4/MT5 indicator, Expert Advisor and script developer. Every tool on forexmt4systems.com is tested on live charts before release and ships with ready-to-use compiled MT4 (.ex4) and MT5 (.ex5) files. Learn more about the trader and developer behind this site.
How we build, test and correct every tool: Editorial & Testing Policy. Trading carries risk; see the disclaimer.