
Cascade Trigger Network is a higher timeframe bias indicator TradingView traders can use to stop taking entries against the higher timeframe. Also, it needs three levels to agree. Your chart supplies the trigger, the 1-hour supplies the confirmation, and the 4-hour supplies the bias. Indeed, only when all three line up inside a six-bar window does the script mark a trade on the chart. Anything short of that stays unmarked.
It is free and open source. Still, you can add it to any chart from the Cascade Trigger Network script page on TradingView, and the full Pine source is published there for you to read.
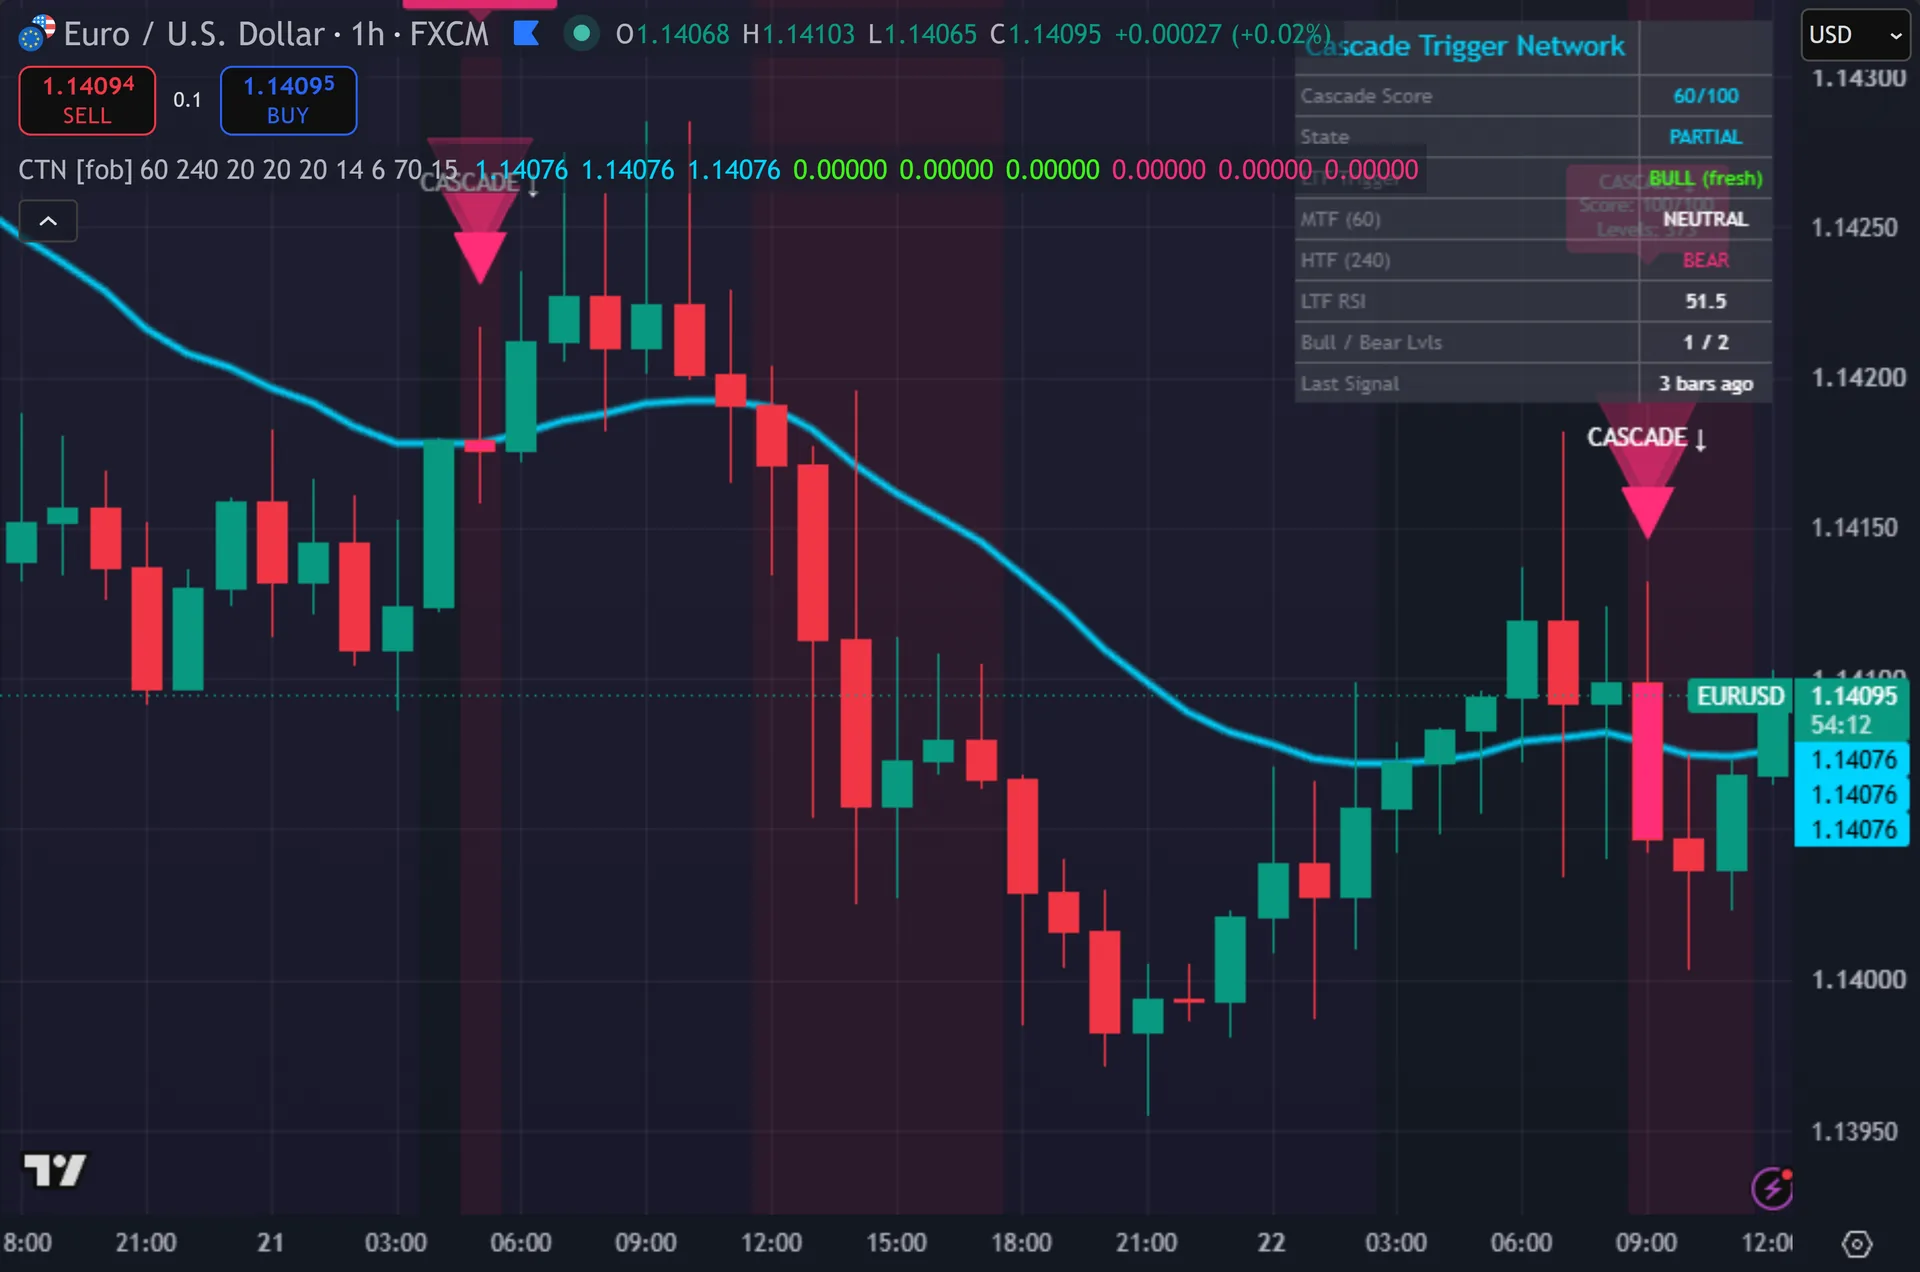
What Cascade Trigger Network plots on the price chart
A three-layer cyan glow traces the 20-period EMA on your chart timeframe. Thus, triangles print below and above the bars on signals, tagged CASCADE up or CASCADE down, and the signal bar changes colour. Each triangle carries a label with the cascade score out of 100 and the level count out of three. Hence, the background tints as the score climbs past 50, 70 and 85. A nine-row dashboard lists the score, the state, the chart trigger, both higher timeframes, RSI and the bars since the last signal.
How Cascade Trigger Network is built
The three levels
The lowest level runs on your chart. Next, the script takes a 20-period EMA and waits for the close to cross it. RSI over 14 bars must sit above 50 for a bullish trigger, or below 50 for a bearish one. Then, that trigger then stays live for six bars, and the Cascade Window Bars input controls that memory.
The two upper levels come from request.security calls on the 60-minute and 240-minute charts, both with lookahead set to off. Yet, each call pulls a close, a 20-period EMA and the three-bar change in that EMA. A level reads bullish when its close sits above its EMA and that EMA is rising. Bearish needs both conditions reversed. A cascade completes when the fresh chart trigger, the 1-hour read and the 4-hour read all point the same way.
The score and the gates
The score is simpler than it looks. Truly, each aligned level adds 30 points, so three levels give 90. A further 10 points arrive only when all three align and chart RSI sits above 55 or below 45. Plainly, so the score takes just five values: 0, 30, 60, 90 or 100.
That shapes the labels. Also, CHAINED needs 85, PARTIAL needs 50, and BROKEN sits below that. The LINKED band between 70 and 84 cannot be reached on default inputs, because the score jumps from 60 straight to 90. Indeed, so the default 70 threshold means one thing in practice: all three levels must agree.
Three more gates sit in front of the arrow. Still, the cascade must be fresh, meaning it completed on this bar and not the one before. Fifteen bars must have passed since the last signal in either direction. Thus, and the bar must close, since the script checks barstate.isconfirmed. Two alert calls then push JSON carrying the action, ticker, price and score.
How to read the signals
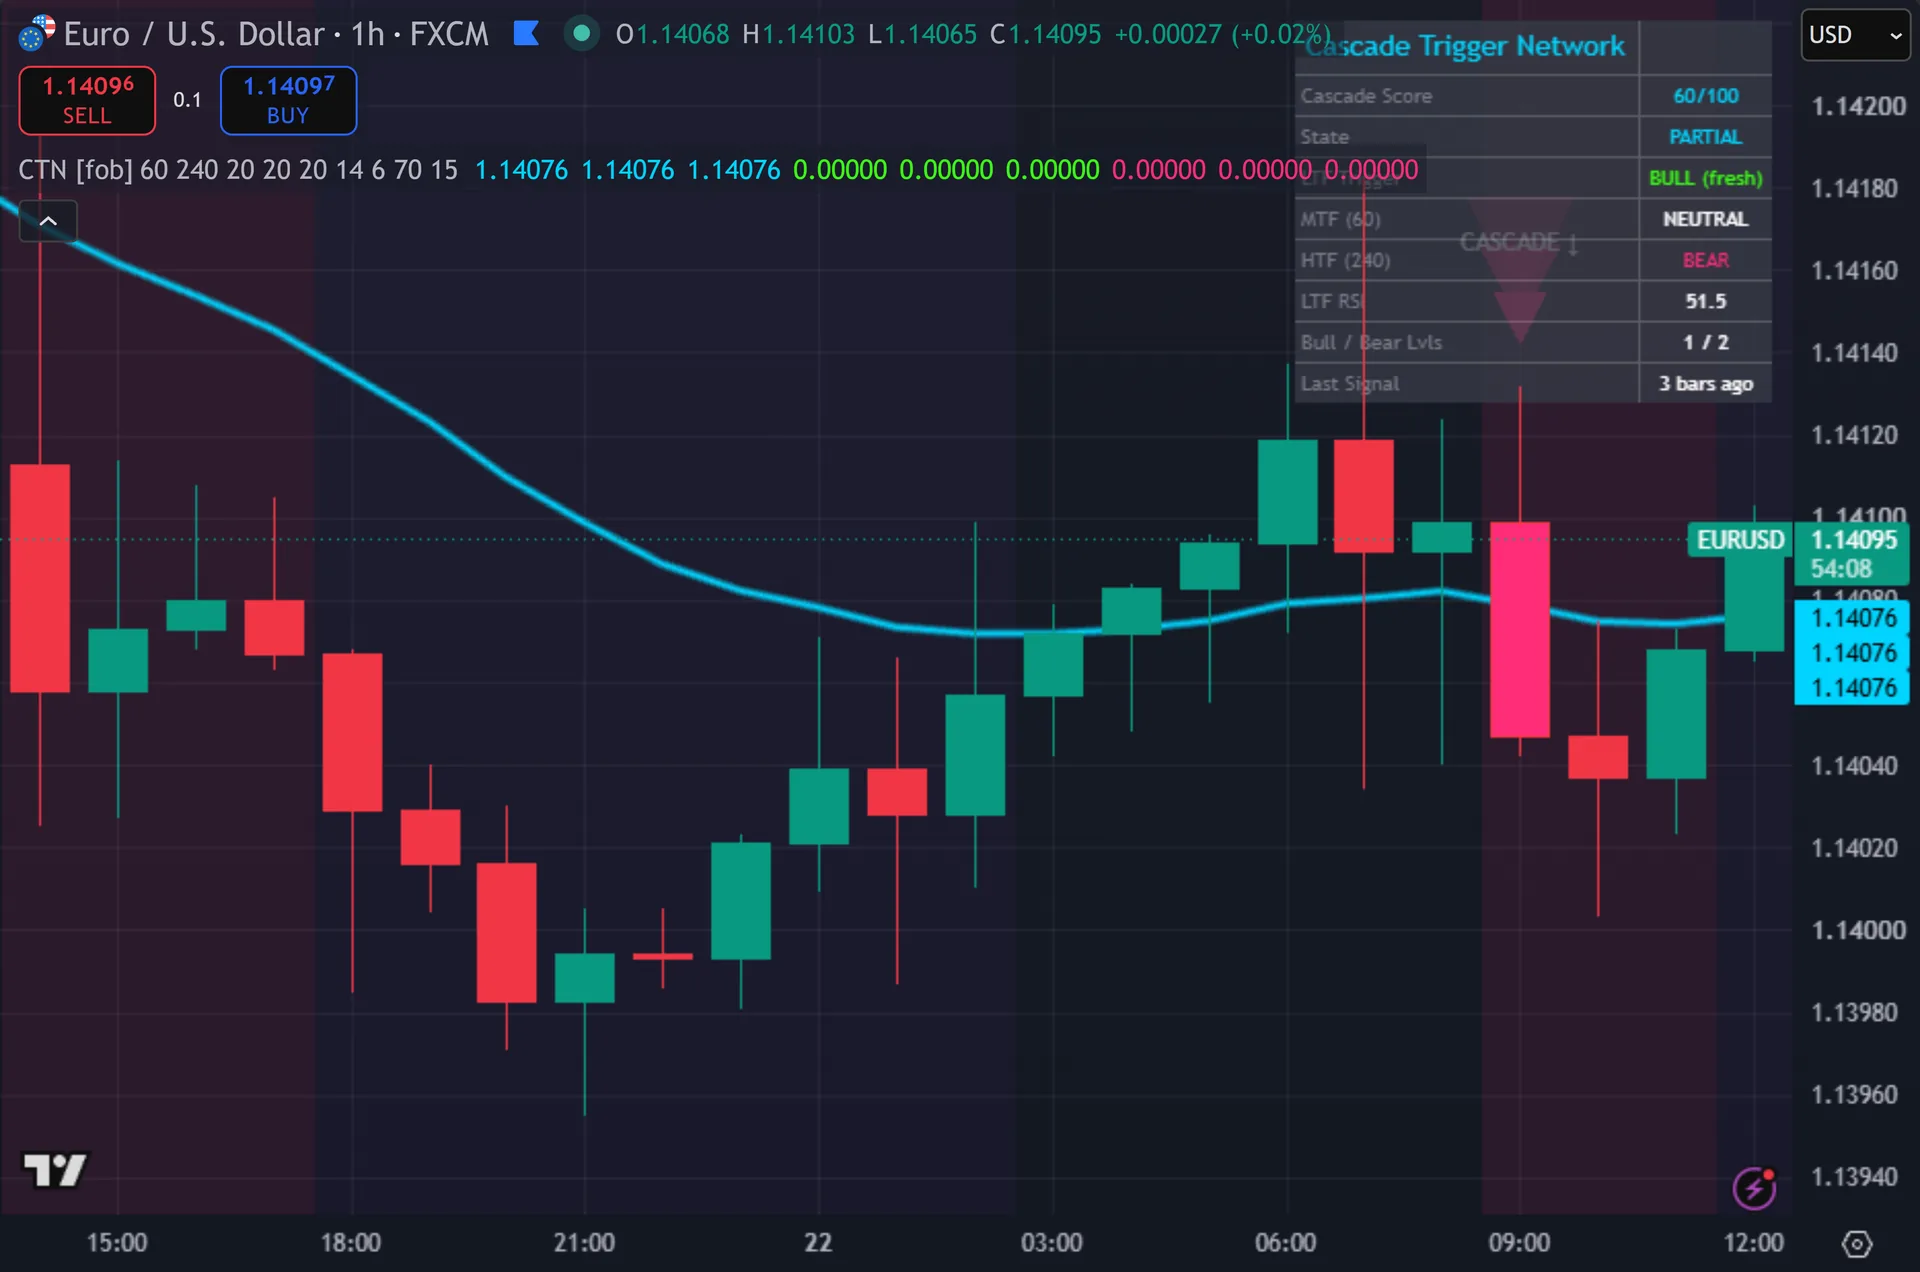
Check the level rows before you look for an arrow. Hence, MTF and HTF tell you the standing bias. When both read BULL, only a chart-level pullback and reclaim is missing. Next, that is a cascade waiting to complete, and it is the most useful state the dashboard shows.
Treat the score as a level count, not a probability. Sixty means two of three. Ninety means all three. Then, one hundred adds only the RSI extension on top. Nothing in that number measures how far price then travels.
Mind the higher-timeframe clock. Yet, a 4-hour EMA read on a 15-minute chart holds steady for sixteen bars, then updates in one step. Signals cluster around those updates. Truly, the last-signal row helps here, since it shows how long the current cooldown has been running.
Every Cascade Trigger Network setting explained
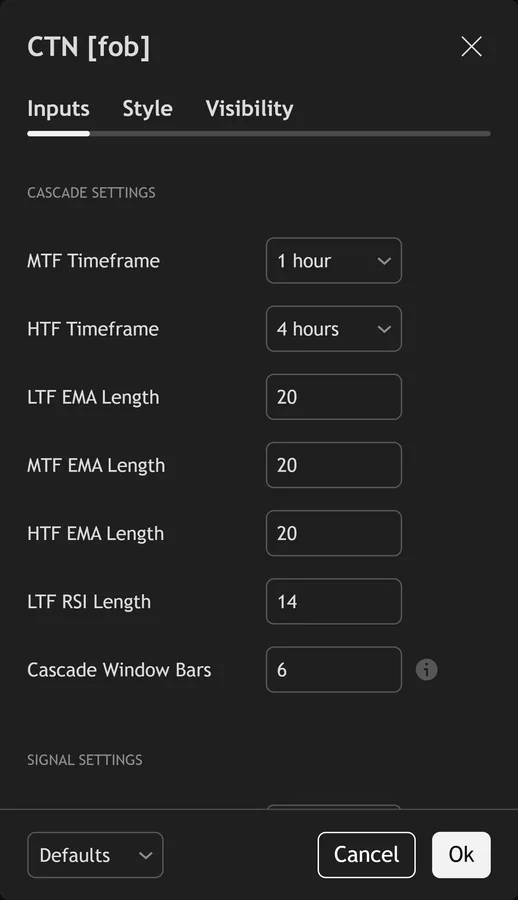
The script exposes 15 inputs, grouped in the settings panel exactly as shown below. Defaults are the published values.
Cascade Settings
| Setting | What it does | Default | Range |
|---|---|---|---|
| MTF Timeframe | Controls mtf timeframe. | 60 | |
| HTF Timeframe | Controls htf timeframe. | 240 | |
| LTF EMA Length | Sets the ltf ema length used in the calculation. | 20 | 5 to 100 |
| MTF EMA Length | Sets the mtf ema length used in the calculation. | 20 | 5 to 100 |
| HTF EMA Length | Sets the htf ema length used in the calculation. | 20 | 5 to 100 |
| LTF RSI Length | Sets the ltf rsi length used in the calculation. | 14 | 3 to 50 |
| Cascade Window Bars | Max bars between LTF trigger and final fire | 6 | 2 to 20 |
Signal Settings
| Setting | What it does | Default | Range |
|---|---|---|---|
| Cascade Score Threshold | Sets the cascade score threshold used in the calculation. | 70 | 40 to 95 |
| Signal Cooldown Bars | Sets the signal cooldown bars used in the calculation. | 15 | 3 to 50 |
Visual Settings
| Setting | What it does | Default | Range |
|---|---|---|---|
| Show Cascade Dashboard | Toggles show cascade dashboard on the chart. | on | on / off |
| Show Cascade Background | Toggles show cascade background on the chart. | on | on / off |
| Show 3-Layer Signal Glow | Toggles show 3-layer signal glow on the chart. | on | on / off |
| Show LTF EMA Glow | Toggles show ltf ema glow on the chart. | on | on / off |
| Buy Color | Colour used for buy color. | #39ff14 | |
| Sell Color | Colour used for sell color. | #ff2d78 |
Alerts built into Cascade Trigger Network
The script ships 11 alert conditions. Plainly, open the alert dialog on the chart, pick the indicator as the condition source, then choose the event you want. Alerts fire on the close of the bar, so they follow the same confirmed-bar rule the on-chart signals use.
- CTN Buy Cascade
- CTN Sell Cascade
- CTN Any Signal
- CTN Chained
- CTN LTF Bull Trigger
- CTN LTF Bear Trigger
- CTN Higher-TF Bull
- CTN Higher-TF Bear
- CTN Webhook JSON
Other markets and timeframes
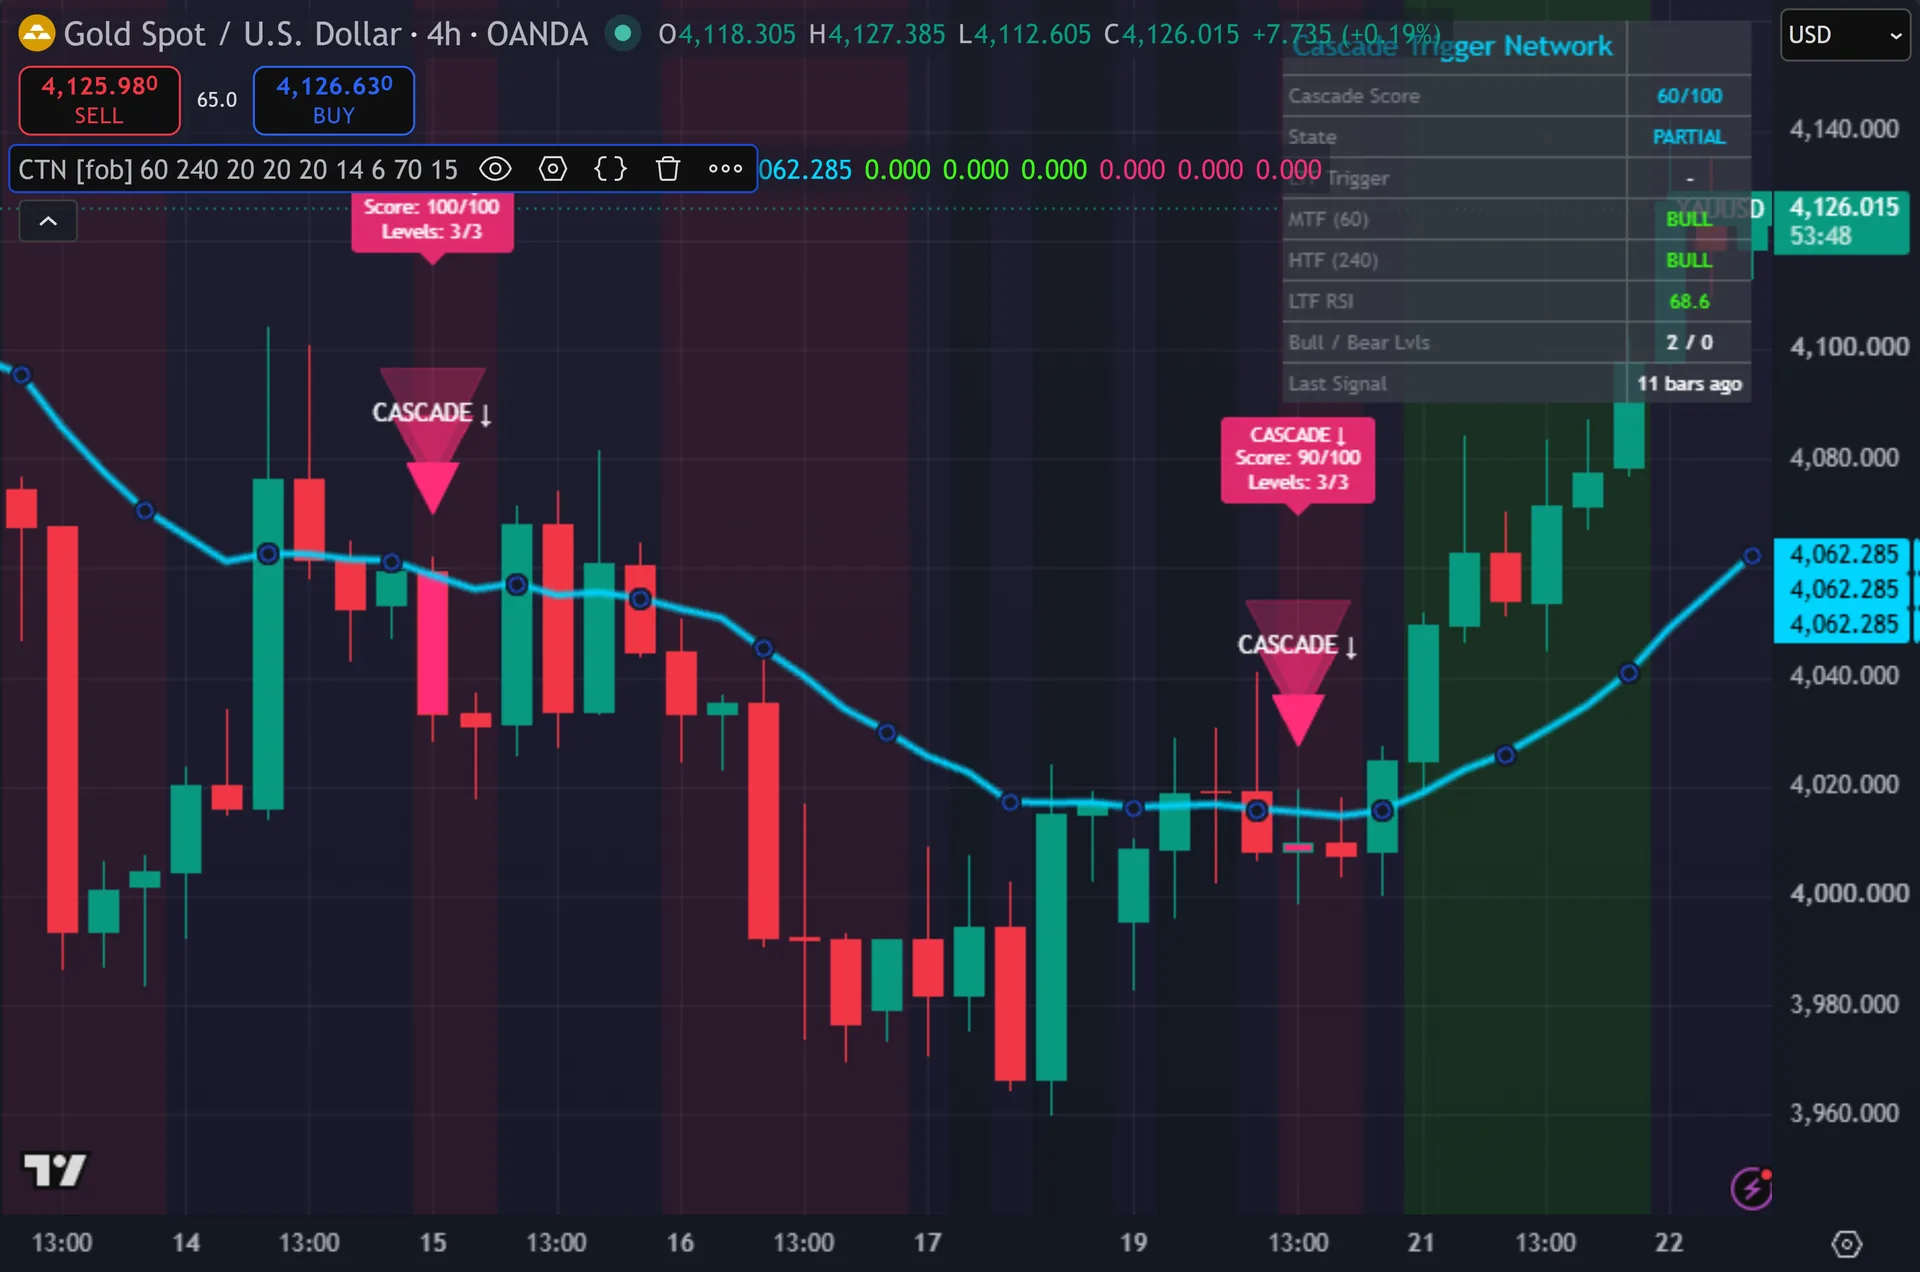
Nothing here ties to forex. Also, the script reads price only – no volume, no session filter and no pip-based distance. Every test stays relative: close against its own EMA, an EMA against its own value three bars back, RSI against 50. Indeed, so the defaults carry over to indices, metals and crypto without retuning. The two inputs worth changing are the timeframes. Still, a 60 and 240 pair suits a 15-minute chart. On a daily chart you would raise both.
Limitations worth knowing
It confirms alignment. It does not find turns. By design the script marks a trade only after three timeframes already point the same way, so it enters late in a move and stays quiet at the actual reversal.
Higher timeframe values still move in real time. Thus, lookahead is off, so no future data leaks in, but the forming 4-hour bar can flip from bullish to bearish before it closes. A cascade that looks complete mid-session can therefore come apart. Hence, historical bars never show this, which makes live trading choppier than the chart suggests.
The score cannot separate a strong alignment from a weak one. Next, three levels agreeing on a shallow drift and three levels agreeing on a hard trend both read 90. There is no slope magnitude, no ATR check and no volatility filter anywhere in the calculation.
Get Cascade Trigger Network on TradingView
Open Cascade Trigger Network on TradingView
If you also trade MetaTrader, the MT4 and MT5 indicator library is available below.
Get the complete indicator library
One email unlocks the full MT4 and MT5 indicator library. Then, this TradingView script stays free on TradingView – the button above adds it to your chart.
Using it alongside MetaTrader
Adding a script on TradingView takes one click, so there is no install step here. Yet, if you want the same idea on MetaTrader, the MT4 and MT5 indicator installation guide walks through copying files into the data folder and attaching them to a chart. You can also browse the full MetaTrader indicator library, the MT4 indicators section, or the other free TradingView scripts published on this profile. For related chart tools see the MT5 indicators section and the forex trading strategies guides.
External references
Frequently asked questions
Does Cascade Trigger Network repaint?
The arrow does not. Truly, signals gate on barstate.isconfirmed, so they print after the chart bar closes and then stay put. The higher timeframe legs behave differently live. Plainly, their values update while the 1-hour and 4-hour bars form, so those dashboard rows can change before the bars close.
Is it genuinely multi timeframe?
Yes. Also, the script makes six request.security calls, three for the 60-minute leg and three for the 240-minute leg, all with lookahead set to off. You can point either timeframe input wherever you like.
Why is the score always 0, 30, 60, 90 or 100?
Because it counts levels. Indeed, each aligned level adds a flat 30 points, and the RSI bonus adds 10 only when all three agree. There is no partial credit, so the number moves in steps rather than smoothly.
Which timeframe should I run it on?
Any timeframe works, provided the two inputs sit above it. Still, most traders run the chart at 15 minutes with the 60 and 240 defaults. On a 1-hour chart, move them up to 240 and D.
How much should I rely on this indicator?
Treat it as one input, not a decision. Thus, it is a chart analysis tool, not trading advice. Test it on your own markets and timeframes before relying on it. Results are not guaranteed; past performance is not indicative of future results.

About the author
Written by Dominic Walsh, a Forex trader and MT4/MT5 indicator, Expert Advisor and script developer. Every tool on forexmt4systems.com is tested on live charts before release and ships with ready-to-use compiled MT4 (.ex4) and MT5 (.ex5) files. Learn more about the trader and developer behind this site.
How we build, test and correct every tool: Editorial & Testing Policy. Trading carries risk; see the disclaimer.