
Chameleon Regime Adapter is a trend and range indicator TradingView traders use to stop applying one playbook everywhere. Also, the script reads ADX, Bollinger width, an ATR percentile and RSI, then names the market. Above an ADX of 22 it hunts pullbacks with the trend. Indeed, below it, the script fades Bollinger band touches instead. A score out of 100 gates every signal, and every signal waits for the bar to close.
It is free and open source. Still, you can add it to any chart from the Chameleon Regime Adapter script page on TradingView, and the full Pine source is published there for you to read.
What Chameleon Regime Adapter plots on the price chart
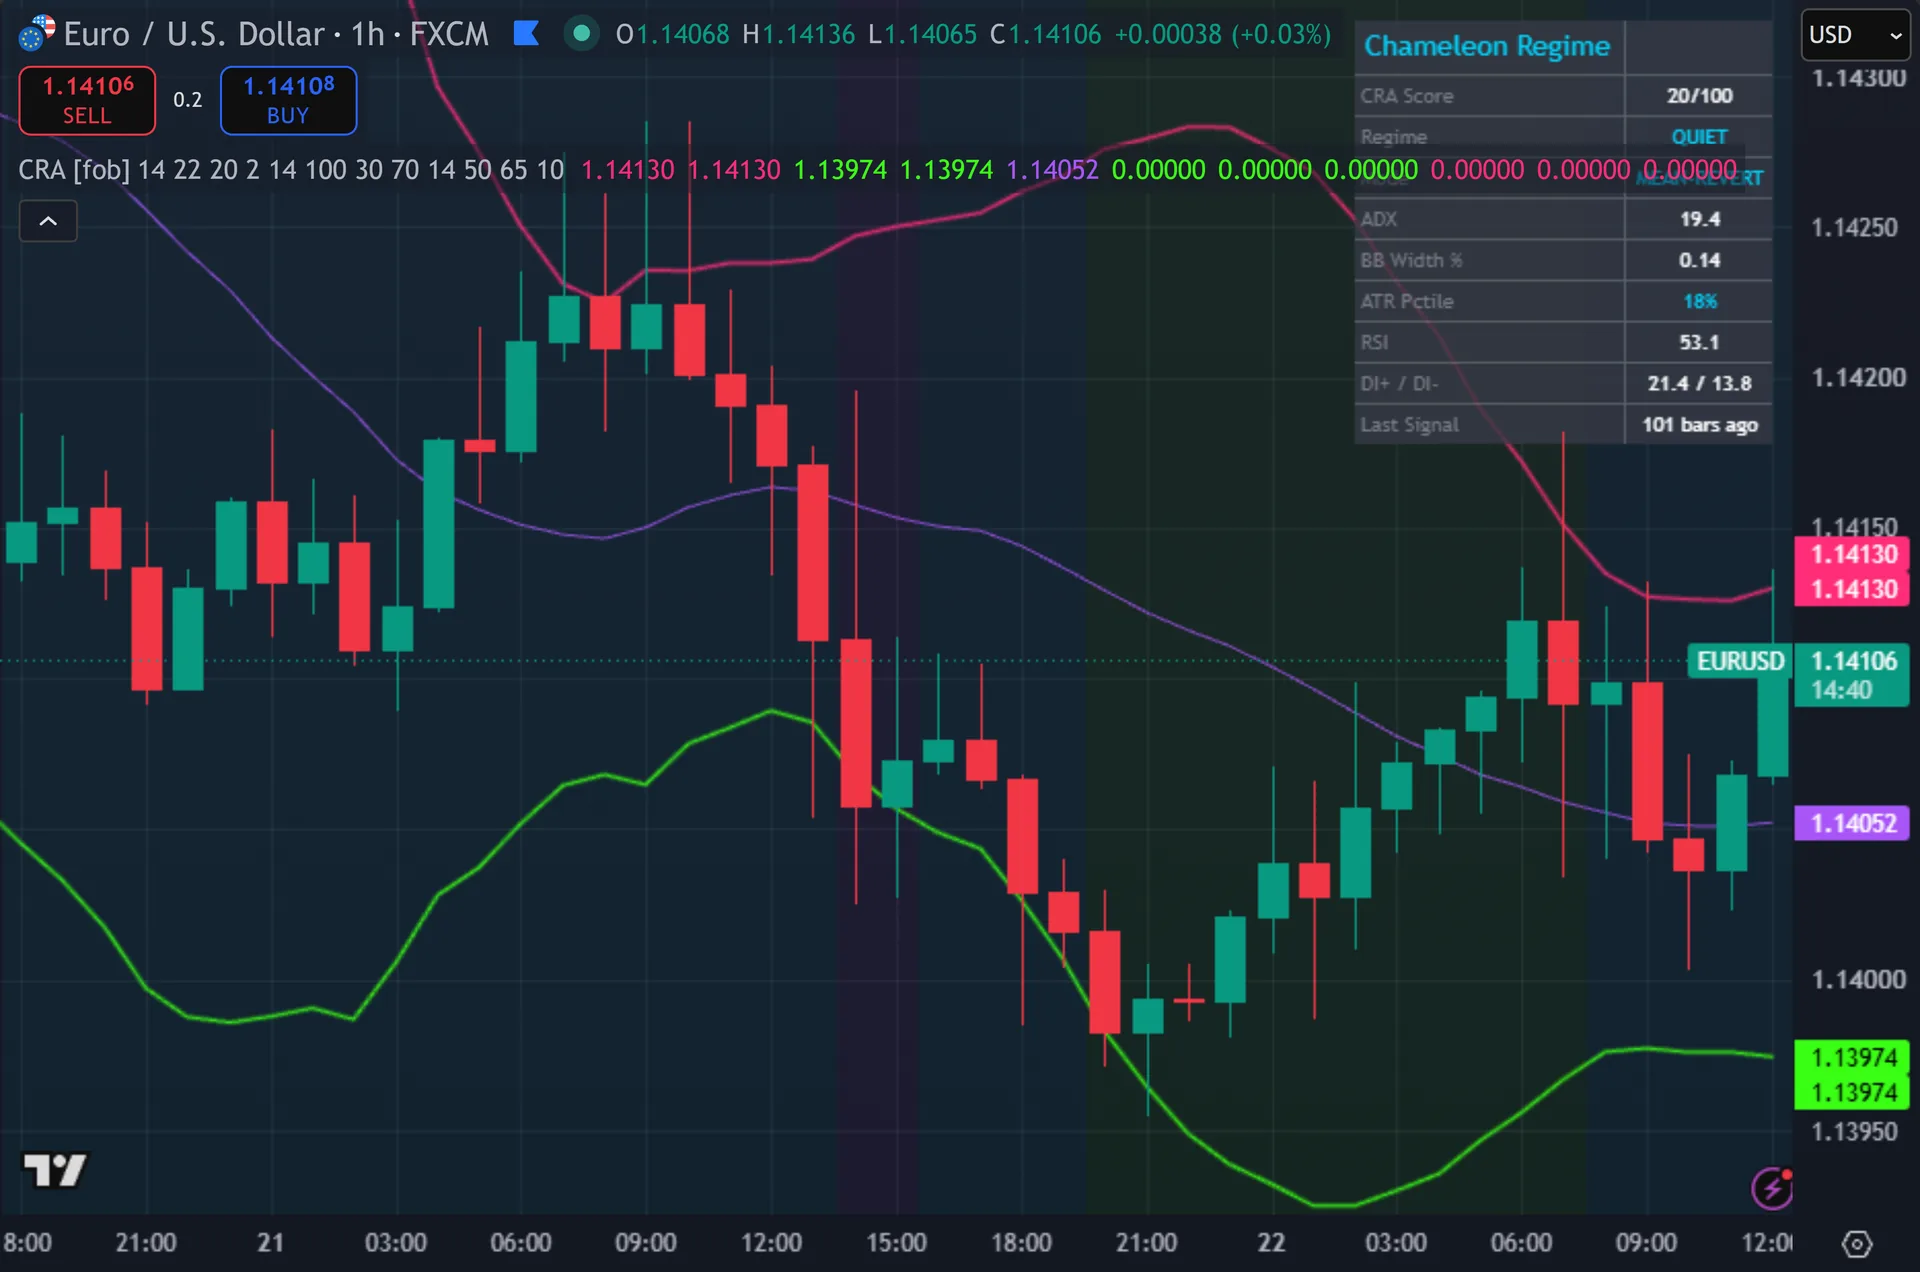
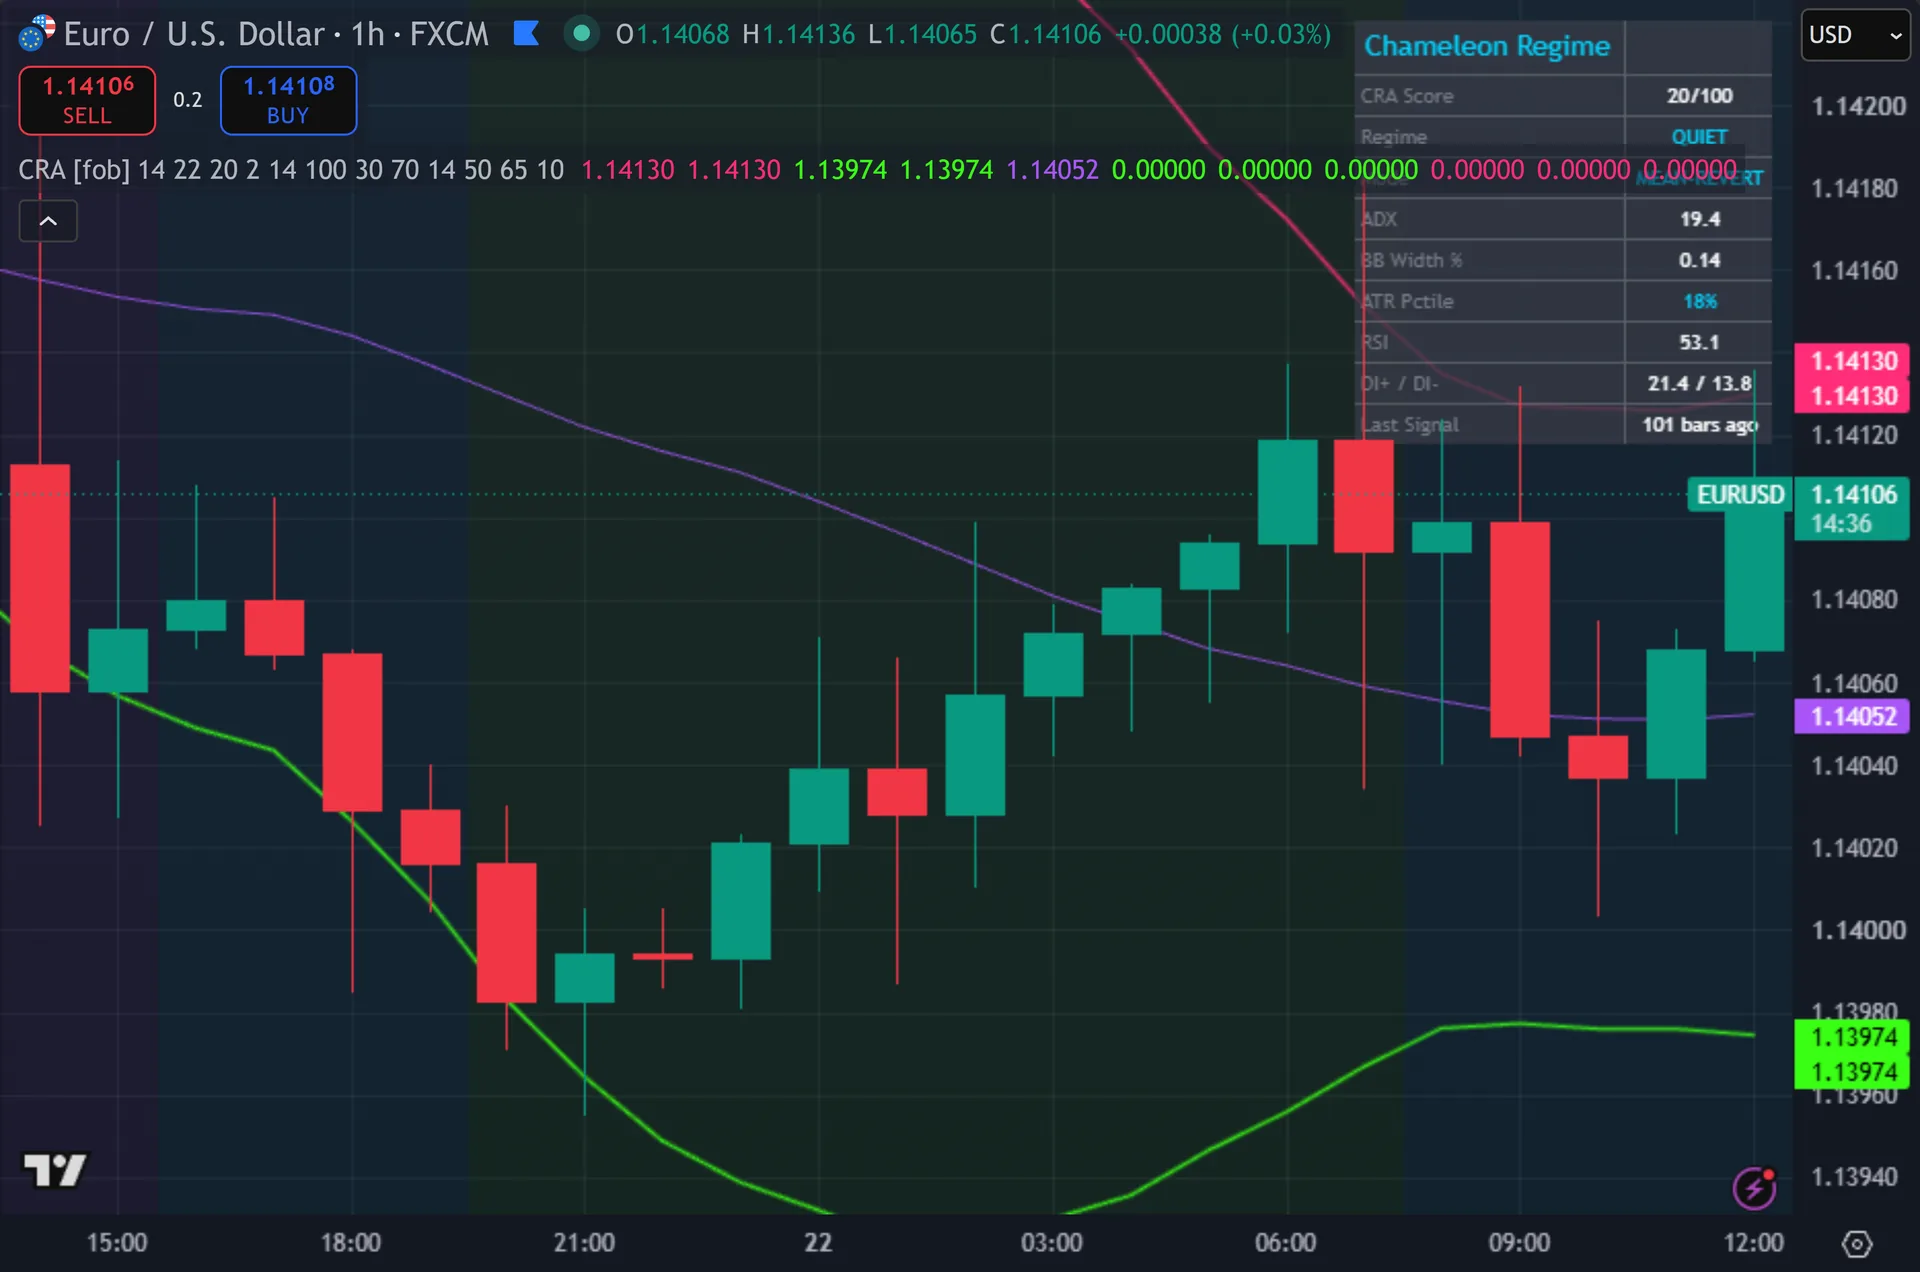
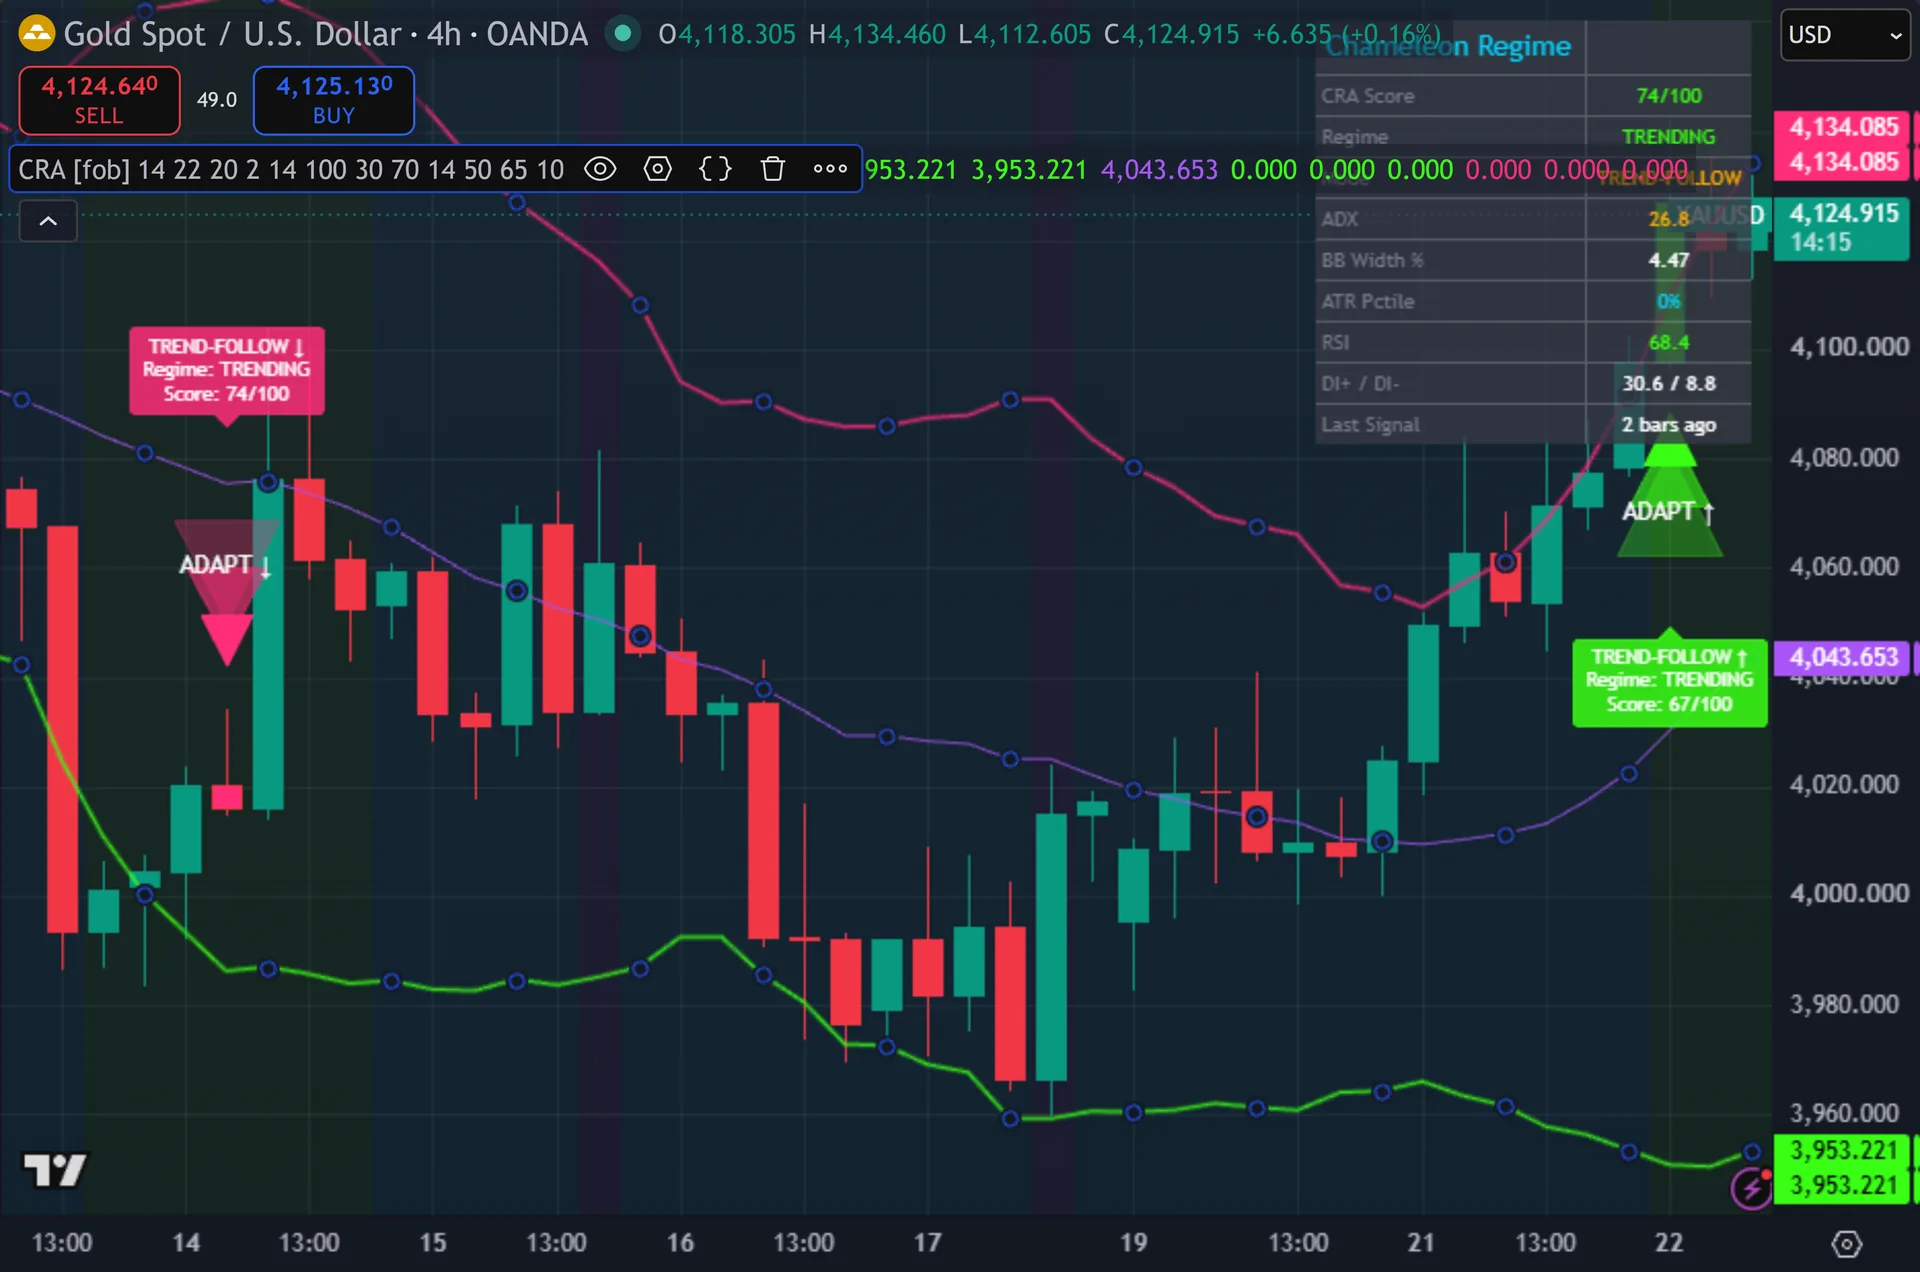
Bollinger bands sit on price, each drawn twice so a wide translucent stroke glows behind a thin bright one. Thus, pink marks the upper band, green the lower, purple the basis. The chart background tints by regime in gold, green, pink, cyan or purple. Hence, triangles mark signals, tagged ADAPT with an arrow and backed by two larger translucent triangles. Each signal also drops a label carrying the mode, the regime name and the score. Next, a ten-row dashboard reads out score, regime, mode, ADX, band width, ATR percentile, RSI and the DI pair.
How Chameleon Regime Adapter is built
Naming the regime
Four measurements feed the label. ta.dmi runs at length 14 and returns DI plus, DI minus and ADX. Then, a 20-period Bollinger set at 2.0 deviations gives band width as a percentage of its own basis. ATR over 14 bars goes through ta.percentrank across 100 bars, which ranks current volatility against its own recent history. RSI runs at 14.
The rules are blunt. ADX above 22 means trending. An ATR percentile above 70 means high volatility, below 30 means quiet. Yet, combining the two produces five names: TRENDING-WILD, TRENDING, VOLATILE-RANGE, QUIET and RANGE. The background colour follows that name.
Here is the honest part. Truly, only the ADX gate changes behaviour. Those five names look granular, but the signal code branches just twice, into trend-follow and mean-revert. Plainly, VOLATILE-RANGE, QUIET and RANGE all run the identical mean-reversion rules. The volatility labels inform you. Also, they do not alter the entry logic.
Two playbooks and one score
Trend mode wants full alignment. Indeed, a buy needs close above the 50-period EMA, that EMA rising across three bars, RSI above 50 and rising, and DI plus above DI minus. The sell needs all four conditions mirrored. Still, miss any one and nothing prints.
Range mode fades extremes. Thus, a buy needs close at or below the lower band, RSI under 35, and RSI rising over three bars. A sell needs close at or above the upper band, RSI above 65, and RSI falling over three bars.
The score adds three parts: ADX capped at 50, band width times five capped at 25, and a flat 25 whenever a setup exists. Hence, it needs 65 to pass, plus ten bars of cooldown and a confirmed close. Since every signal already carries the 25 alignment points, ADX and band width must supply 40 between them. Next, that matters on forex, where band width often reads under one percent and contributes barely five points. ADX then has to do almost all the work.
How to read the signals
Check the mode row before the arrow. Then, TREND-FOLLOW means the script is buying strength above the EMA. MEAN-REVERT means it is buying band touches. Yet, those are opposite instincts, so the same triangle carries a different meaning depending on which mode produced it. The signal label repeats the mode, so you never have to guess after the fact.
Read the score as trend strength plus volatility, not as setup quality. Truly, it is built from ADX, band width and a flat alignment bonus. A score of 80 tells you ADX is high and the bands are wide. Plainly, it does not judge whether fading or following suits the moment.
Expect the score maths to bite on forex majors. In range mode ADX sits under 22 by definition, so the total lands near 47 plus a small band width contribution. Band width on EURUSD intraday rarely adds the 18 points needed to reach 65. Also, if you want mean-reversion signals there, lower the Signal Score Threshold rather than waiting for them.
Every Chameleon Regime Adapter setting explained
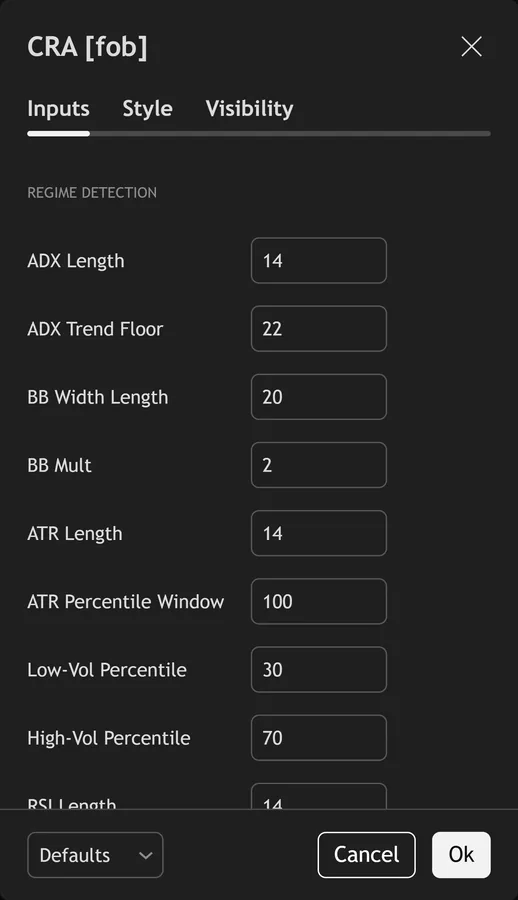
The script exposes 18 inputs, grouped in the settings panel exactly as shown below. Defaults are the published values.
Regime Detection
| Setting | What it does | Default | Range |
|---|---|---|---|
| ADX Length | Sets the adx length used in the calculation. | 14 | 5 to 50 |
| ADX Trend Floor | Sets the adx trend floor used in the calculation. | 22 | 15 to 40 |
| BB Width Length | Sets the bb width length used in the calculation. | 20 | 10 to 100 |
| BB Mult | Sets the bb mult used in the calculation. | 2.0 | 1.0 to 4.0 |
| ATR Length | Sets the atr length used in the calculation. | 14 | 5 to 50 |
| ATR Percentile Window | Sets the atr percentile window used in the calculation. | 100 | 30 to 300 |
| Low-Vol Percentile | Sets the low-vol percentile used in the calculation. | 30 | 10 to 50 |
| High-Vol Percentile | Sets the high-vol percentile used in the calculation. | 70 | 50 to 90 |
| RSI Length | Sets the rsi length used in the calculation. | 14 | 3 to 50 |
| Regime EMA Length | Sets the regime ema length used in the calculation. | 50 | 10 to 200 |
Signal Settings
| Setting | What it does | Default | Range |
|---|---|---|---|
| Signal Score Threshold | Sets the signal score threshold used in the calculation. | 65 | 40 to 95 |
| Signal Cooldown Bars | Sets the signal cooldown bars used in the calculation. | 10 | 3 to 50 |
Visual Settings
| Setting | What it does | Default | Range |
|---|---|---|---|
| Show Regime Dashboard | Toggles show regime dashboard on the chart. | on | on / off |
| Show Regime Background | Toggles show regime background on the chart. | on | on / off |
| Show 3-Layer Signal Glow | Toggles show 3-layer signal glow on the chart. | on | on / off |
| Show Bollinger Bands | Toggles show bollinger bands on the chart. | on | on / off |
| Buy Color | Colour used for buy color. | #39ff14 | |
| Sell Color | Colour used for sell color. | #ff2d78 |
Alerts built into Chameleon Regime Adapter
The script ships 11 alert conditions. Indeed, open the alert dialog on the chart, pick the indicator as the condition source, then choose the event you want. Alerts fire on the close of the bar, so they follow the same confirmed-bar rule the on-chart signals use.
- CRA Buy Adapt
- CRA Sell Adapt
- CRA Any Signal
- CRA Entered Trend
- CRA Entered Range
- CRA High Vol
- CRA Quiet
- CRA Any Bull Setup
- CRA Webhook JSON
Other markets and timeframes
This one does not travel unchanged. Still, ADX, the ATR percentile and RSI are all relative, so they behave the same everywhere. Band width does not. Thus, it reads as a percentage of the basis, so crypto and indices produce values many times larger than forex majors and saturate the 25-point cap easily. The same 65 threshold therefore gates far harder on EURUSD than on BTCUSD. Hence, set the threshold per instrument, and check the dashboard band width figure first.
Limitations worth knowing
The score measures conditions, not edge. Next, it combines trend strength and band width with a fixed alignment bonus. Nothing in it evaluates whether trend-following or fading actually suits the current market. Then, a high score simply means a strong, wide market with a setup present.
Five regime names describe only two behaviours. Yet, the volatility half of the classification colours the background and fills a dashboard row, but the entry rules split on ADX alone. Do not expect VOLATILE-RANGE and QUIET to trade differently, because they do not.
It marks entries and stops there. Truly, there is no exit rule, no stop, no target and no sizing. ADX also lags, so the regime can flip a few bars after a signal prints and the script will not flag that. Plainly, the ten-bar cooldown suppresses a second genuine setup that follows soon after the first.
Get Chameleon Regime Adapter on TradingView
Open Chameleon Regime Adapter on TradingView
If you also trade MetaTrader, the MT4 and MT5 indicator library is available below.
Get the complete indicator library
One email unlocks the full MT4 and MT5 indicator library. Also, this TradingView script stays free on TradingView – the button above adds it to your chart.
Using it alongside MetaTrader
Adding a script on TradingView takes one click, so there is no install step here. Indeed, if you want the same idea on MetaTrader, the MT4 and MT5 indicator installation guide walks through copying files into the data folder and attaching them to a chart. You can also browse the full MetaTrader indicator library, the MT4 indicators section, or the other free TradingView scripts published on this profile. For related chart tools see the MT5 indicators section and the forex trading strategies guides.
External references
- Average true range on Wikipedia
- ADX at Investopedia
- Raff Regression Channel at StockCharts ChartSchool
Frequently asked questions
Does the Chameleon Regime Adapter repaint?
No. Still, both signal flags require barstate.isconfirmed, and the triangles, glow layers and labels all read those flags. Signals print after the bar closes and stay put. Thus, the dashboard values update live on the last bar, which is normal, but nothing already marked moves.
Is it multi-timeframe?
No. Hence, the script contains no request.security call, so every calculation runs on the chart timeframe you have open. If you want a higher timeframe regime view, load a second copy of the indicator on a second chart.
Why do I get so few signals on EURUSD?
The score is the usual culprit. Next, band width enters as a percentage of the basis, and forex majors produce small values, so that term contributes only a few points. In range mode ADX also sits under 22 by definition. Then, the total then struggles to reach the default 65. Lower the Signal Score Threshold and watch the dashboard to find a level that fits your chart.
What do the five regime colours mean?
Gold marks TRENDING-WILD, green TRENDING, pink VOLATILE-RANGE, cyan QUIET and purple RANGE. Yet, they come from ADX against 22 and the ATR percentile against 30 and 70. They tell you the conditions the signal formed in. Truly, only the ADX part changes which playbook the script uses.
How much should I rely on this indicator?
Treat it as one input, not a decision. Plainly, it is a chart analysis tool, not trading advice. Test it on your own markets and timeframes before relying on it. Results are not guaranteed; past performance is not indicative of future results.

About the author
Written by Dominic Walsh, a Forex trader and MT4/MT5 indicator, Expert Advisor and script developer. Every tool on forexmt4systems.com is tested on live charts before release and ships with ready-to-use compiled MT4 (.ex4) and MT5 (.ex5) files. Learn more about the trader and developer behind this site.
How we build, test and correct every tool: Editorial & Testing Policy. Trading carries risk; see the disclaimer.