
Conformal Prediction Bands turns split-conformal inference into a prediction bands indicator TradingView traders can read at a glance. A 21-period EMA supplies the point forecast. The last 200 absolute residuals form the calibration set. The script takes the 90th percentile of those residuals and plots it either side of the EMA. Band width therefore comes from measured error, not from a standard deviation assumption about returns.
It is free and open source. You can add it to any chart from the Conformal Prediction Bands script page on TradingView, and the full Pine source is published there for you to read.
What Conformal Prediction Bands plots on the price chart
Three lines sit on the price chart. The cyan midline is the base EMA. A green upper band and a pink lower band sit one quantile above and below it. A translucent fill joins them when you leave that option on. Triangles mark signals, each drawn three times at different sizes to build a glow. Signal bars also get a colour wash. A nine-row table shows state, EMA value, the q half-width, alpha, target coverage, measured coverage, calibration size and position.
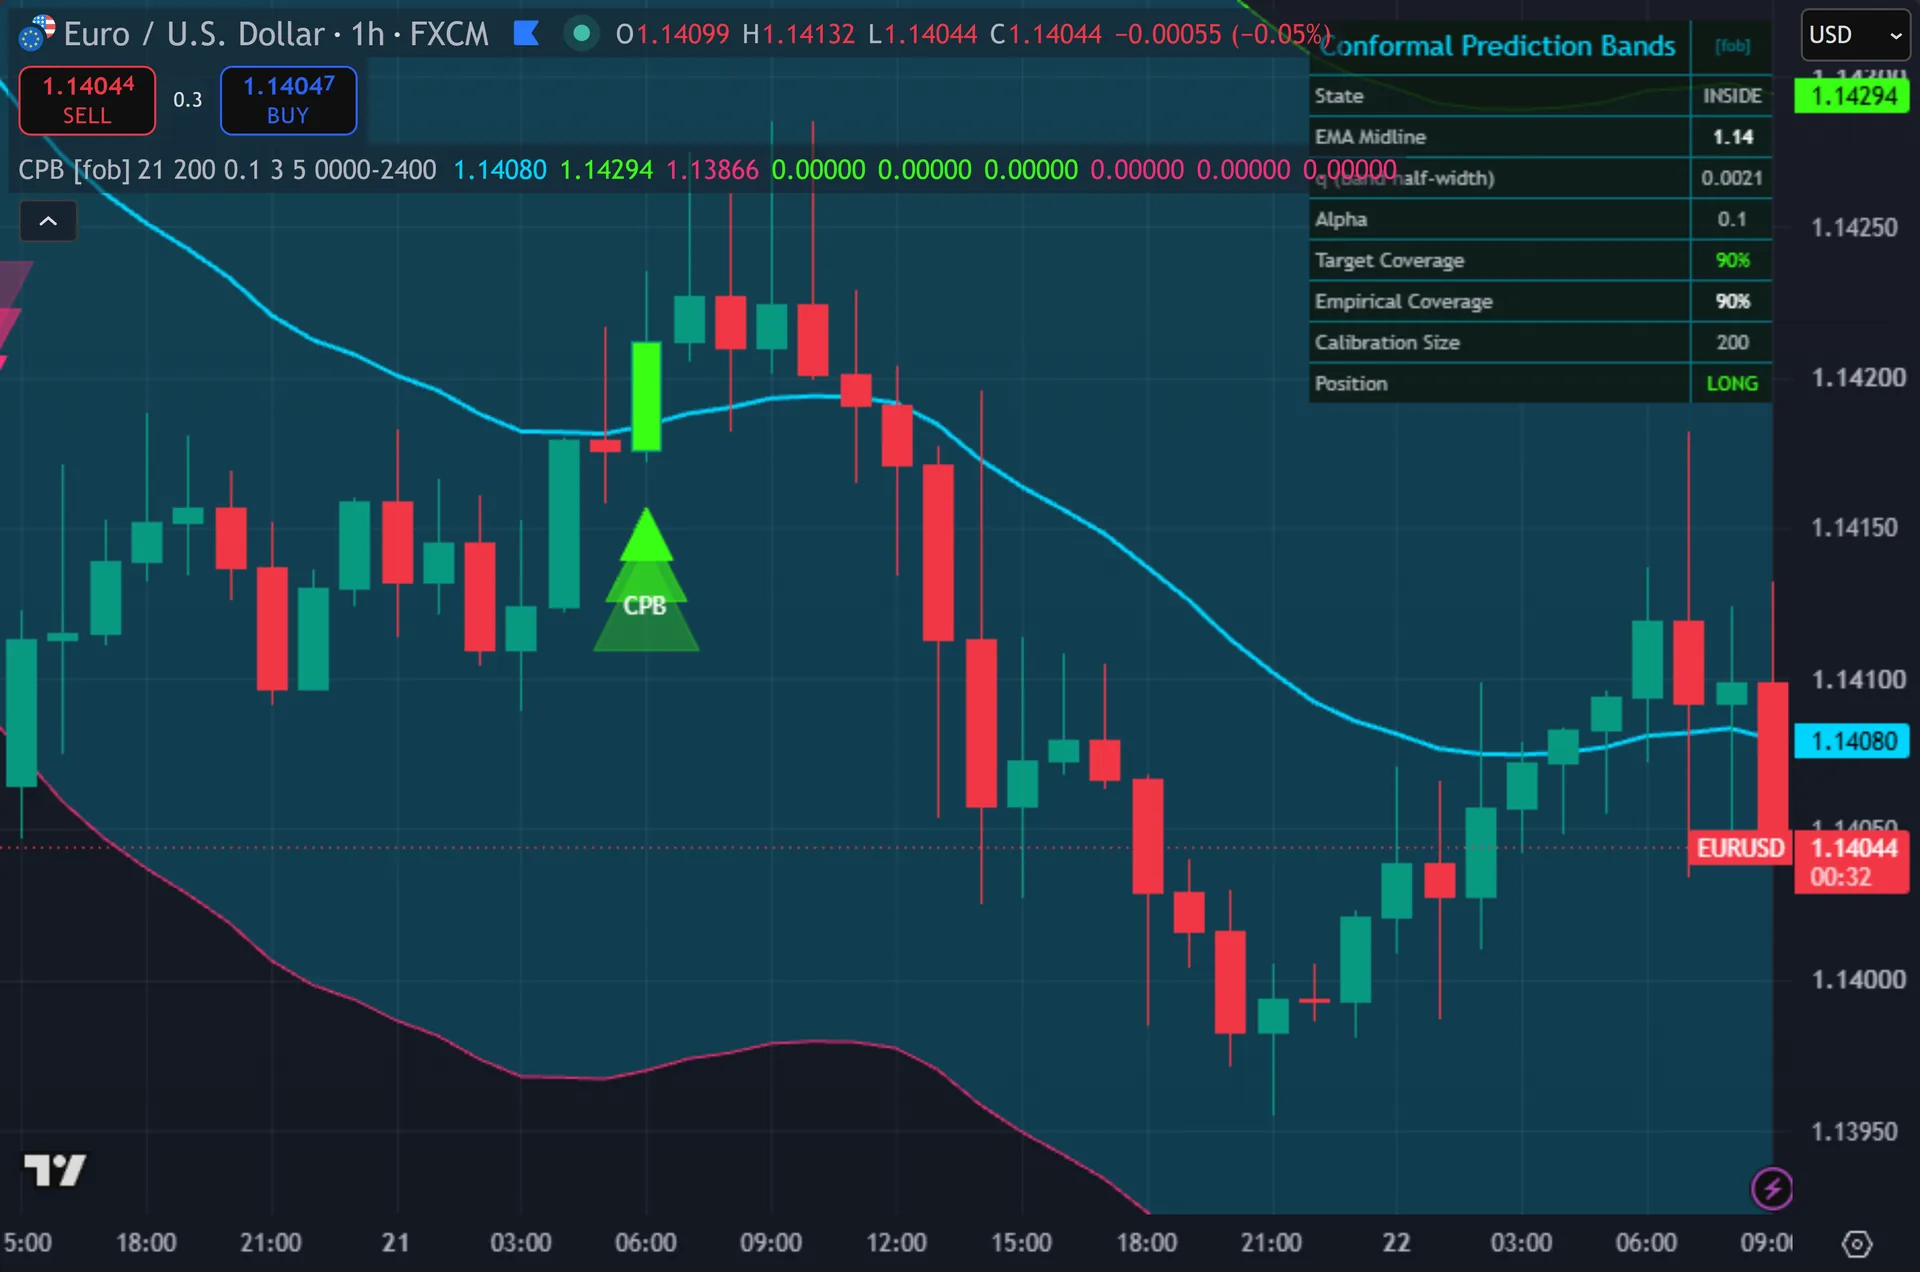
How Conformal Prediction Bands is built
From residuals to a band width
The base forecast is a 21-period EMA of close. On every confirmed bar the script measures the absolute residual, which is the gap between close and that EMA. It pushes the value into an array. Once the array holds more than 200 entries, the oldest one shifts out.
The quantile step copies the array, sorts it, then picks the index at 0.9 times the array length minus one. Alpha defaults to 0.1, so coverage targets 90 percent. The script interpolates between the two neighbouring residuals, which keeps band width from jumping. That value becomes q.
Upper equals EMA plus q. Lower equals EMA minus q. Because q comes from the last 200 real errors, the width adapts to each instrument on its own. Set alpha to 0.05 for 95 percent bands or 0.2 for tighter 80 percent bands.
Signal gating
Trend direction comes from slope, defined as the EMA now minus the EMA three bars ago. A breakout long needs close above the upper band and a positive slope. A breakout short needs close below the lower band and a negative slope.
The script adds a second, more frequent trigger. A reclaim long fires when close crosses over the EMA midline while slope stays positive. The mirror rule applies for shorts. Both routes still need at least 20 calibrated residuals before anything prints on the chart.
Three filters then trim the output. A position state blocks a second long until a short intervenes. A cooldown of 5 bars blocks rapid repeats. Every signal waits for barstate.isconfirmed, so nothing appears mid-bar and nothing repaints. An optional session window can restrict signals to set hours.
How to read the signals
Start with the empirical coverage cell. It counts how many calibration residuals sit at or below q, then reports that share as a percentage. The number should hover near your target. A wide gap tells you the market moved faster than the calibration window could follow.
Treat the bands as a normal-range map. Price inside the band means the EMA forecast holds within its usual error. A close outside the band is rare by construction, roughly one bar in ten at the default alpha of 0.1.
Watch q itself in the dashboard. A rising q means errors are growing and the market is expanding. A falling q means compression. Two alert conditions fire on exactly those two events, so you can track the shift without staring at the chart.
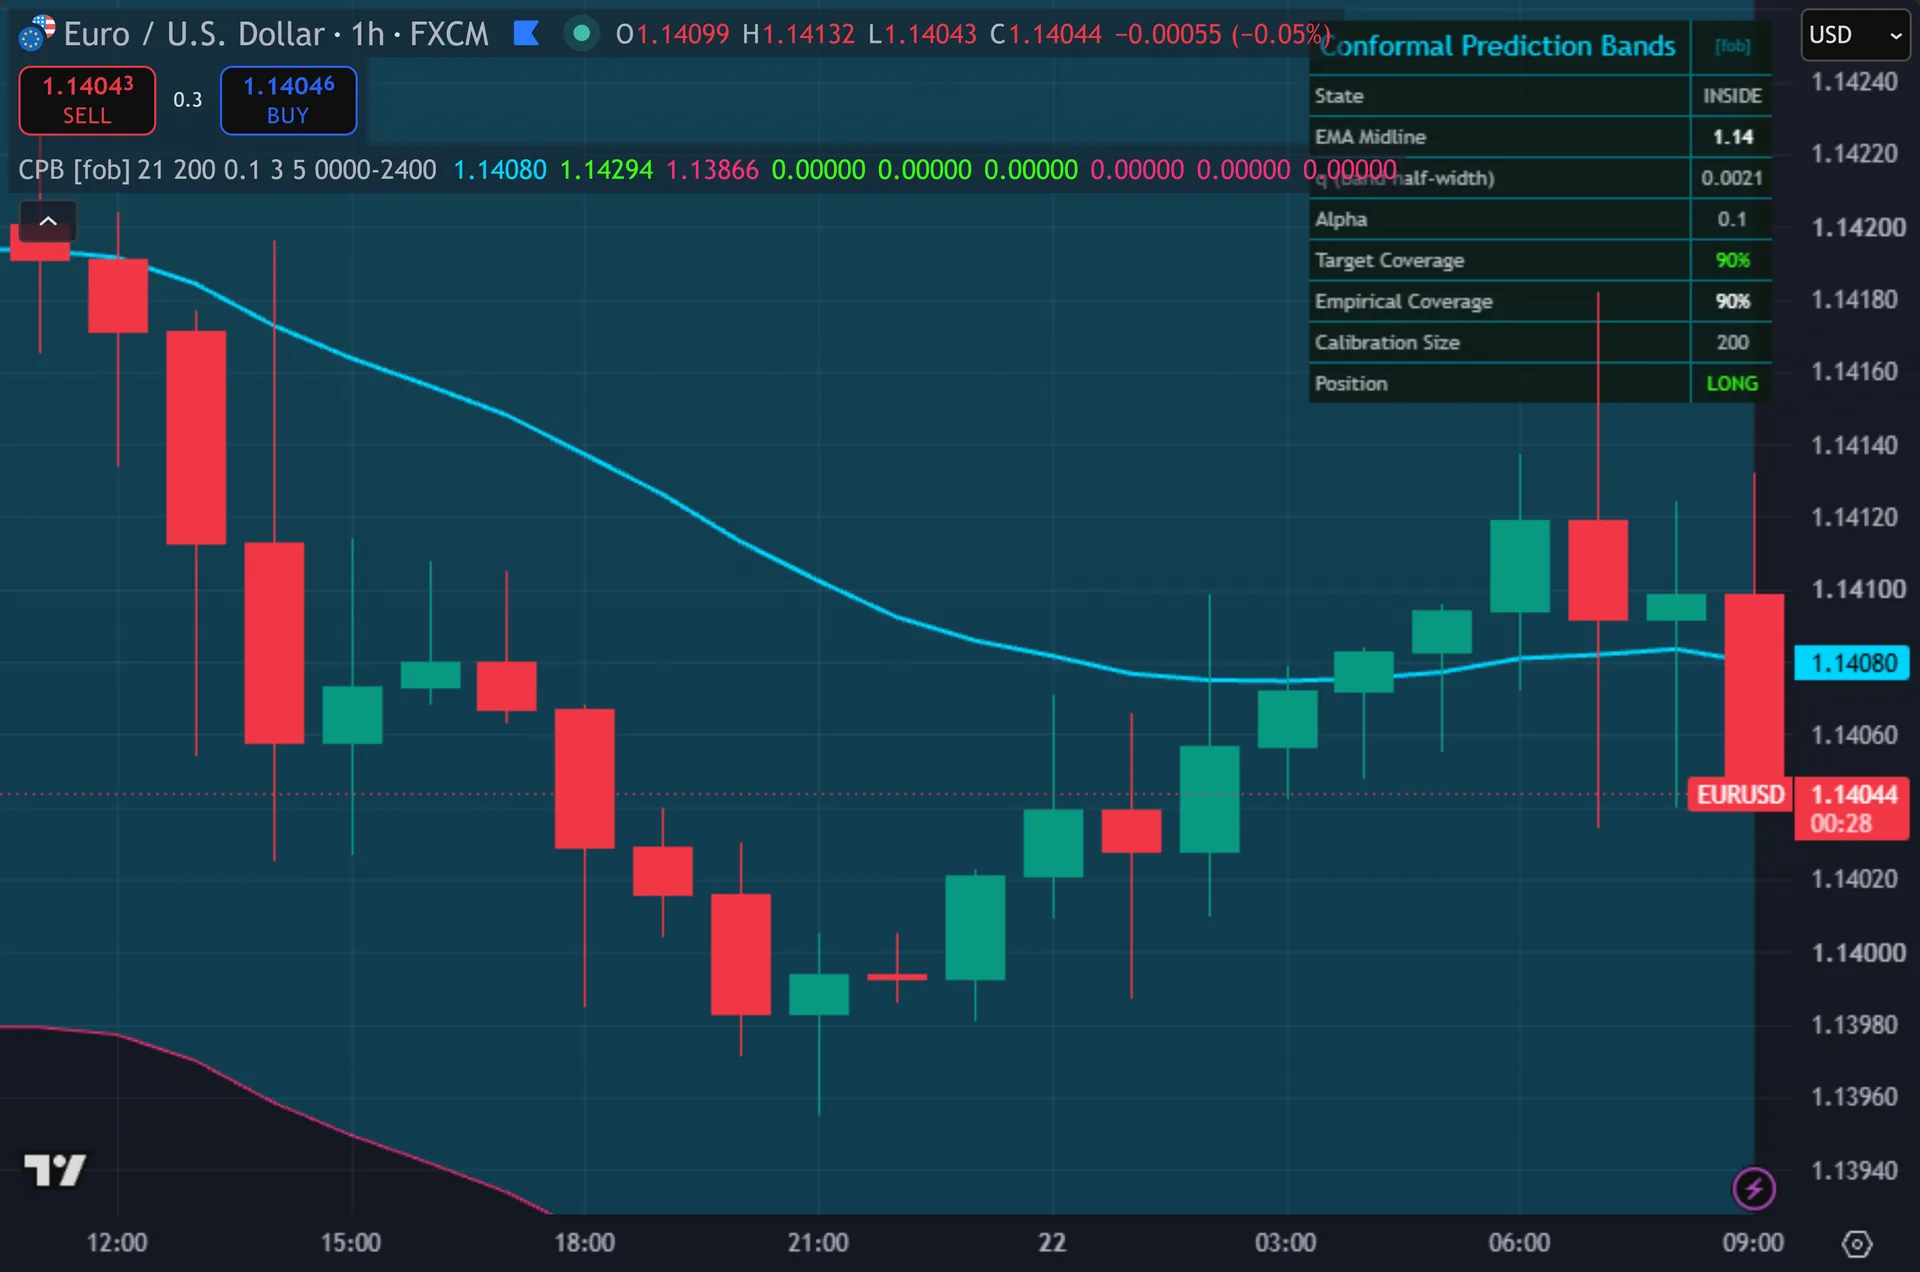
Every Conformal Prediction Bands setting explained
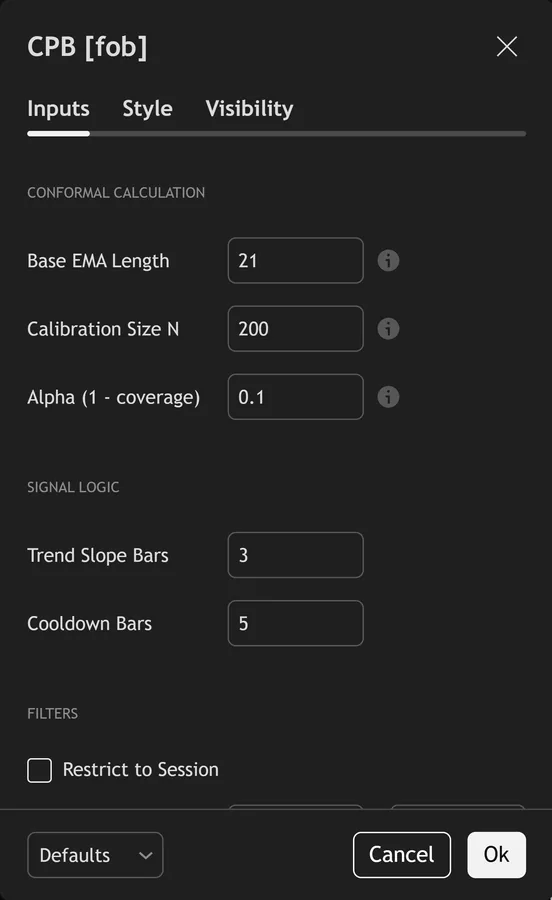
The script exposes 15 inputs, grouped in the settings panel exactly as shown below. Defaults are the published values.
Conformal Calculation
| Setting | What it does | Default | Range |
|---|---|---|---|
| Base EMA Length | Base point-forecast underlying the prediction bands. | 21 | 2 to 200 |
| Calibration Size N | Number of recent absolute residuals used to compute the conformal quantile. | 200 | 20 to 500 |
| Alpha (1 – coverage) | Miscoverage rate. 0.1 = 90% bands, 0.2 = 80% bands, 0.05 = 95% bands. | 0.1 | 0.01 to 0.5 |
Signal Logic
| Setting | What it does | Default | Range |
|---|---|---|---|
| Trend Slope Bars | Sets the trend slope bars used in the calculation. | 3 | 1 to 20 |
| Cooldown Bars | Sets the cooldown bars used in the calculation. | 5 | 1 to 60 |
Filters
| Setting | What it does | Default | Range |
|---|---|---|---|
| Restrict to Session | Toggles restrict to session on the chart. | off | on / off |
| Session Window | Controls session window. | 0000-2400 |
Visual
| Setting | What it does | Default | Range |
|---|---|---|---|
| Show Dashboard | Toggles show dashboard on the chart. | on | on / off |
| Show 3-Layer Glow | Toggles show 3-layer glow on the chart. | on | on / off |
| Fill Band Interior | Toggles fill band interior on the chart. | on | on / off |
| Buy Color | Colour used for buy color. | #39ff14 | |
| Sell Color | Colour used for sell color. | #ff2d78 | |
| EMA Midline | Colour used for ema midline. | #00d4ff | |
| Band Color | Colour used for band color. | color.new(#00d4ff, 80) | |
| Dashboard BG | Colour used for dashboard bg. | color.new(#0c1810, 16) |
Alerts built into Conformal Prediction Bands
The script ships 13 alert conditions. Open the alert dialog on the chart, pick the indicator as the condition source, then choose the event you want. Alerts fire on the close of the bar, so they follow the same confirmed-bar rule the on-chart signals use.
- CPB Buy
- CPB Sell
- CPB Any Signal
- CPB Above Band
- CPB Below Band
- CPB Upper Cross
- CPB Lower Cross
- CPB Bands Widening
- CPB Bands Tightening
- CPB Inside Bands
- CPB Webhook JSON
Other markets and timeframes
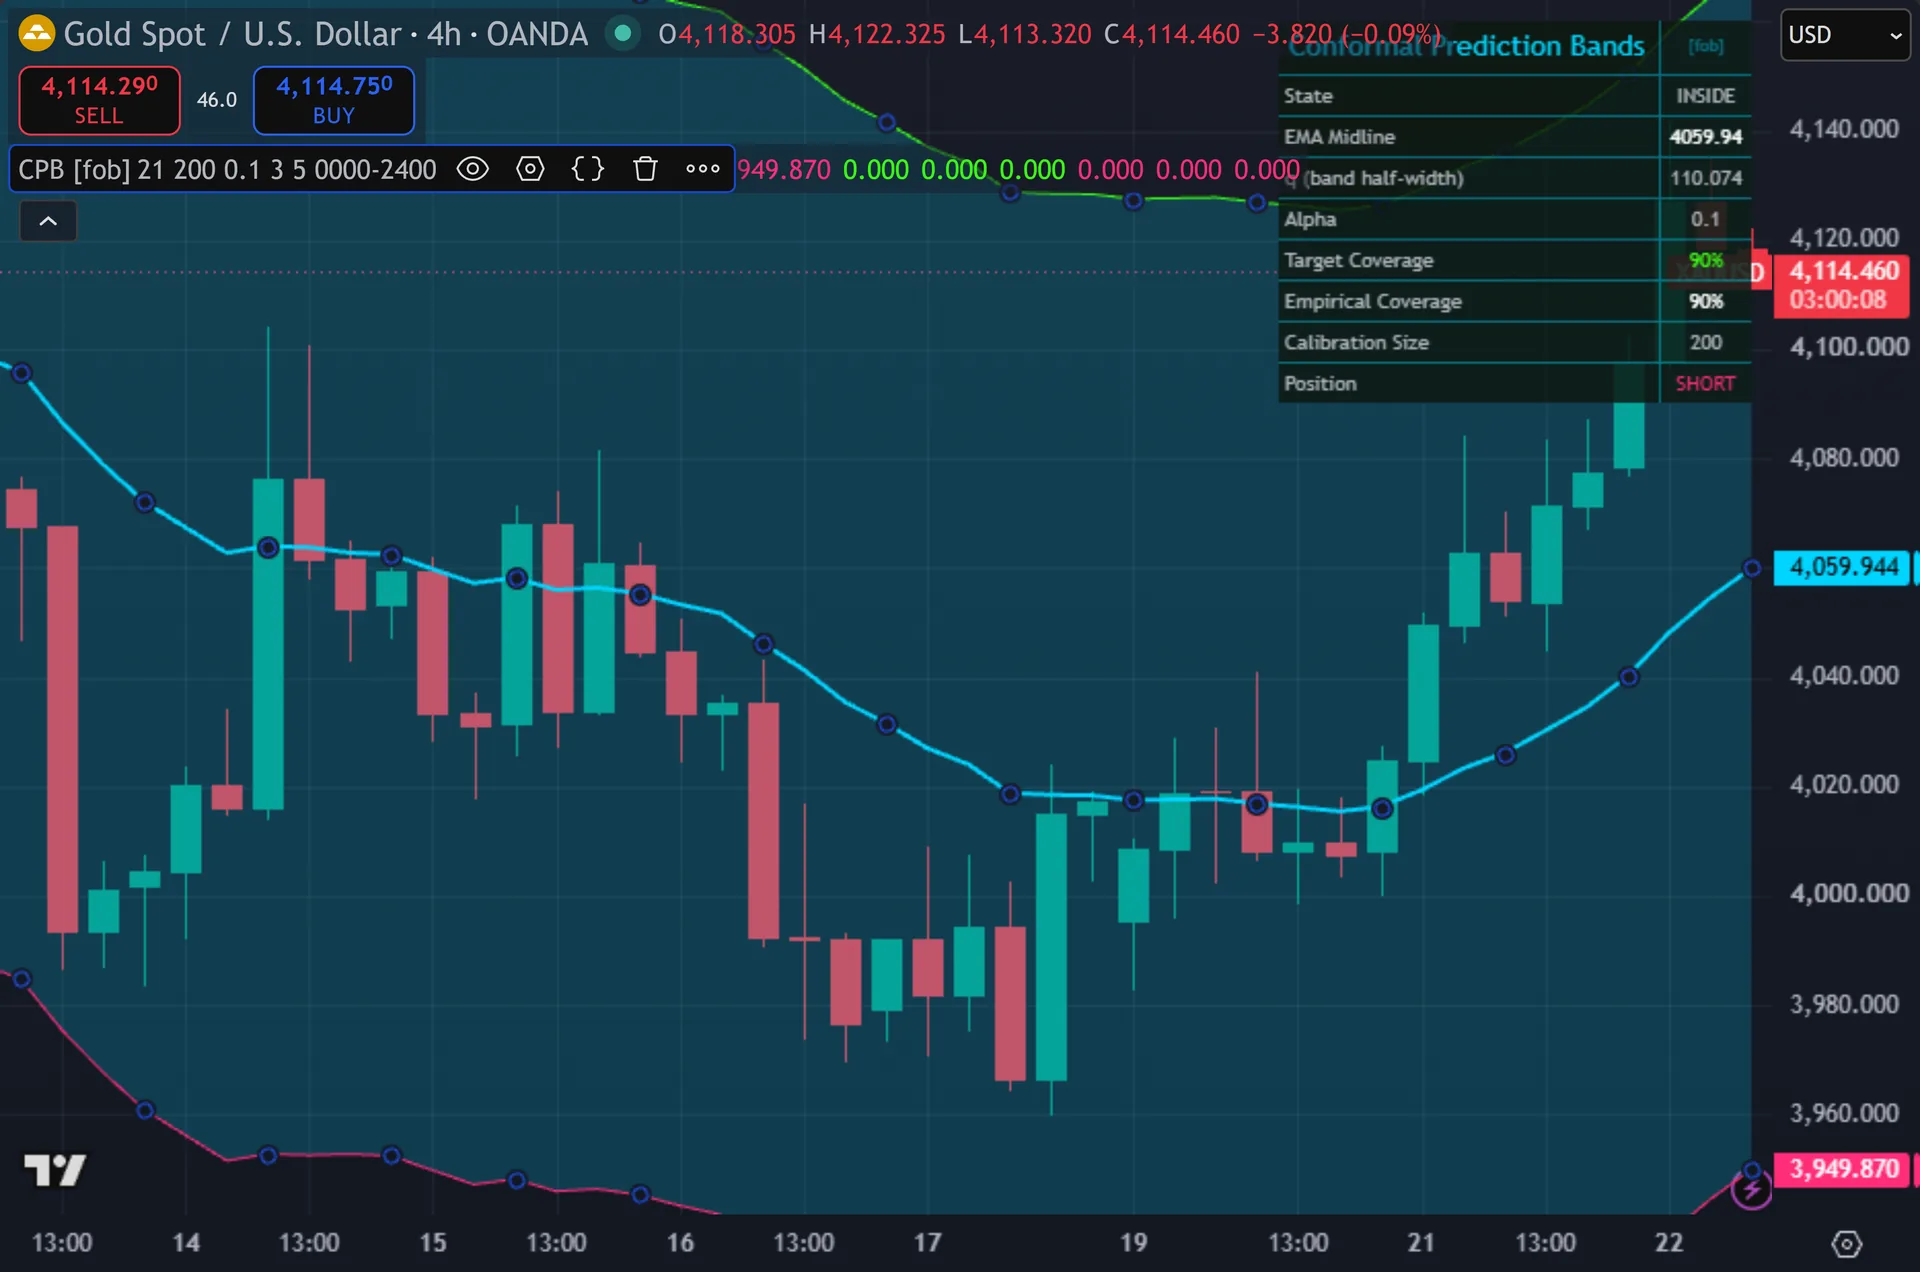
Nothing in the calculation uses fixed price units. The half-width q comes from the instrument’s own recent residuals, so a yen pair, a crypto pair and an index each build their own scale. Alpha and calibration size stay the same everywhere. Volume never enters the maths, so thin forex volume feeds cause no trouble here. History is the one real requirement. The script needs 200 confirmed bars to fill the calibration set and at least 20 before signals start.
Limitations worth knowing
Conformal coverage assumes exchangeability. Markets break that assumption during regime shifts. When volatility jumps, the calibration set still holds calm-market residuals, so the bands sit too narrow until the window refills.
The indicator publishes no stop, no target and no position size. It marks entries only. You still supply the exit rules and the risk plan around it.
The reclaim trigger fires far more often than the pure band breakout. That lifts signal count and lowers selectivity. For the strict conformal reading, ignore the midline crosses and use only the outside-band prints. Past performance does not predict future results.
Get Conformal Prediction Bands on TradingView
Open Conformal Prediction Bands on TradingView
If you also trade MetaTrader, the MT4 and MT5 indicator library is available below.
Get the complete indicator library
One email unlocks the full MT4 and MT5 indicator library. This TradingView script stays free on TradingView – the button above adds it to your chart.
Using it alongside MetaTrader
Adding a script on TradingView takes one click, so there is no install step here. If you want the same idea on MetaTrader, the MT4 and MT5 indicator installation guide walks through copying files into the data folder and attaching them to a chart. You can also browse the full MetaTrader indicator library, the MT4 indicators section, or the other free TradingView scripts published on this profile. For related chart tools see the MT5 indicators section and the forex trading strategies guides.
External references
- Bollinger Bands on Wikipedia
- Bollinger Bands at Investopedia
- Raff Regression Channel at StockCharts ChartSchool
Frequently asked questions
Does Conformal Prediction Bands repaint?
No. Residuals enter the calibration set only on confirmed bars, and both signal flags carry a barstate.isconfirmed gate. A triangle printed on a closed bar stays where it is.
What does the alpha input change?
Alpha sets the miscoverage rate. The default 0.1 targets 90 percent coverage, so about one close in ten should land outside the bands. Drop it to 0.05 for wider 95 percent bands. Raise it to 0.2 for tighter 80 percent bands and more breakout events.
How does this differ from Bollinger Bands?
Bollinger width comes from standard deviation, which assumes a roughly normal spread. Conformal width comes from the ranked size of real past errors, with no distribution assumption at all. Large past errors stay in the sample and push the band out rather than being averaged away.
How much history does it need?
Signals start once 20 residuals exist. Full calibration takes 200 confirmed bars at the default setting, and the script declares max_bars_back of 500. Load a chart with several hundred bars before you judge the output.
How much should I rely on this indicator?
Treat it as one input, not a decision. It is a chart analysis tool, not trading advice. Test it on your own markets and timeframes before relying on it. Results are not guaranteed; past performance is not indicative of future results.

About the author
Written by Dominic Walsh, a Forex trader and MT4/MT5 indicator, Expert Advisor and script developer. Every tool on forexmt4systems.com is tested on live charts before release and ships with ready-to-use compiled MT4 (.ex4) and MT5 (.ex5) files. Learn more about the trader and developer behind this site.
How we build, test and correct every tool: Editorial & Testing Policy. Trading carries risk; see the disclaimer.