
Copula Tail Dependency is a tail risk indicator TradingView traders can use to ask one narrow question. When the volume change lands in its most extreme 10 percent, how often does the return land in the same extreme? The script answers that for both tails and plots the two ratios as curves. Also, a high upper curve marks bullish co-movement. A high lower curve marks bearish co-movement.
It is free and open source. Indeed, you can add it to any chart from the Copula Tail Dependency script page on TradingView, and the full Pine source is published there for you to read.
What Copula Tail Dependency plots in a separate pane below price
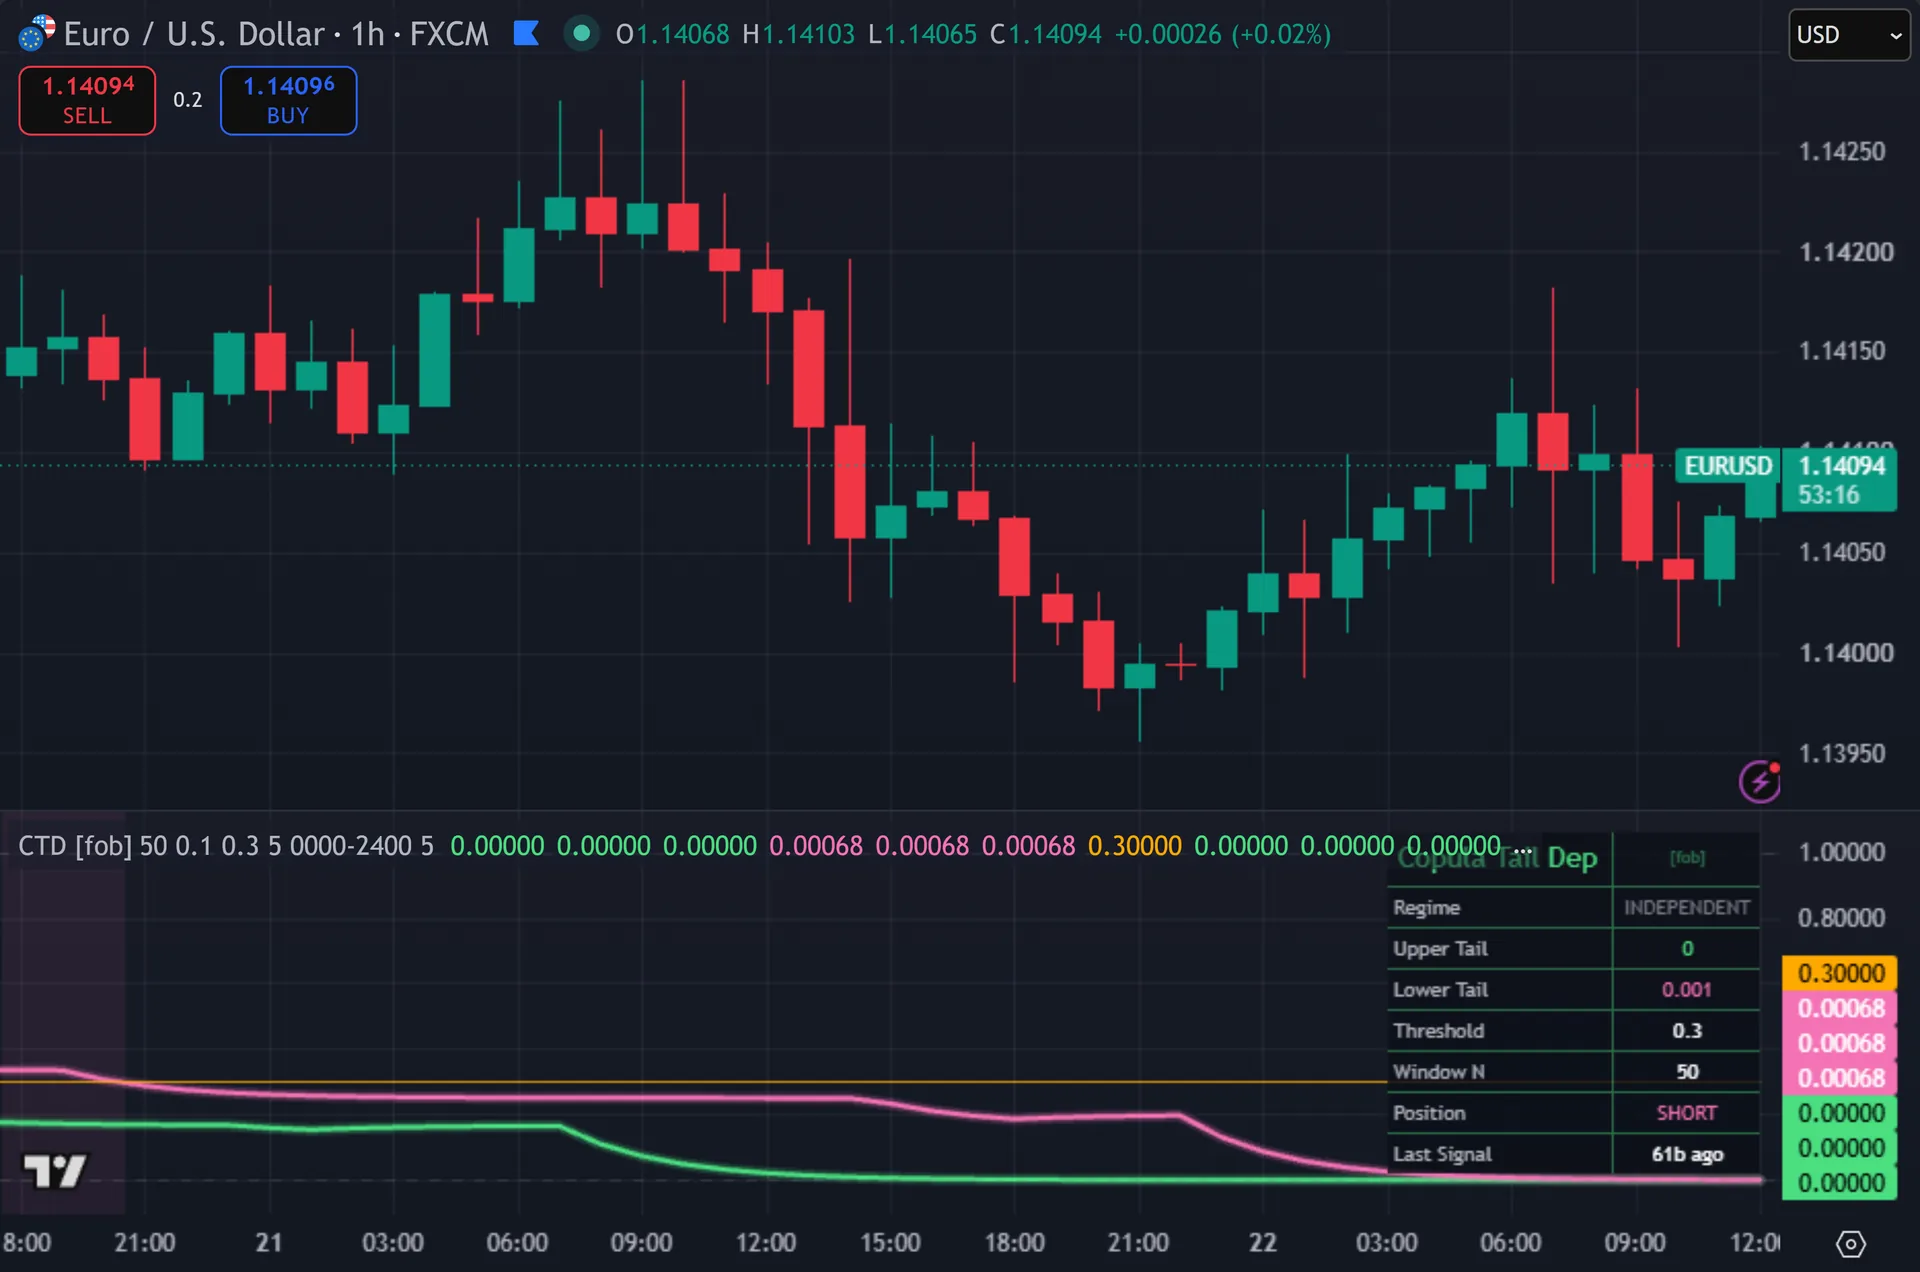
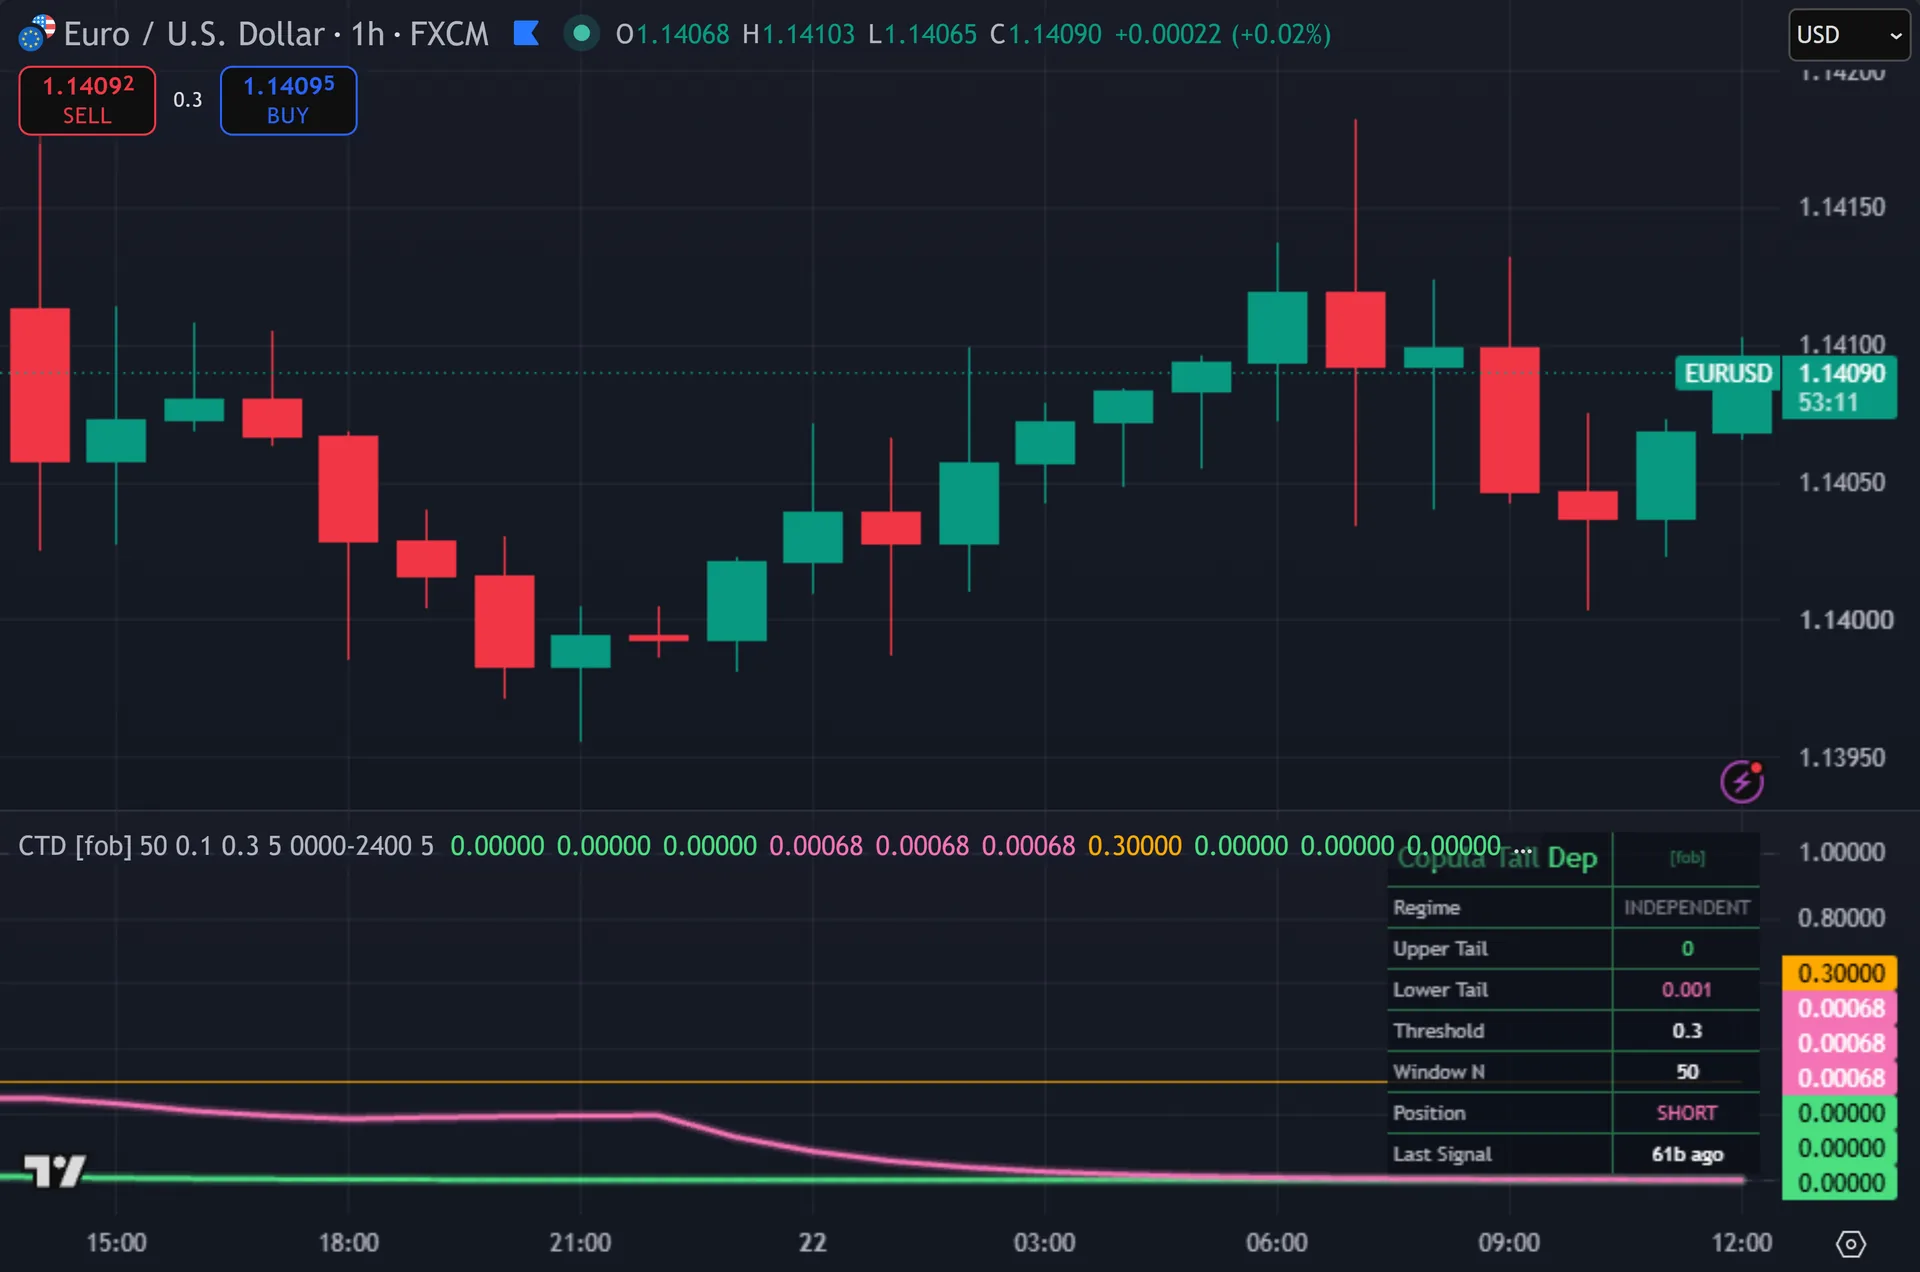
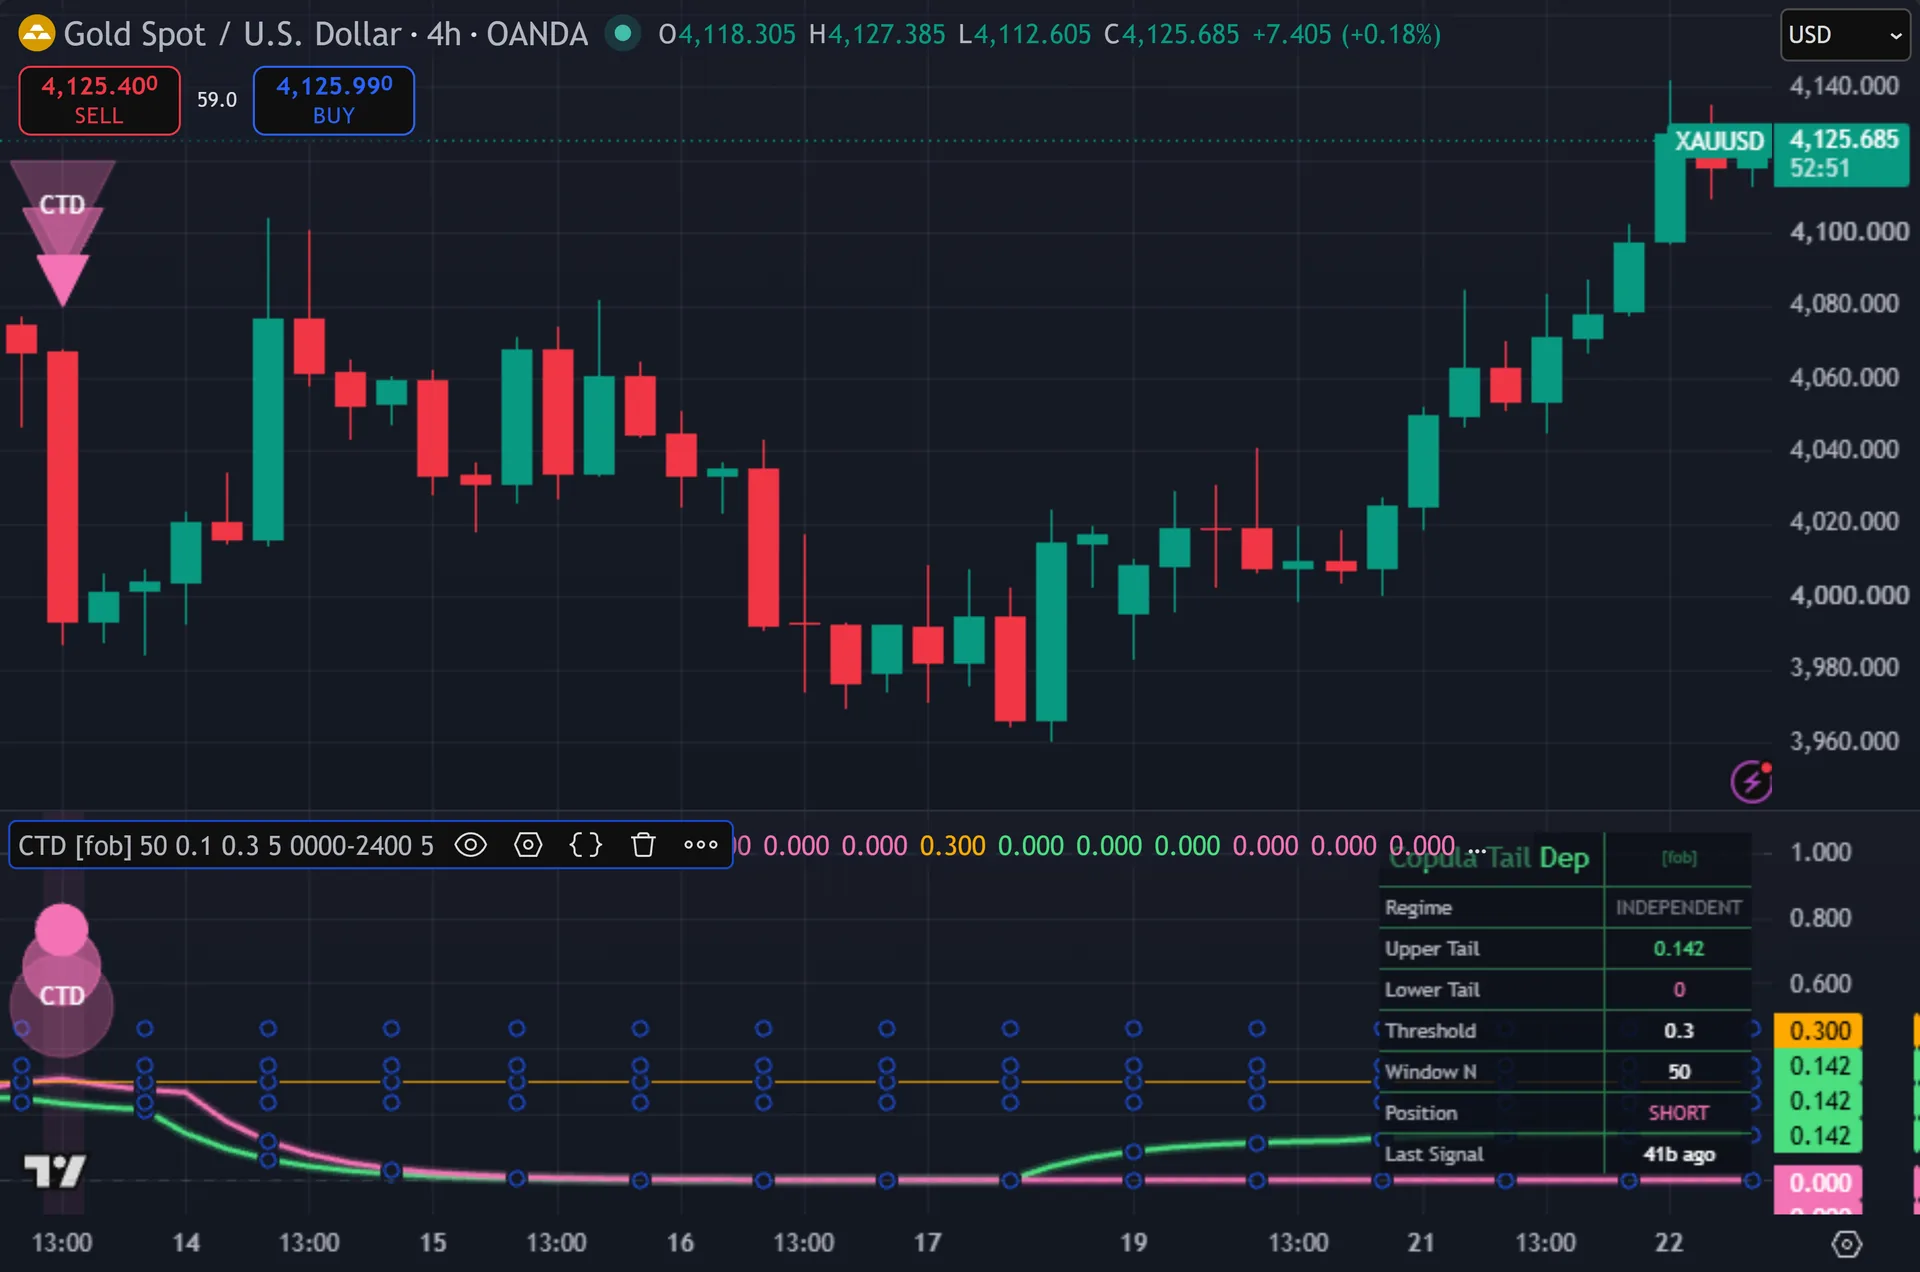
The script opens its own pane below price. Still, two glowing curves run there between 0 and 1: a green upper-tail curve and a pink lower-tail curve. An orange line marks your threshold, with grey guides at 0 and 1. Thus, circles print at the top and bottom of the pane on signals, and matching triangles mirror onto the price candles through force_overlay. The pane background tints toward whichever tail leads. Hence, an eight-row dashboard reports the regime, both tail values, the threshold, the window and the position state.
How Copula Tail Dependency is built
From returns to uniform ranks
Two raw series feed the calculation. Next, the first is the log return of the close. The second is the bar-on-bar change in volume. Neither enters the maths directly. The script ranks each one instead.
The rank function walks the last 50 bars and counts how many values sit at or below the current one. Then, it divides that count by 50. The result lands between 0 and 1 and shows where the current bar sits inside its own recent distribution. Yet, statisticians call this a uniform marginal, and it is the step that makes a copula-style reading possible. It also strips out scale, so a pair quoted in five decimals and an index quoted in points produce the same kind of number.
Two ranks come out of this: one for the return, one for the volume change. Truly, both series stay in memory, so on every bar the script can look back over the last 50 pairs of ranks.
Counting the tails
The tail fraction input starts at 0.1. Plainly, that splits each rank series at 0.1 and 0.9. The script then loops over the last 50 rank pairs. Also, it counts the bars where the volume rank sits in the lower tail, and among those, the bars where the return rank sits in the lower tail too. Dividing one count by the other gives the lower-tail figure. Indeed, the upper tail follows the same pattern above 0.9.
Those raw ratios come out coarse. Still, a 50-bar window with a 10 percent tail leaves only about five qualifying bars, so the ratio moves in fifth-steps. A 5-period EMA smooths both curves, which is why they draw as clean lines rather than a staircase.
A signal needs four things. Thus, the upper curve must cross above your 0.3 threshold for a long, or the lower curve for a short. The position state must not already sit that way. Hence, five bars must have passed since the last signal. And the bar must close, since the script checks barstate.isconfirmed.
How to read the signals
Read the gap between the curves, not the level of either one. Next, when the upper curve sits well above the lower one and both clear the threshold, extreme up-moves and volume surges are arriving together. When the two curves sit close, the tails behave independently, and the dashboard says INDEPENDENT.
Remember what the pair actually is. Then, this compares returns with volume changes on the same symbol. It does not compare two symbols, and it carries no directional view of its own. Yet, a high upper reading during a downtrend means large moves and volume spikes coincide – it does not name the next move.
Both curves lag by construction. Truly, the window holds 50 bars, and a 5-period EMA sits on top of that. So a shift in behaviour shows up several bars after it began. Plainly, use the reading as background context and let price structure handle your timing.
Every Copula Tail Dependency setting explained
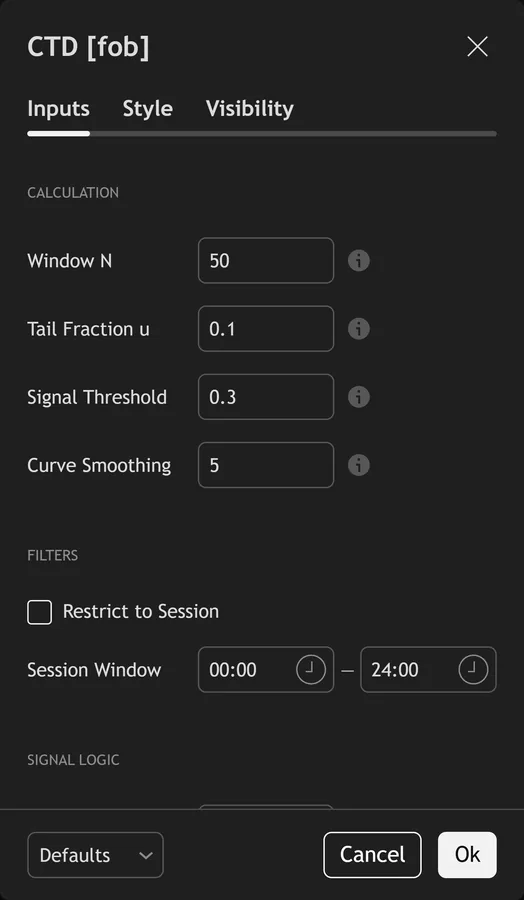
The script exposes 12 inputs, grouped in the settings panel exactly as shown below. Defaults are the published values.
Calculation
| Setting | What it does | Default | Range |
|---|---|---|---|
| Window N | Bars used to rank-transform the marginal distributions. | 50 | 20 to 200 |
| Tail Fraction u | Fraction defining the upper and lower tails (e.g. 0.1 = 10 percent). | 0.1 | 0.05 to 0.4 |
| Signal Threshold | Tail dependence above this is treated as co-movement. | 0.3 | 0.1 to 1.0 |
| Curve Smoothing | EMA smoothing on the tail-dependence curves. The raw empirical ratio is a coarse staircase (few tail observations); smoothing renders clean lines. | 5 | 1 to 20 |
Filters
| Setting | What it does | Default | Range |
|---|---|---|---|
| Restrict to Session | Toggles restrict to session on the chart. | off | on / off |
| Session Window | Controls session window. | 0000-2400 |
Signal Logic
| Setting | What it does | Default | Range |
|---|---|---|---|
| Cooldown Bars | Sets the cooldown bars used in the calculation. | 5 | 1 to 60 |
Visual
| Setting | What it does | Default | Range |
|---|---|---|---|
| Show Dashboard | Toggles show dashboard on the chart. | on | on / off |
| Show 3-Layer Glow | Toggles show 3-layer glow on the chart. | on | on / off |
| Buy / Upper Tail | Colour used for buy / upper tail. | #4ade80 | |
| Sell / Lower Tail | Colour used for sell / lower tail. | #f472b6 | |
| Dashboard BG | Colour used for dashboard bg. | color.new(#0c1018, 16) |
Alerts built into Copula Tail Dependency
The script ships 11 alert conditions. Also, open the alert dialog on the chart, pick the indicator as the condition source, then choose the event you want. Alerts fire on the close of the bar, so they follow the same confirmed-bar rule the on-chart signals use.
- CTD Buy
- CTD Sell
- CTD Any Signal
- CTD Upper Tail Up
- CTD Lower Tail Up
- CTD Upper Tail Dn
- CTD Lower Tail Dn
- CTD Symmetric Tails
- CTD Webhook JSON
Other markets and timeframes
The maths is scale-free. Indeed, ranks replace raw values, so nothing depends on pip size, tick value or price level, and the same defaults run on gold, indices and crypto. The volume leg is the catch. Still, spot forex volume comes from broker tick counts rather than an exchange, so the volume rank measures activity, not traded size. On a symbol with no volume feed the lower curve flattens near the tail fraction and signals dry up.
Limitations worth knowing
The name promises more than the code delivers. Thus, there is no copula family fitted here, no Gaussian or Clayton parameter and no likelihood estimation. The script rank-transforms two series and counts how often their extremes land together. Hence, that is a nonparametric tail co-occurrence proxy, and it is worth knowing before you read too much into the label.
The sample behind each number is tiny. Next, a 50-bar window with a 10 percent tail leaves roughly five qualifying bars, so one new observation can swing the raw ratio by 20 points. The EMA hides that jumpiness rather than removing it. Then, widening Window N to 200 helps, at the cost of more lag.
It offers no levels and no direction. Yet, there is no stop, no target, no trend filter and no price structure anywhere in the calculation. The curves describe dependence between two of your own series. Truly, they do not describe where price goes next.
Get Copula Tail Dependency on TradingView
Open Copula Tail Dependency on TradingView
If you also trade MetaTrader, the MT4 and MT5 indicator library is available below.
Get the complete indicator library
One email unlocks the full MT4 and MT5 indicator library. Plainly, this TradingView script stays free on TradingView – the button above adds it to your chart.
Using it alongside MetaTrader
Adding a script on TradingView takes one click, so there is no install step here. Also, if you want the same idea on MetaTrader, the MT4 and MT5 indicator installation guide walks through copying files into the data folder and attaching them to a chart. You can also browse the full MetaTrader indicator library, the MT4 indicators section, or the other free TradingView scripts published on this profile. For related chart tools see the MT5 indicators section and the forex trading strategies guides.
External references
- Stochastic oscillator on Wikipedia
- Stochastic Oscillator at Investopedia
- Raff Regression Channel at StockCharts ChartSchool
Frequently asked questions
Does Copula Tail Dependency repaint?
No. Indeed, both curves come from a fixed rolling window of closed bars, and every signal gates on barstate.isconfirmed. The circles in the pane and the mirrored triangles on price print after the bar closes and stay where they printed.
Does it fit a real copula?
No, and it is fairer to say so plainly. Still, the script performs the rank transform that copula theory starts from, then measures empirical tail co-occurrence directly. It never estimates a copula family or a dependence parameter.
Which two series does it compare?
Log returns of the close and bar-on-bar changes in volume, both on the same symbol. Thus, the upper curve tracks their joint upper extremes. The lower curve tracks their joint lower extremes.
Why does a curve sit at zero for long stretches?
The window needs 50 bars of history before counting starts, and a tail with no matching observation returns zero. Hence, lower the threshold or widen the tail fraction for more sensitivity, and note that a wider tail means a less extreme definition of extreme.
How much should I rely on this indicator?
Treat it as one input, not a decision. Next, it is a chart analysis tool, not trading advice. Test it on your own markets and timeframes before relying on it. Results are not guaranteed; past performance is not indicative of future results.

About the author
Written by Dominic Walsh, a Forex trader and MT4/MT5 indicator, Expert Advisor and script developer. Every tool on forexmt4systems.com is tested on live charts before release and ships with ready-to-use compiled MT4 (.ex4) and MT5 (.ex5) files. Learn more about the trader and developer behind this site.
How we build, test and correct every tool: Editorial & Testing Policy. Trading carries risk; see the disclaimer.