
Charts show price, not the cost of trading it. Also, corwin-Schultz Spread Bands works as a bid ask spread indicator TradingView traders can run on any symbol, and it needs no order book. It implements the Corwin and Schultz estimator published in the Journal of Finance in 2012, which recovers an effective spread from two adjacent bars of high and low data. Indeed, high readings mark stressed, expensive conditions. Falling readings mark conditions returning to normal.
It is free and open source. Still, you can add it to any chart from the Corwin-Schultz Spread Bands script page on TradingView, and the full Pine source is published there for you to read.
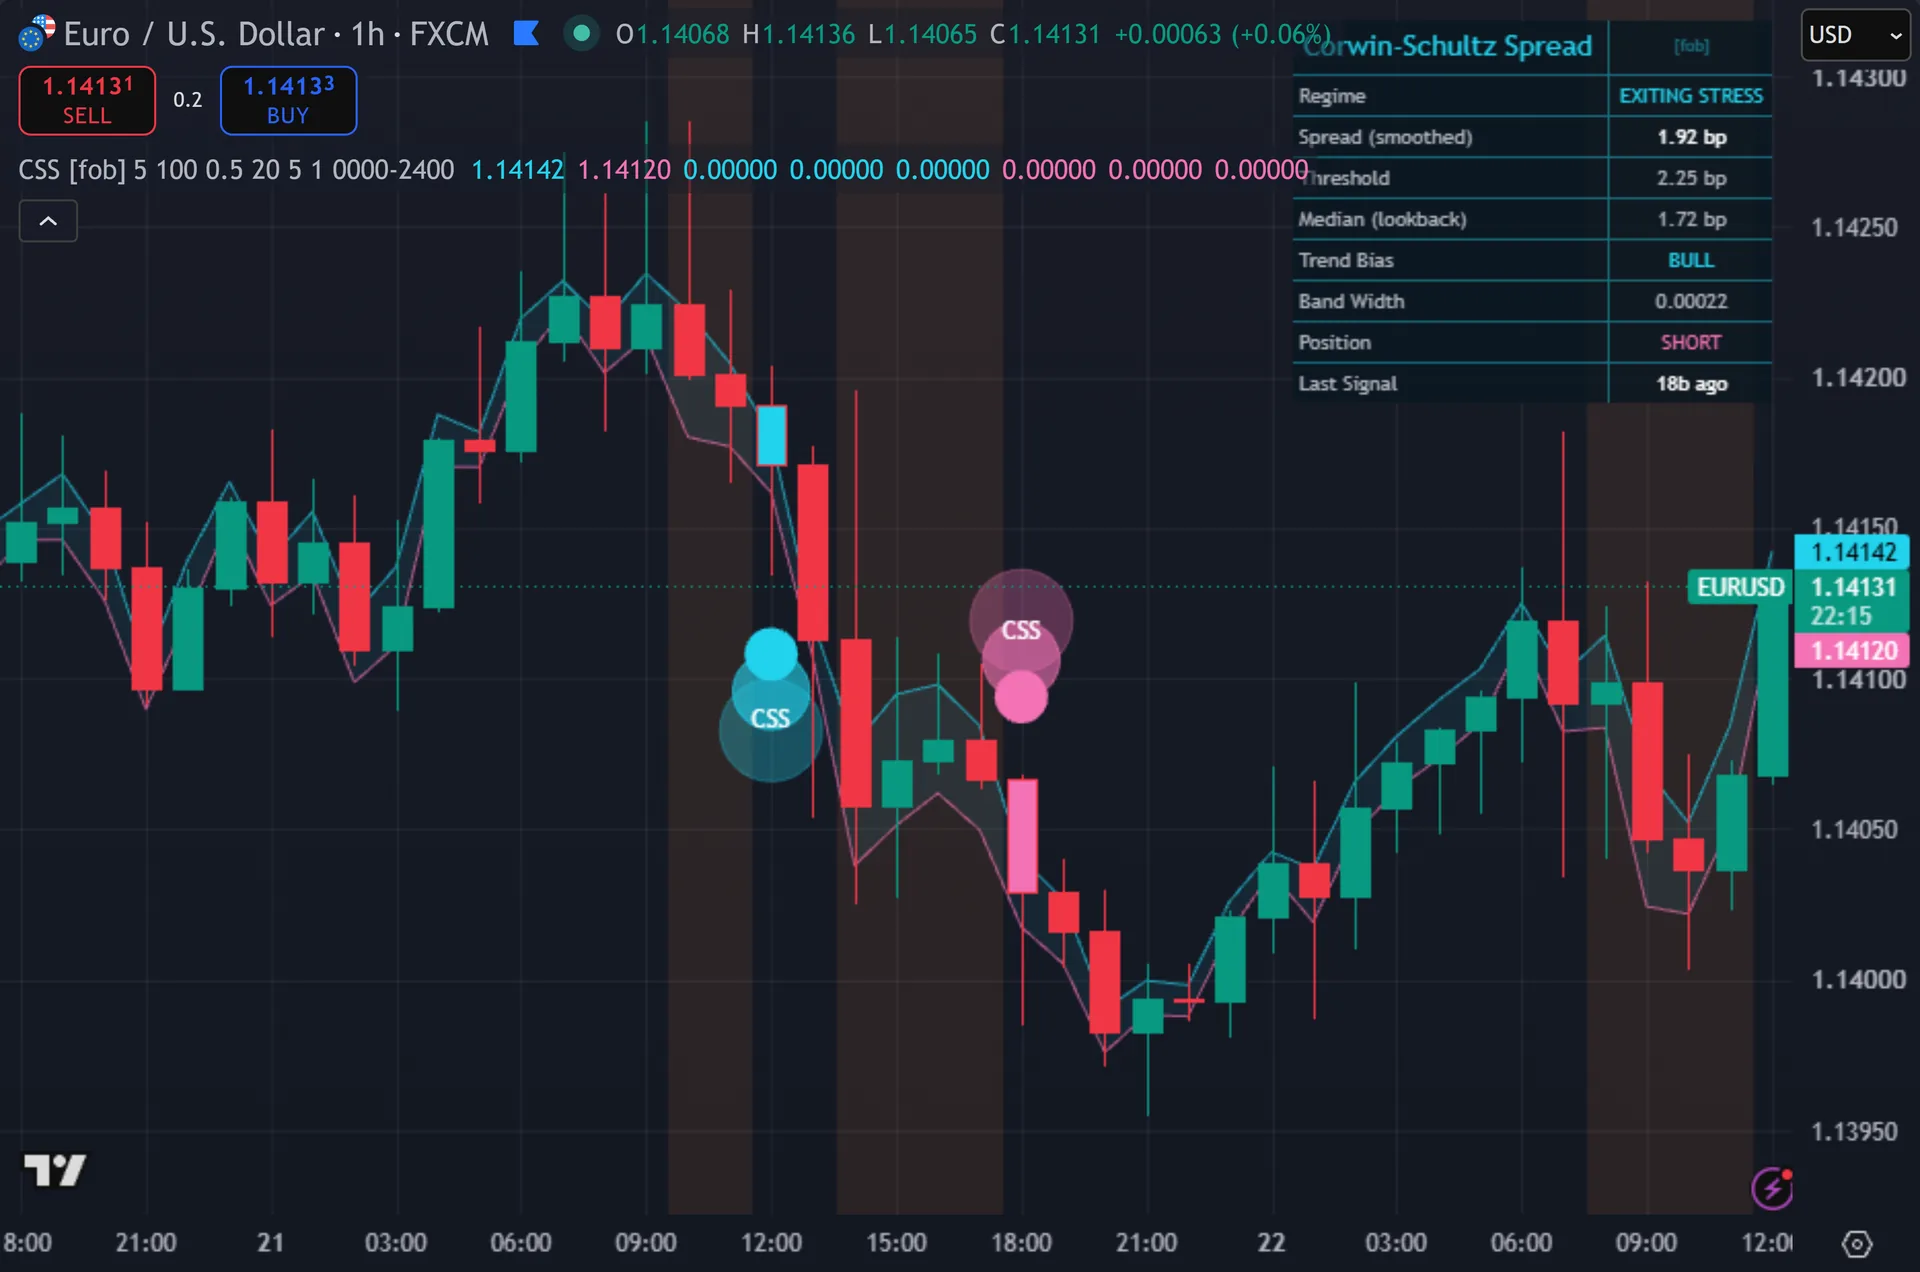
What Corwin-Schultz Spread Bands plots on the price chart
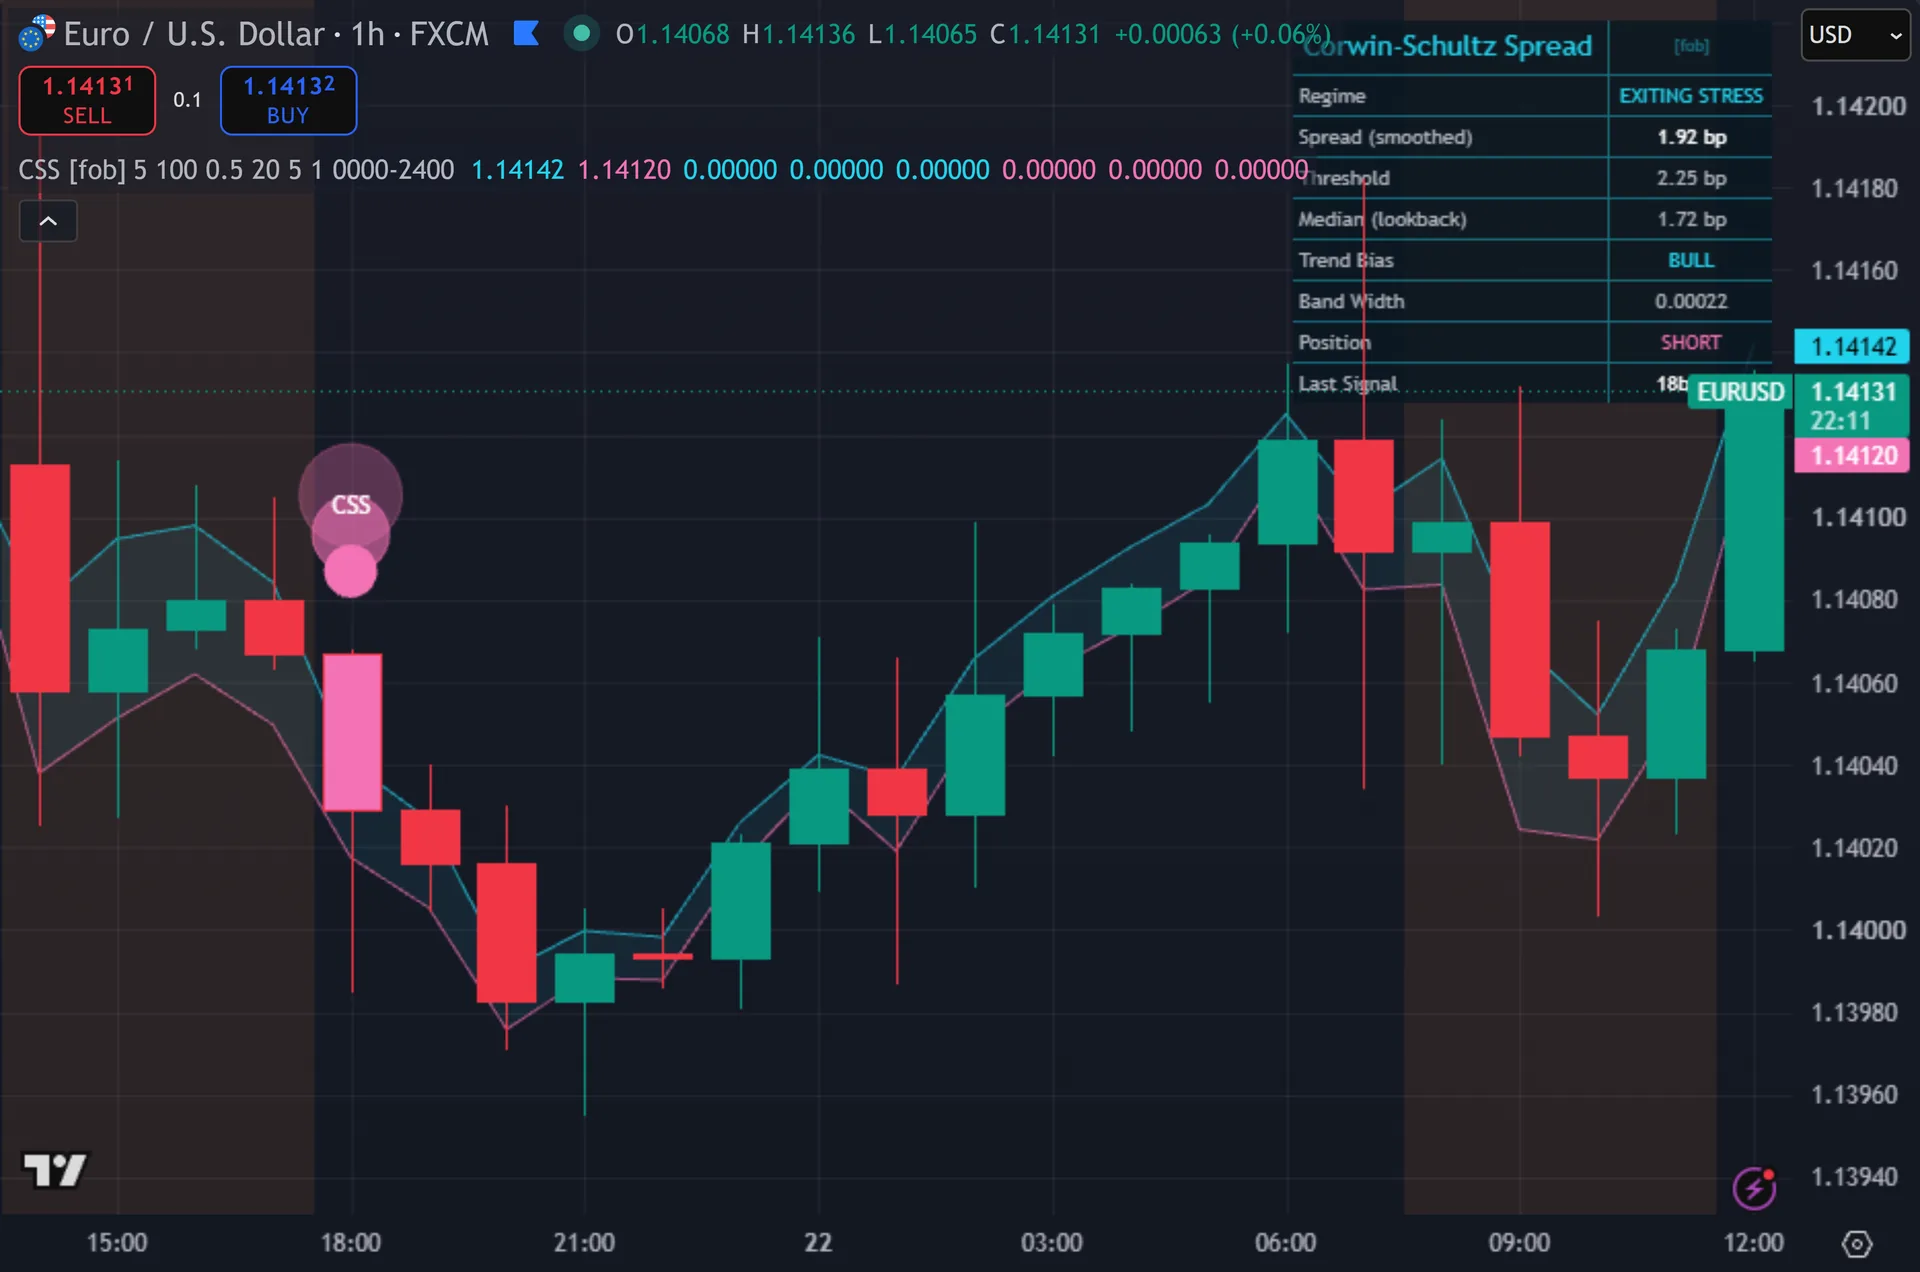
Two thin bands ride either side of price, with a shaded fill between them. Thus, the half-width equals close times the smoothed spread, divided by two, times your band multiplier. So the channel widens exactly as the estimate rises. Hence, an orange background marks every bar the script classes as stressed. Signals print circles marked CSS below or above the bar and tint that bar. Next, a nine-row dashboard reports the regime word, the smoothed spread in basis points, the threshold, the rolling median, trend bias, band width, position and bars since the last signal.
How Corwin-Schultz Spread Bands is built
The estimator itself
The maths comes straight from the paper. For each pair of adjacent bars the script computes beta as the squared log high-low range of this bar plus the squared log range of the previous bar. Gamma is the squared log range measured across both bars combined, using the higher high and the lower low.
Those two feed alpha. Then, take the square root of two beta and subtract the square root of beta. Divide that by the constant three minus two root two. Then subtract the square root of gamma over the same constant. That constant works out near 0.1716. Yet, the estimated proportional spread is two times the quantity e to the alpha minus one, over one plus e to the alpha.
Raw output can turn negative, which the paper treats as zero. Truly, the script clamps the result to the range 0 to 1, then smooths it with a 5-bar EMA. The dashboard multiplies by 10,000 and reports the number in basis points.
Stress regime and signals
The script defines stress against the symbol’s own history. Plainly, it takes the rolling 50th percentile of the smoothed spread over 100 bars, adds 0.5 standard deviations of that same series, and calls anything above the result stressed. Both the lookback and the multiplier are inputs you can change.
Signals fire on the exit, not on the entry. Also, the bar where stress switches off becomes the candidate bar. A 20-bar simple moving average then picks the side: close above it gives a long, close below gives a short. Indeed, the idea stays simple – act as conditions normalise, in the direction price already leans.
Three gates finish. Still, the position state must sit flat or opposite. Five bars must have passed since the last signal. Thus, and the bar must close, because the code checks the confirmed-bar flag. An optional session window can narrow the hours, and it defaults to 0000-2400.
How to read the signals
Compare the spread row to the threshold row. Both arrive in basis points. A smoothed spread of 12 bp against a threshold of 9 bp tells you conditions run wide for this symbol right now, whatever the absolute number looks like.
The orange background is a warning, not a signal. It marks the stressed stretch. The circle prints on the first bar after that stretch ends, so the tool hunts for calm returning rather than for chaos arriving.
Band width gives you a cost picture. Hence, wide bands mean estimated round-trip friction runs large relative to price, which matters most for scalping. Raise the band multiplier only for visibility. Next, it changes nothing in the signal logic.
Every Corwin-Schultz Spread Bands setting explained
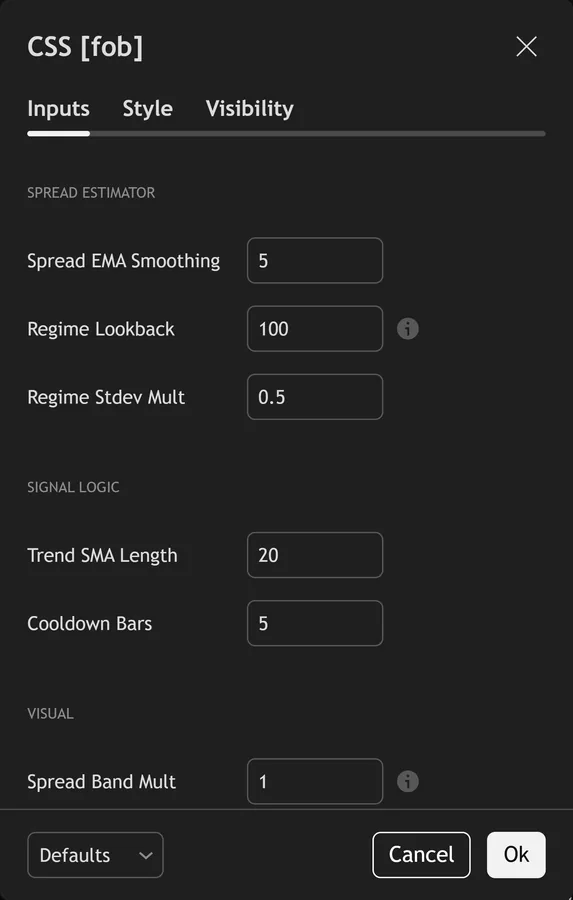
The script exposes 17 inputs, grouped in the settings panel exactly as shown below. Defaults are the published values.
Spread Estimator
| Setting | What it does | Default | Range |
|---|---|---|---|
| Spread EMA Smoothing | Sets the spread ema smoothing used in the calculation. | 5 | 1 to 50 |
| Regime Lookback | Bars used for rolling median and stdev that define stress. | 100 | 20 to 500 |
| Regime Stdev Mult | Sets the regime stdev mult used in the calculation. | 0.5 | 0.1 to 5.0 |
Signal Logic
| Setting | What it does | Default | Range |
|---|---|---|---|
| Trend SMA Length | Sets the trend sma length used in the calculation. | 20 | 2 to 200 |
| Cooldown Bars | Sets the cooldown bars used in the calculation. | 5 | 1 to 80 |
Visual
| Setting | What it does | Default | Range |
|---|---|---|---|
| Spread Band Mult | Visual scaling for the band width = close * spread/2 * mult. | 1.0 | 0.1 to 10.0 |
| Show Spread Bands | Toggles show spread bands on the chart. | on | on / off |
| Shade Band Fill | Toggles shade band fill on the chart. | on | on / off |
| Highlight Stress Regime | Toggles highlight stress regime on the chart. | on | on / off |
| Show Dashboard | Toggles show dashboard on the chart. | on | on / off |
| Show 3-Layer Glow | Toggles show 3-layer glow on the chart. | on | on / off |
| Buy Color | Colour used for buy color. | #22d3ee | |
| Sell Color | Colour used for sell color. | #f472b6 | |
| Stress Regime Color | Colour used for stress regime color. | #fb923c | |
| Dashboard BG | Colour used for dashboard bg. | color.new(#0a1620, 18) |
Filters
| Setting | What it does | Default | Range |
|---|---|---|---|
| Restrict to Session | Toggles restrict to session on the chart. | off | on / off |
| Session Window | Controls session window. | 0000-2400 |
Alerts built into Corwin-Schultz Spread Bands
The script ships 13 alert conditions. Then, open the alert dialog on the chart, pick the indicator as the condition source, then choose the event you want. Alerts fire on the close of the bar, so they follow the same confirmed-bar rule the on-chart signals use.
- CSS Buy
- CSS Sell
- CSS Any Signal
- CSS Enter Stress
- CSS Exit Stress
- CSS Spread Rising
- CSS Spread Falling
- CSS Trend Up
- CSS Trend Down
- CSS Extreme Spread
- CSS Webhook JSON
Other markets and timeframes
This one is genuinely market-agnostic in structure. Yet, the estimator uses log ratios of high to low, so it returns a proportional spread rather than a pip figure. The stress test then compares that spread to its own 100-bar median. Nothing absolute enters anywhere. It also ignores volume completely, which makes it usable on any feed. Truly, do note that the paper studied daily equity bars. On intraday forex charts the output stays a proxy for friction, not a measured dealing spread.

Limitations worth knowing
The output is an estimate, never your broker’s quoted spread. Plainly, the script reads no bid and no ask. It infers cost from bar ranges, so a strong trending bar with a small range can understate what you actually pay.
The published method includes an adjustment for overnight gaps, where the previous close sits outside the current bar’s range. This build skips that step. On daily charts with weekend gaps the estimate can therefore run high.
It is not a trade system. Also, there is no stop, no target and no sizing. A regime exit says friction faded, which is a condition rather than a reason to trade. On markets that gap constantly the estimator turns noisy, and the 5-bar EMA only partly hides that.
Get Corwin-Schultz Spread Bands on TradingView
Open Corwin-Schultz Spread Bands on TradingView
If you also trade MetaTrader, the MT4 and MT5 indicator library is available below.
Get the complete indicator library
One email unlocks the full MT4 and MT5 indicator library. Indeed, this TradingView script stays free on TradingView – the button above adds it to your chart.
Using it alongside MetaTrader
Adding a script on TradingView takes one click, so there is no install step here. Still, if you want the same idea on MetaTrader, the MT4 and MT5 indicator installation guide walks through copying files into the data folder and attaching them to a chart. You can also browse the full MetaTrader indicator library, the MT4 indicators section, or the other free TradingView scripts published on this profile. For related chart tools see the MT5 indicators section and the forex trading strategies guides.
External references
- Stochastic oscillator on Wikipedia
- Stochastic Oscillator at Investopedia
- Raff Regression Channel at StockCharts ChartSchool
Frequently asked questions
Does the Corwin-Schultz Spread Bands script repaint?
The signals do not. Thus, each one checks barstate.isconfirmed, so a circle prints only after the bar closes. The bands and the orange stress background do update while the current bar forms, since both read live high, low and close.
Is this the real Corwin-Schultz formula?
Yes. Hence, beta, gamma and alpha follow the 2012 Journal of Finance paper, including the three minus two root two constant near 0.1716 and the conversion of alpha into a proportional spread. This build adds a 5-bar EMA and clamps the result to the 0 to 1 range.
What does a reading in basis points mean?
One basis point is 0.01 percent of price. Next, a smoothed reading of 2 bp on a 1.1000 quote implies an estimated effective spread near 0.00022, or roughly 2.2 pips. Treat it as a relative measure over time, not as a live quote.
Does it need volume data?
No. Then, the estimator uses only high and low prices, so it runs on any symbol, including spot forex feeds where volume is just broker tick counts. That makes it one of the few liquidity tools that behaves the same on every feed.
How much should I rely on this indicator?
Treat it as one input, not a decision. Yet, it is a chart analysis tool, not trading advice. Test it on your own markets and timeframes before relying on it. Results are not guaranteed; past performance is not indicative of future results.

About the author
Written by Dominic Walsh, a Forex trader and MT4/MT5 indicator, Expert Advisor and script developer. Every tool on forexmt4systems.com is tested on live charts before release and ships with ready-to-use compiled MT4 (.ex4) and MT5 (.ex5) files. Learn more about the trader and developer behind this site.
How we build, test and correct every tool: Editorial & Testing Policy. Trading carries risk; see the disclaimer.