
Divergence Nexus is an divergence scanner indicator TradingView traders can run without stacking four panes on one chart. Also, it scans RSI, the MACD histogram, Stochastic %K and CCI against the same price pivots. Then it counts how many of the four agree. Indeed, a small label reads 2/4 or 4/4. A line joins the two pivots that formed the signal. Still, a corner dashboard tracks the latest reading per oscillator.
It is free and open source. Thus, you can add it to any chart from the Divergence Nexus script page on TradingView, and the full Pine source is published there for you to read.
What Divergence Nexus plots on the price chart
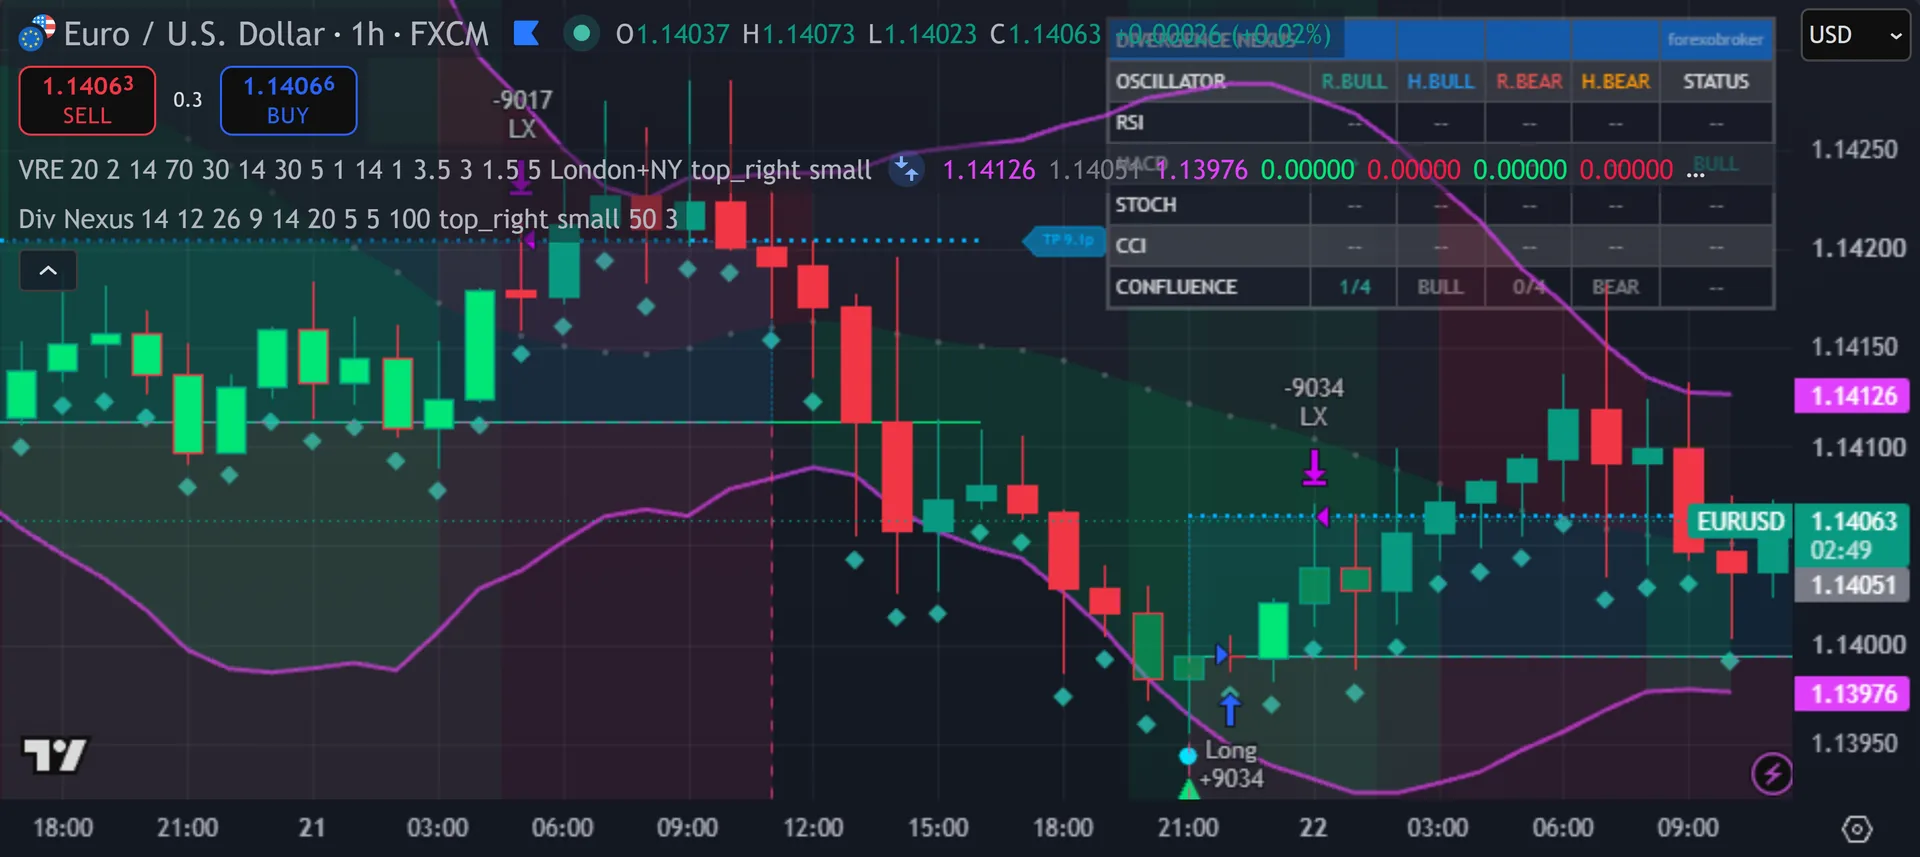
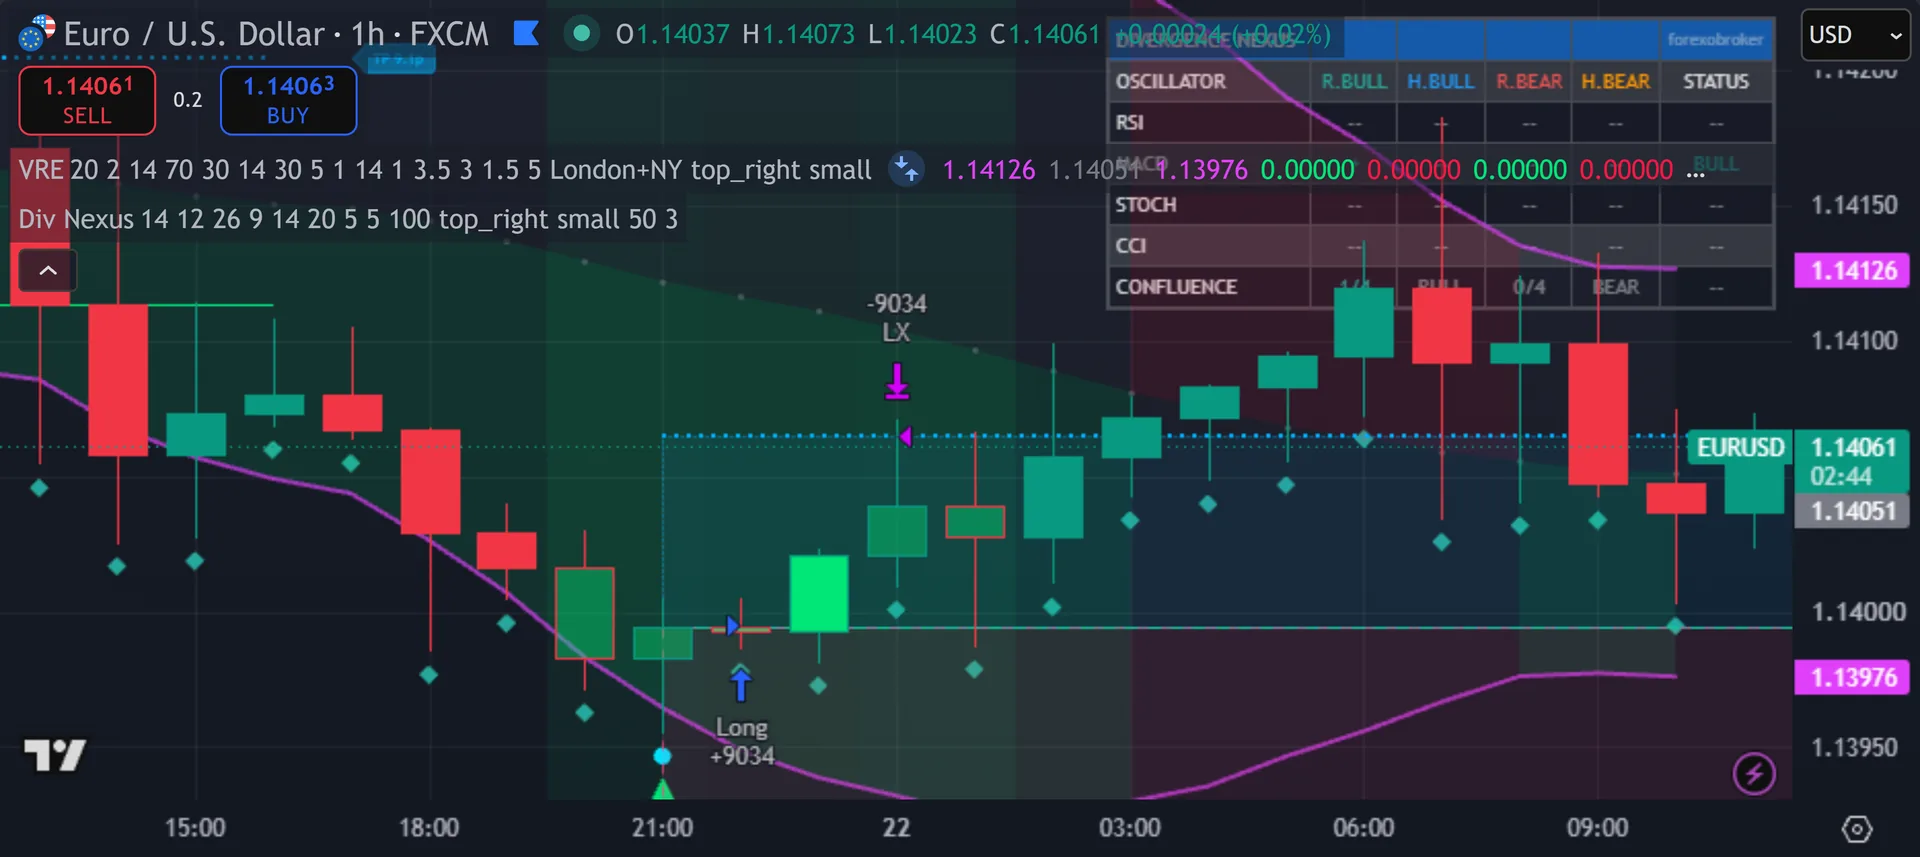
The script draws a line between the two pivots behind each divergence. Solid lines mark regular divergences. Dashed lines mark hidden ones. Hence, four colours separate the types: teal, red, blue and orange. A tiny label sits at the newer pivot and reads like R Bull 3/4, giving type, direction and confluence count. Next, diamonds print below or above the signal bar. The background tints faintly once confluence reaches your alert threshold. Then, a six-column dashboard lists RSI, MACD, STOCH and CCI with a status cell per row.
How Divergence Nexus is built
Step one: find pivots, then pair them
Everything starts with pivots. Yet, the script calls the standard pivot high and pivot low routine with a lookback of 5 bars on each side. It runs that routine twice per oscillator: once on price, once on the oscillator itself. Truly, a pivot only enters the record when both confirm on the same bar. So a price high needs the RSI to peak on that exact bar too.
That rule keeps the pairing clean, and it also explains most missed signals. Plainly, if the RSI turns one bar before the price high, nothing gets stored. Each oscillator keeps its own list of the last 10 highs and the last 10 lows. Also, older entries drop off the front.
The detector then compares only the two newest entries in a list. Indeed, it measures the gap between them in bars. That gap must sit between 5 and 100, set by Min Bars Between Pivots and Max Bars Between Pivots. Anything tighter counts as noise. Anything wider counts as unrelated.
Step two: four oscillators, one score
The four engines run with familiar defaults. RSI uses 14. The MACD histogram uses 12, 26 and 9. Stochastic %K uses 14. CCI uses 20 on the HLC3 average. Still, each one feeds the same comparison, so the code stays identical across the four.
The rules follow the textbook. On highs, a higher price high with a lower oscillator high gives a regular bearish divergence. A lower price high with a higher oscillator high gives a hidden bearish one. On lows the logic mirrors that. Two toggles let you switch regular or hidden detection off.
Each oscillator that fires on the same bar adds one point. Thus, that total becomes the confluence score out of four. It drives the label text, the alert gate and the background tint. Hence, min Confluence for Alert starts at 3. One quirk deserves a note: the label anchors to the pivot of whichever oscillator reported last on that bar, while the count covers all four.
How to read the signals
Read the score before the shape. Next, a 4/4 bullish label says RSI, MACD, Stochastic and CCI all pivoted with price and all disagreed with it in the same direction. A 1/4 label says one oscillator did. Then, both draw the same style of line, so the number carries the weight.
Line style tells you the intent. Yet, solid means regular, which points at a possible turn. Dashed means hidden, which points at continuation in the existing direction. Truly, a dashed teal line during a pullback in an uptrend argues the opposite case to a solid red line at a fresh high.
Mind the timing. Plainly, the pivot routine needs 5 bars to the right before it confirms anything. So a divergence line appears at least 5 bars after the pivot printed, and the diamond marks the bar that confirmed it, not the bar that turned. Also, plan entries around that delay rather than against it.
Every Divergence Nexus setting explained
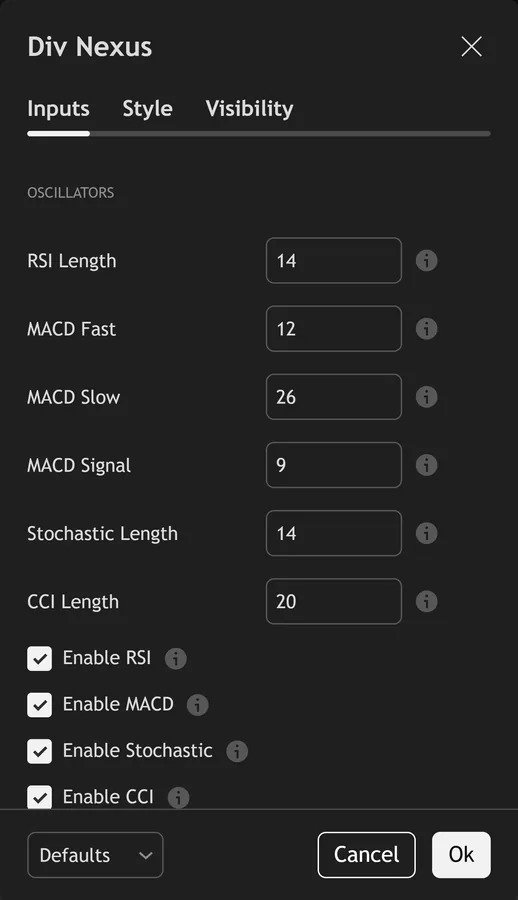
The script exposes 27 inputs, grouped in the settings panel exactly as shown below. Defaults are the published values.
Oscillators
| Setting | What it does | Default | Range |
|---|---|---|---|
| RSI Length | RSI lookback period | 14 | 2 to 50 |
| MACD Fast | MACD fast EMA length | 12 | 2 to 50 |
| MACD Slow | MACD slow EMA length | 26 | 5 to 100 |
| MACD Signal | MACD signal line length | 9 | 2 to 50 |
| Stochastic Length | Stochastic %K lookback period | 14 | 2 to 50 |
| CCI Length | Commodity Channel Index lookback period | 20 | 2 to 100 |
| Enable RSI | Include RSI in divergence scan | on | on / off |
| Enable MACD | Include MACD histogram in divergence scan | on | on / off |
| Enable Stochastic | Include Stochastic %K in divergence scan | on | on / off |
| Enable CCI | Include CCI in divergence scan | on | on / off |
Detection
| Setting | What it does | Default | Range |
|---|---|---|---|
| Pivot Lookback | Bars left/right for pivot detection. Higher = fewer but stronger pivots | 5 | 2 to 20 |
| Min Bars Between Pivots | Minimum distance between two pivots to form a valid divergence | 5 | 2 to 30 |
| Max Bars Between Pivots | Maximum distance between pivots. Beyond this a divergence is ignored | 100 | 20 to 300 |
| Detect Regular Divergences | Regular divergences signal potential trend reversals | on | on / off |
| Detect Hidden Divergences | Hidden divergences signal trend continuation | on | on / off |
Display
| Setting | What it does | Default | Range |
|---|---|---|---|
| Show Divergence Lines | Draw divergence lines on the price chart | on | on / off |
| Show Divergence Labels | Show labels with divergence type and confluence score | on | on / off |
| Show Dashboard | Display the divergence status dashboard | on | on / off |
| Highlight High Confluence | Tint background when high-confluence divergence detected | on | on / off |
| Table Position | Dashboard position on chart | top_right | top_left, top_center, top_right, bottom_left, bottom_center, bottom_right |
| Text Size | Dashboard text size | small | tiny, small, normal |
| Max Drawings | Maximum divergence lines and labels kept on chart | 50 | 10 to 100 |
Colors
| Setting | What it does | Default | Range |
|---|---|---|---|
| Regular Bullish | Color for regular bullish divergences (reversal up) | #26A69A | |
| Regular Bearish | Color for regular bearish divergences (reversal down) | #EF5350 | |
| Hidden Bullish | Color for hidden bullish divergences (continuation up) | #2196F3 | |
| Hidden Bearish | Color for hidden bearish divergences (continuation down) | #FF9800 |
Alerts
| Setting | What it does | Default | Range |
|---|---|---|---|
| Min Confluence for Alert | Minimum oscillator agreement (out of 4) to trigger high-confluence alert | 3 | 1 to 4 |
Alerts built into Divergence Nexus
The script ships 6 alert conditions. Indeed, open the alert dialog on the chart, pick the indicator as the condition source, then choose the event you want. Alerts fire on the close of the bar, so they follow the same confirmed-bar rule the on-chart signals use.
- Bullish Divergence
- Bearish Divergence
- High-Confluence Bullish
- High-Confluence Bearish
- Any Divergence
- Any High-Confluence
Other markets and timeframes
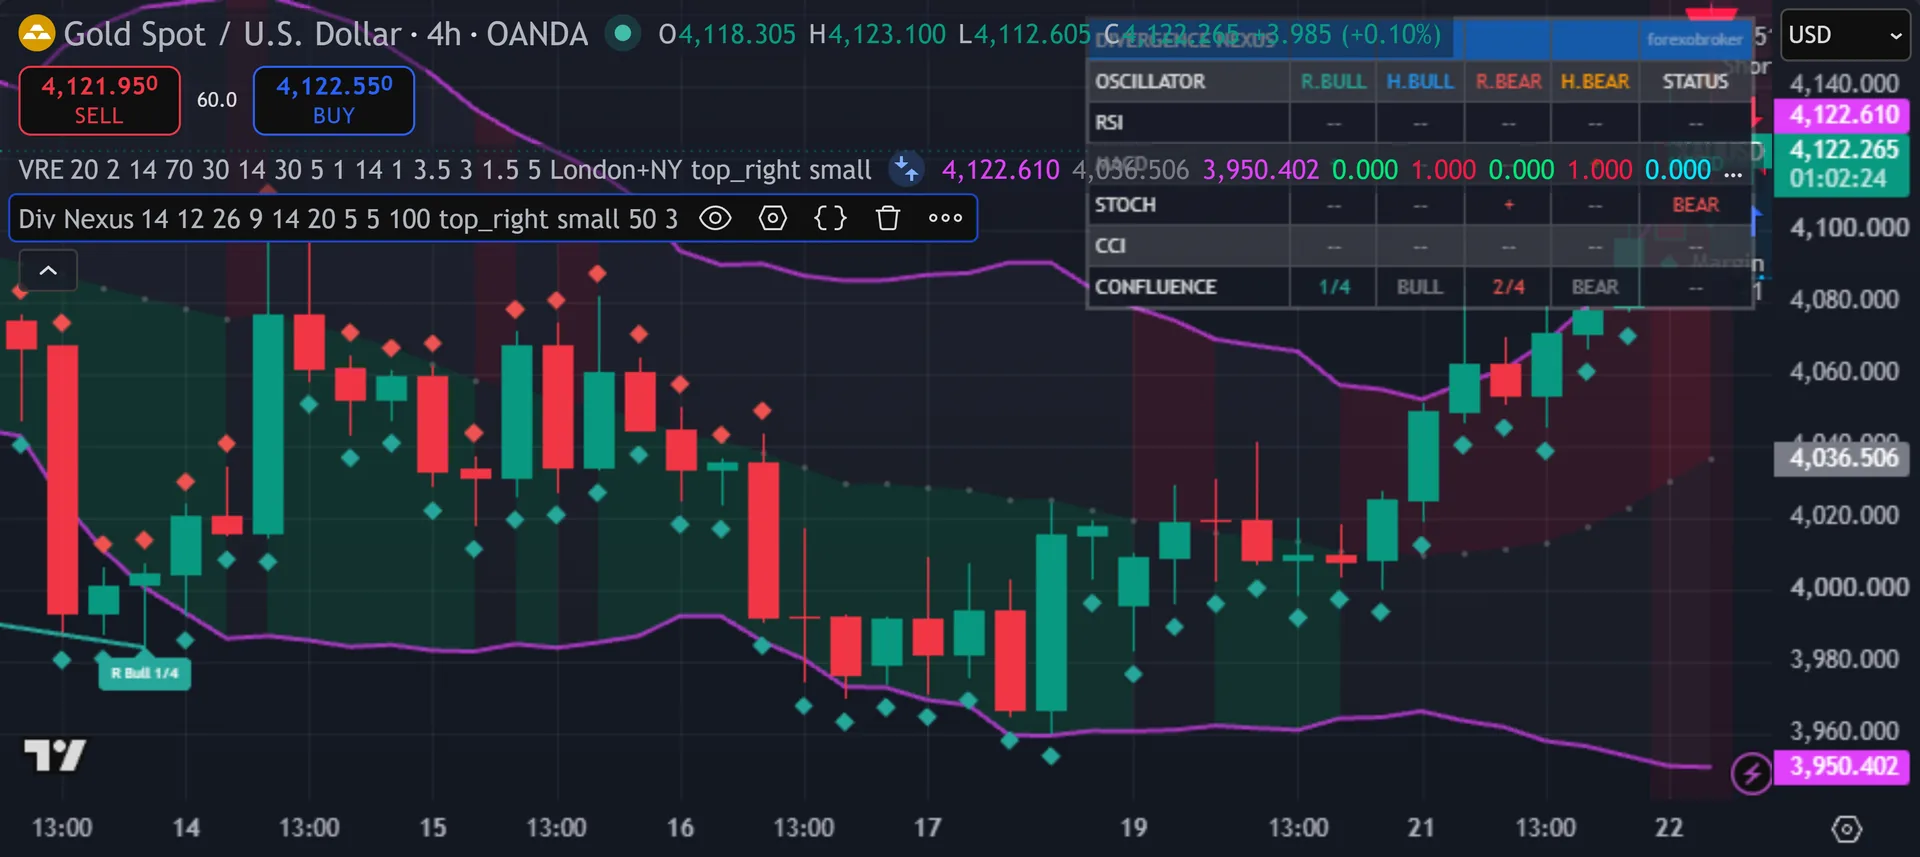
The maths carries no currency assumption. Still, RSI and Stochastic stay bounded between 0 and 100. The MACD histogram and CCI scale with the instrument, yet the test only compares one pivot to another on the same series, so absolute size never matters. Thus, no volume enters the calculation, which removes the usual spot forex problem. Gold, indices, crypto and equities all run on the shipped defaults. Hence, pivot Lookback is the one input worth adjusting, since fast intraday charts throw more pivots than a daily chart.
Limitations worth knowing
This flags disagreement between price and momentum. Next, it does not rank trend, structure or location. A 4/4 bearish label inside a strong uptrend still just means four oscillators lagged the price high. Then, the script carries no stop logic, no target logic and no position sizing.
The same-bar pivot rule costs you signals. Yet, price and the oscillator must pivot on the identical bar, and each pivot needs 5 clean bars on both sides. Divergences that a human eye picks out often fail one of those tests. Truly, the detector also compares only the two most recent pivots, so a three-push divergence gets read as two separate pairs.
There is no higher timeframe view. Plainly, the script calls no external timeframe data, so every reading belongs to the chart you have open. Confluence also measures agreement, not conviction: four weak oscillator turns score the same 4/4 as four decisive ones.
Get Divergence Nexus on TradingView
Open Divergence Nexus on TradingView
If you also trade MetaTrader, the MT4 and MT5 indicator library is available below.
Get the complete indicator library
One email unlocks the full MT4 and MT5 indicator library. Also, this TradingView script stays free on TradingView – the button above adds it to your chart.
Using it alongside MetaTrader
Adding a script on TradingView takes one click, so there is no install step here. Indeed, if you want the same idea on MetaTrader, the MT4 and MT5 indicator installation guide walks through copying files into the data folder and attaching them to a chart. You can also browse the full MetaTrader indicator library, the MT4 indicators section, or the other free TradingView scripts published on this profile. For related chart tools see the MT5 indicators section and the forex trading strategies guides.
External references
- Momentum (finance) on Wikipedia
- Momentum at Investopedia
- Decisionpoint Intermediate Term Volume Momentum Oscillator Itvm at StockCharts ChartSchool
Frequently asked questions
Does Divergence Nexus repaint?
The signal flags sit inside a barstate.isconfirmed block, so the diamond, the label and the alert land on a closed bar and stay there. Still, the lines reach back in time by design, because a pivot needs 5 bars on its right side to confirm. Call that lag rather than repainting.
What does the number in the label mean?
It counts how many of the four oscillators reported a divergence on that same bar, out of four. Thus, RSI, MACD histogram, Stochastic %K and CCI each contribute one point. The alert threshold uses the same count and starts at 3.
What is the difference between regular and hidden?
Regular divergence pairs a new price extreme with a weaker oscillator extreme, which argues for a turn. Hence, hidden divergence pairs a shallower price extreme with a stronger oscillator extreme, which argues for continuation. Solid lines show regular. Dashed lines show hidden.
Why did an obvious divergence produce nothing?
Check the pivot rules first. Next, the price pivot and the oscillator pivot must confirm on the same bar. Both need 5 bars either side. Then, the two pivots must sit 5 to 100 bars apart. And only the newest two pivots in each list get compared.
How much should I rely on this indicator?
Treat it as one input, not a decision. Yet, it is a chart analysis tool, not trading advice. Test it on your own markets and timeframes before relying on it. Results are not guaranteed; past performance is not indicative of future results.

About the author
Written by Dominic Walsh, a Forex trader and MT4/MT5 indicator, Expert Advisor and script developer. Every tool on forexmt4systems.com is tested on live charts before release and ships with ready-to-use compiled MT4 (.ex4) and MT5 (.ex5) files. Learn more about the trader and developer behind this site.
How we build, test and correct every tool: Editorial & Testing Policy. Trading carries risk; see the disclaimer.