
A classic Donchian channel takes the highest high and the lowest low. Also, one outlier wick then sets a rail for the whole lookback. This build swaps those extremes for percentiles, so the donchian channel indicator TradingView traders already know gets a robust upgrade. Indeed, the upper rail reads the 90th percentile of highs. The lower reads the 10th percentile of lows. Still, a 50th-percentile spine runs between them.
It is free and open source. Thus, you can add it to any chart from the Donchian Quantile Channel script page on TradingView, and the full Pine source is published there for you to read.
What Donchian Quantile Channel plots on the price chart
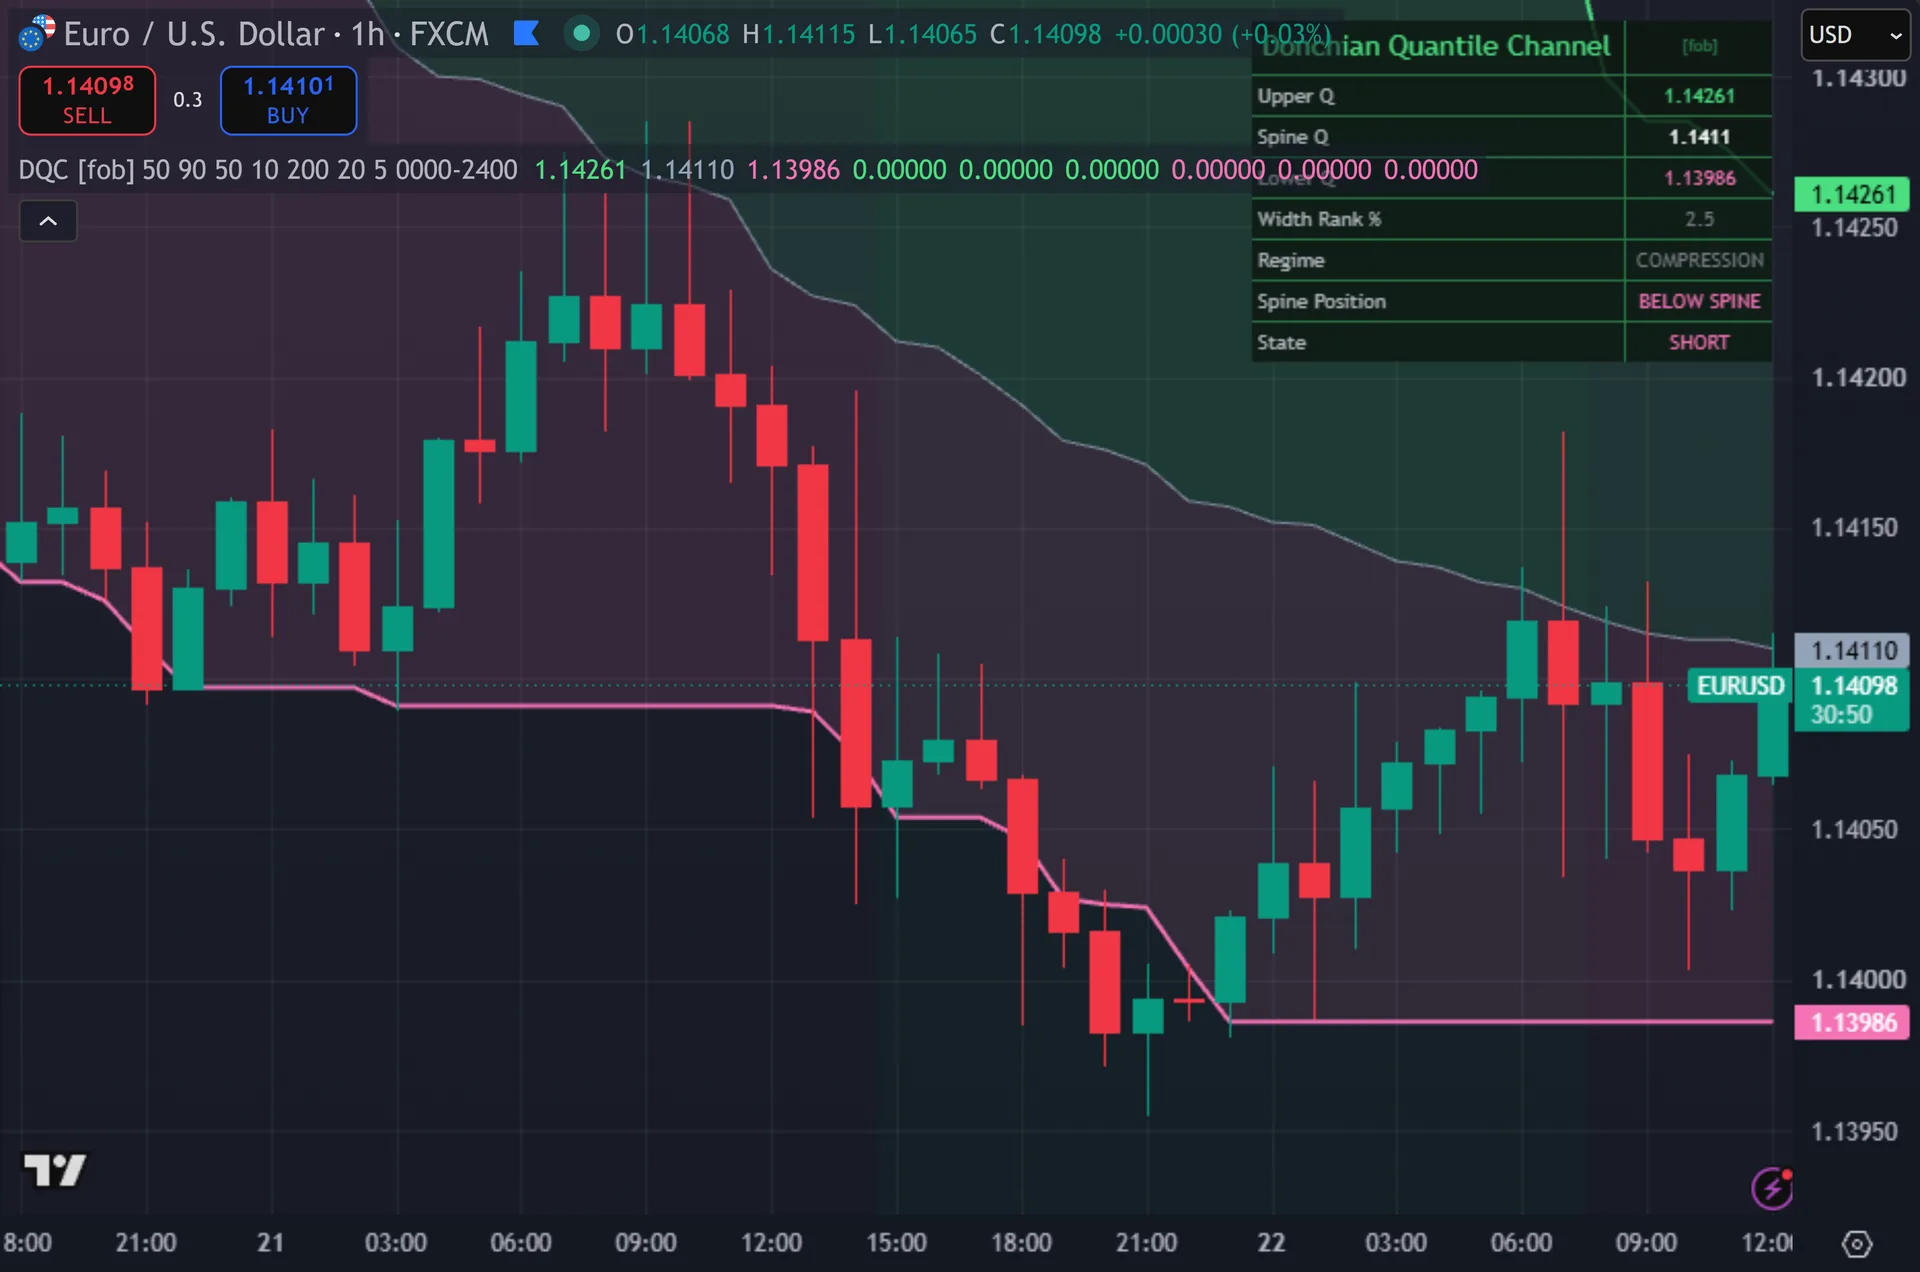
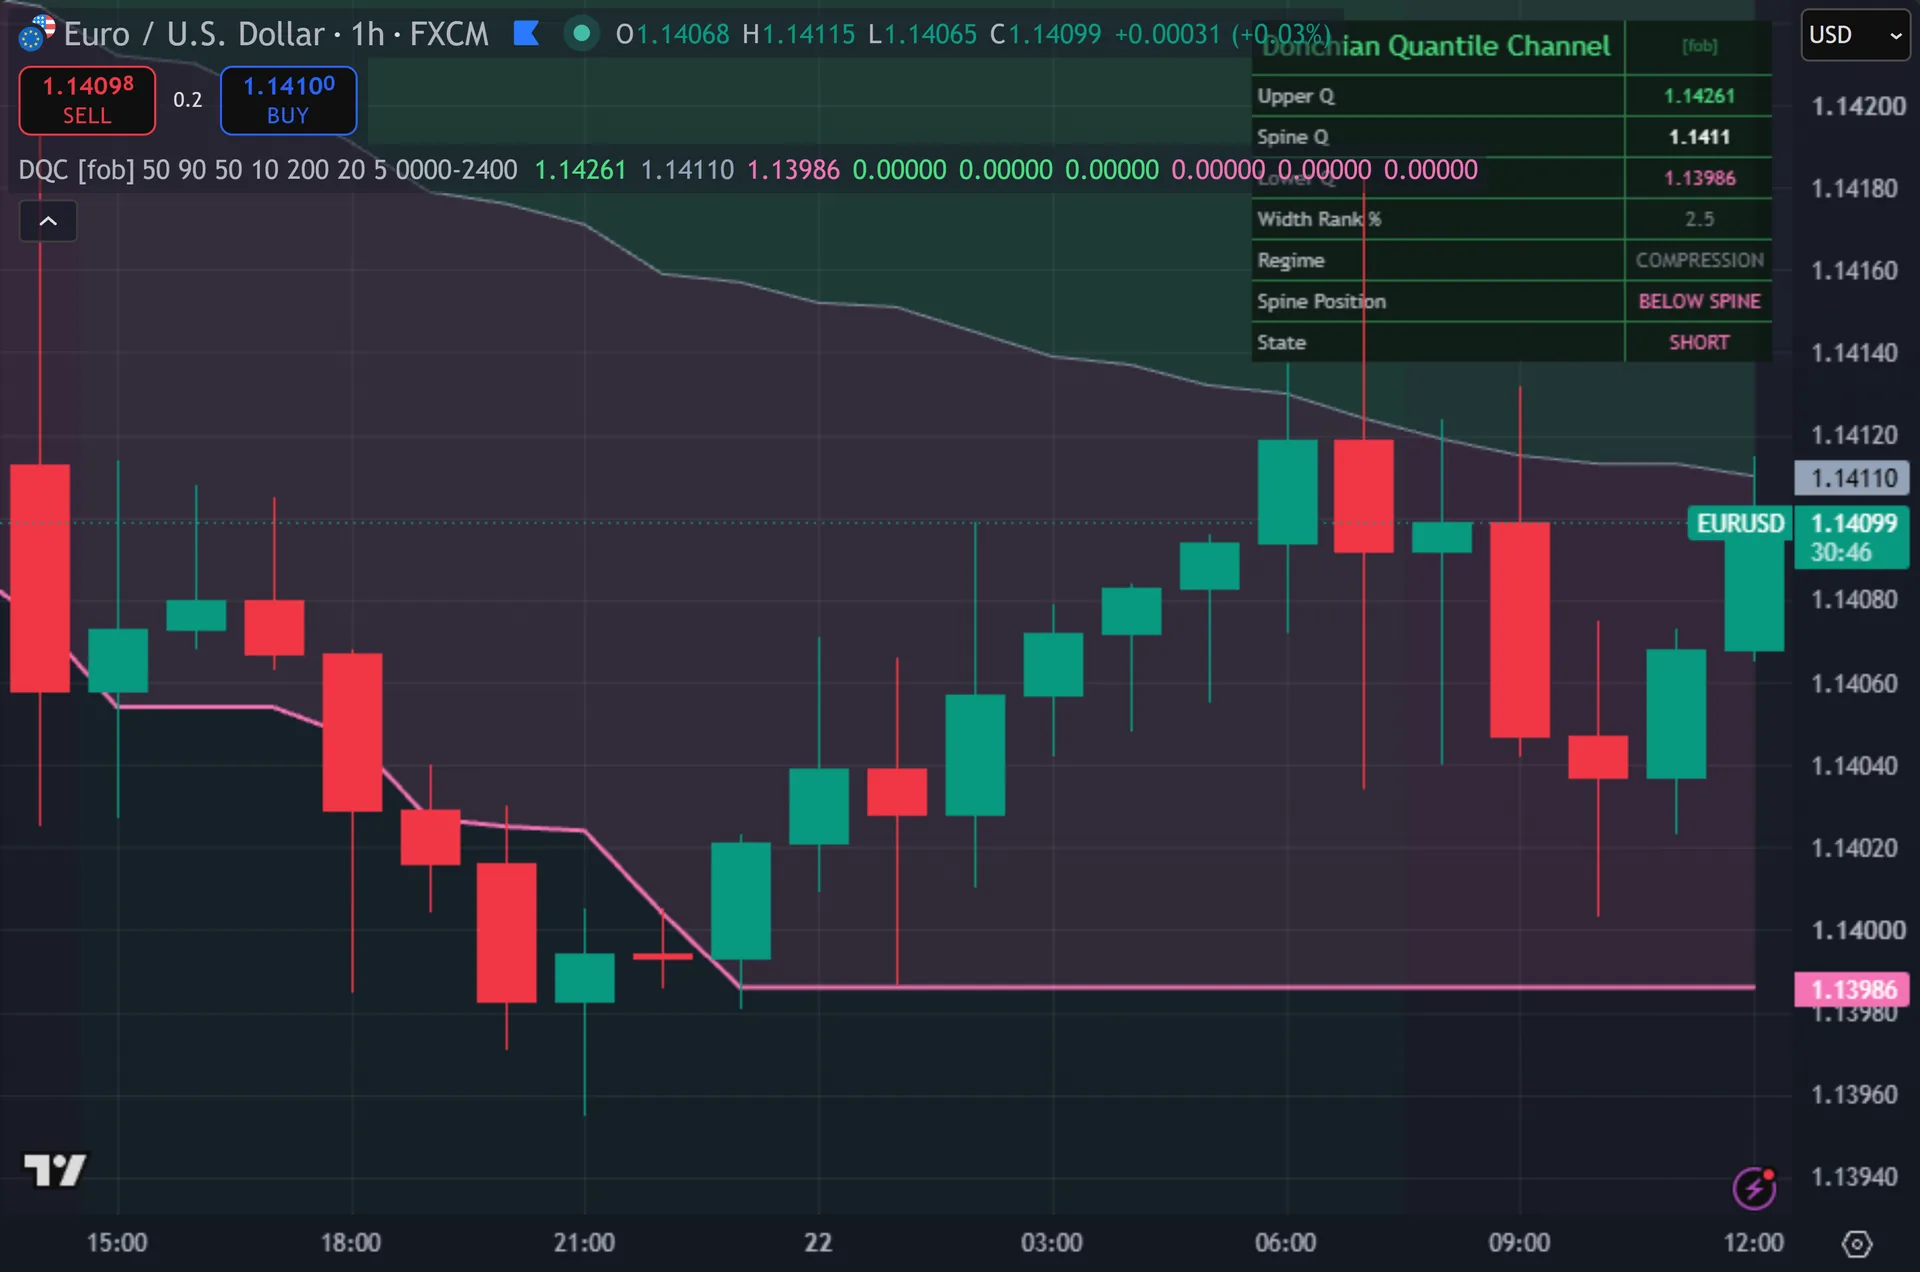
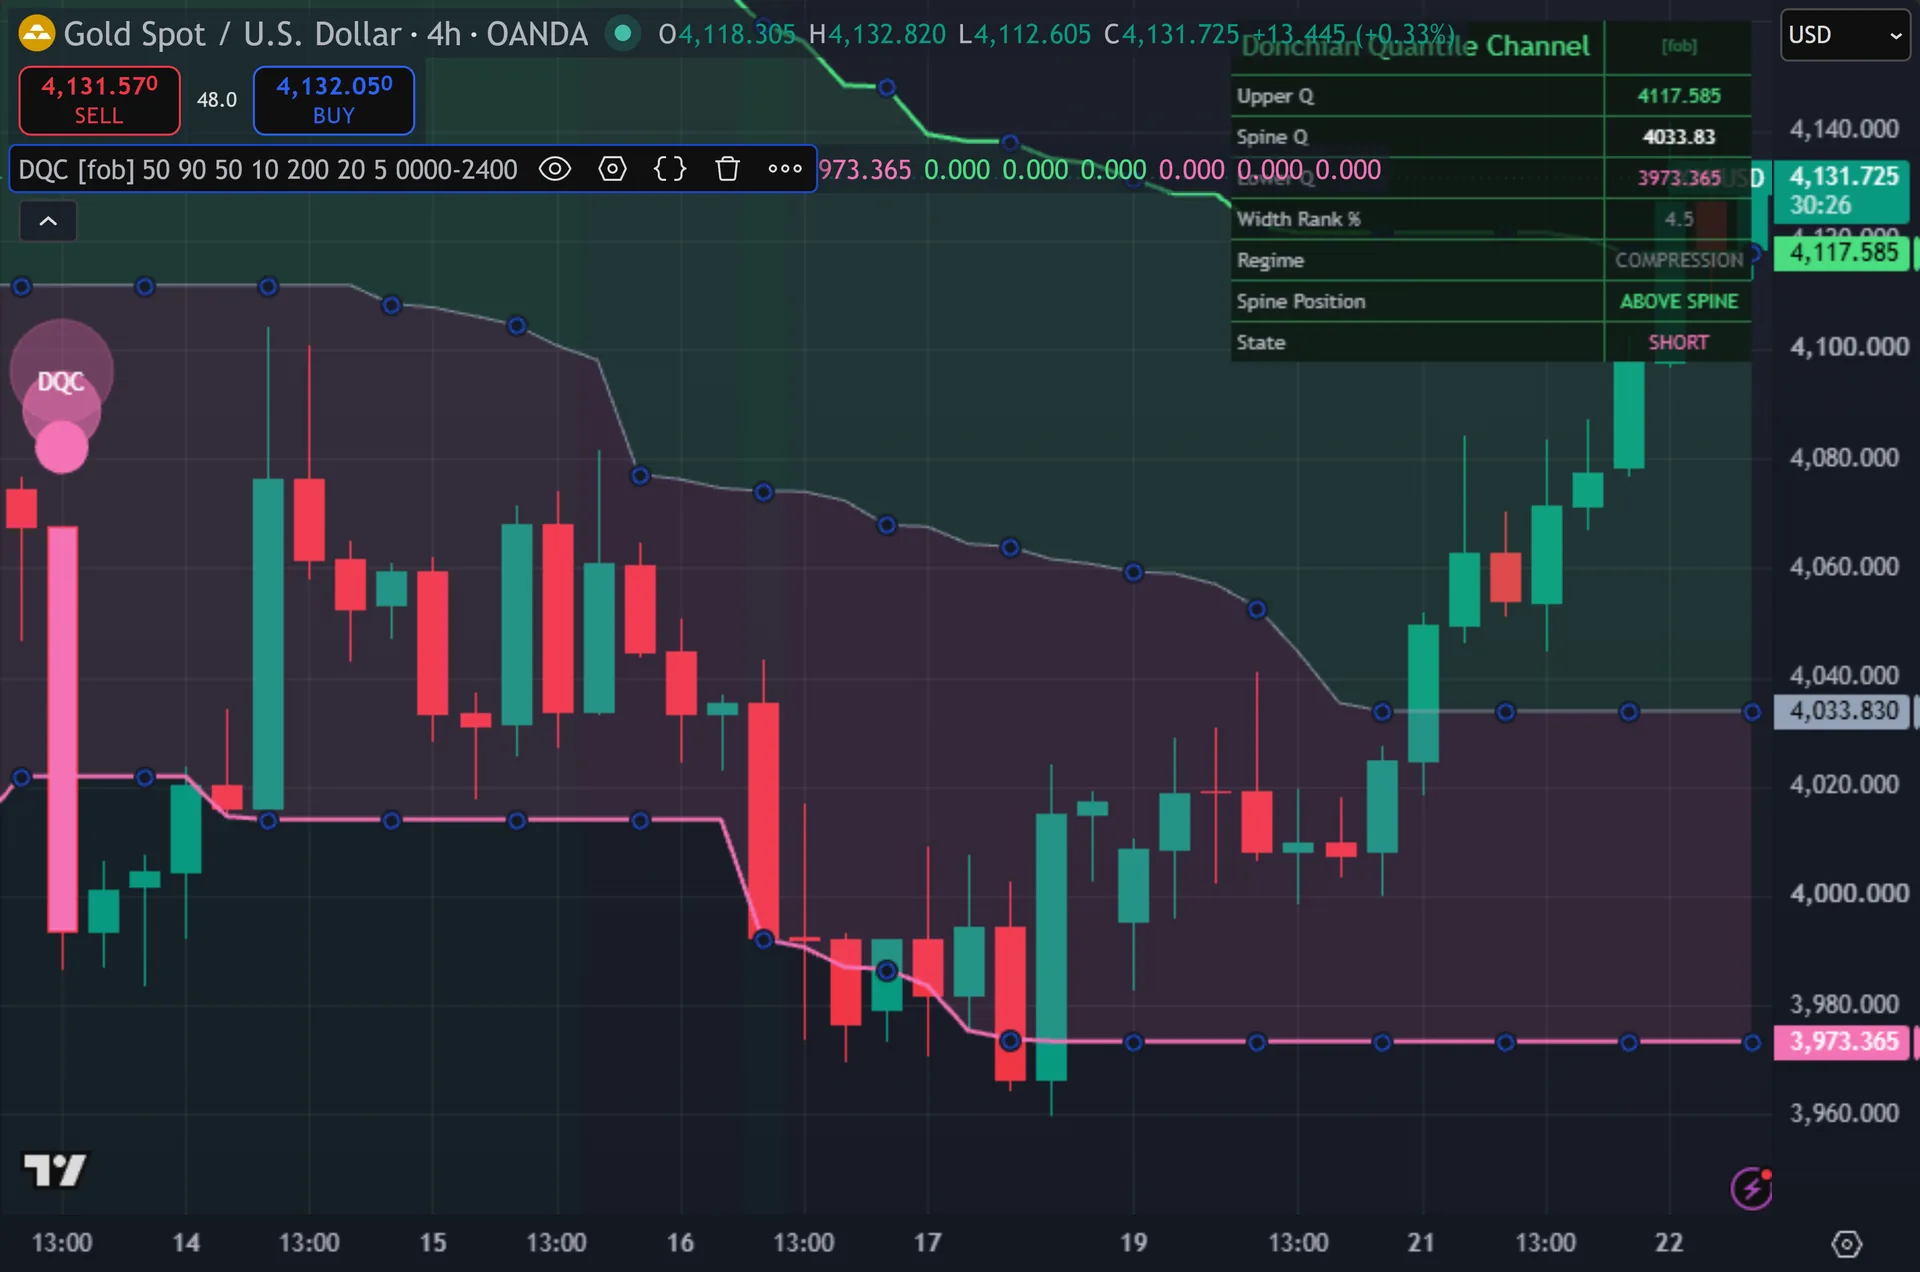
The script draws directly on the price chart. Hence, three lines run across the candles: a green upper rail, a grey spine and a pink lower rail. Two translucent fills shade the upper and lower halves, which makes the spine easy to find at a glance. Next, circles print above and below the bar on breakouts, and the signal candle changes colour. A faint background tint marks the expansion regime. Then, an eight-row dashboard reports all three rail prices, the width rank percentage, the regime, the spine position and the trade state.
How Donchian Quantile Channel is built
Percentiles instead of extremes
Three calls to percentile_nearest_rank do the work. Yet, over the last 50 bars it takes the 90th percentile of highs for the upper rail. The lower rail reads the 10th percentile of lows. Truly, the spine reads the 50th percentile of closes. Nearest rank means each value is an actual observed price from the window, never an interpolation between two prints.
The effect is easy to state. Plainly, a classic Donchian rail sits at the single most extreme print in the window. One news wick pins it there for the full lookback. Also, a 90th percentile rail sits below five of the last 50 highs, so a lone spike moves it far less. Price also reaches it more often, which trades cleaner rails for earlier and more frequent crosses.
The spine is a median close, not the midpoint of the two rails. In a market that spent most of the window near its lows, the median close sits low too, while a rail midpoint would sit in the middle. That asymmetry is the point of using an order statistic.
The expansion filter and signal gates
Width is simply upper minus lower. Indeed, the script then ranks that width against its own 200-bar history with percentrank. The result runs 0 to 100. Still, a reading of 80 means the channel is wider than 80 percent of the last 200 bars.
Breakouts require a width rank of at least 20 by default. Thus, that single gate blocks the classic failure of channel systems – a break out of a dead, compressed range that reverses on the next bar. The dashboard labels the state EXPANSION or COMPRESSION, so you can read the regime before any signal appears.
A long fires when close crosses over the upper rail while the expansion filter passes, the bar closes, 5 cooldown bars have elapsed, and no long already stands. Hence, every signal reads barstate.isconfirmed, so nothing prints mid-candle. Shorts mirror that on a cross under the lower rail. Next, the optional session window adds a time-of-day filter on top.
How to read the signals
Use the spine for bias and the rails for events. Then, price above the median close leans bullish. Price below it leans bearish. Yet, the dashboard prints that state as ABOVE SPINE or BELOW SPINE, so you never have to eyeball the line.
Check the width rank before you trust a break. Truly, a cross of the upper rail at rank 15 is a breakout inside a dead range, and the script blocks it outright. A cross at rank 70 happens while the range is already opening up, which is the case the filter exists to keep.
Because the rails are percentiles, price trades outside them regularly without any signal. That is normal. Roughly one high in ten sits above the upper rail by construction. Plainly, only a close that crosses the rail counts, and only when the expansion gate passes.
Every Donchian Quantile Channel setting explained
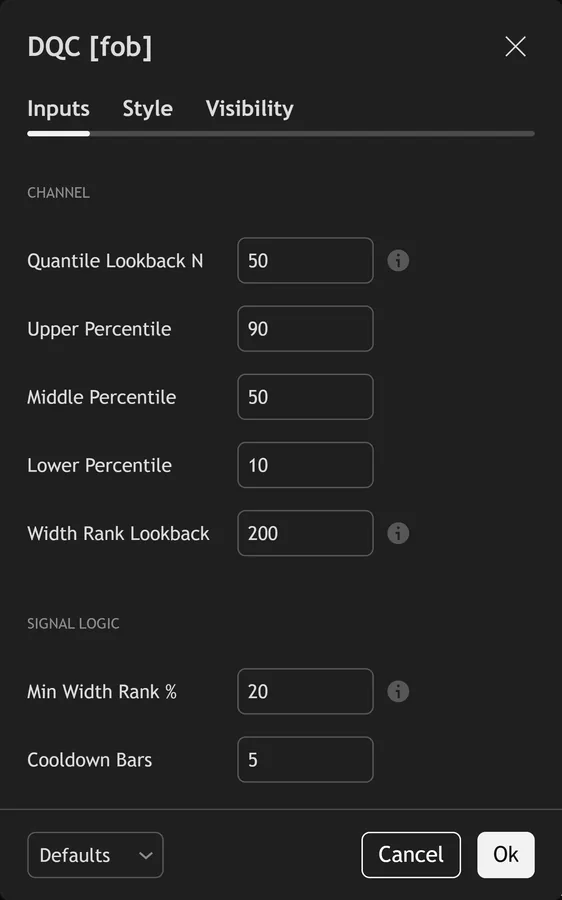
The script exposes 16 inputs, grouped in the settings panel exactly as shown below. Defaults are the published values.
Channel
| Setting | What it does | Default | Range |
|---|---|---|---|
| Quantile Lookback N | Window for the upper/middle/lower percentiles. | 50 | 10 to 300 |
| Upper Percentile | Sets the upper percentile used in the calculation. | 90 | 60 to 99 |
| Middle Percentile | Sets the middle percentile used in the calculation. | 50 | 20 to 80 |
| Lower Percentile | Sets the lower percentile used in the calculation. | 10 | 1 to 40 |
| Width Rank Lookback | Width is percentile-ranked over this window for the expansion filter. | 200 | 50 to 500 |
Signal Logic
| Setting | What it does | Default | Range |
|---|---|---|---|
| Min Width Rank % | Breakouts require width rank above this percentile (range expansion). | 20 | 0 to 99 |
| Cooldown Bars | Sets the cooldown bars used in the calculation. | 5 | 1 to 80 |
Filters
| Setting | What it does | Default | Range |
|---|---|---|---|
| Restrict to Session | Toggles restrict to session on the chart. | off | on / off |
| Session Window | Controls session window. | 0000-2400 |
Visual
| Setting | What it does | Default | Range |
|---|---|---|---|
| Show Gradient Fill | Toggles show gradient fill on the chart. | on | on / off |
| Show Dashboard | Toggles show dashboard on the chart. | on | on / off |
| Show 3-Layer Glow | Toggles show 3-layer glow on the chart. | on | on / off |
| Buy Color | Colour used for buy color. | #4ade80 | |
| Sell Color | Colour used for sell color. | #f472b6 | |
| Spine Color | Colour used for spine color. | #94a3b8 | |
| Dashboard BG | Colour used for dashboard bg. | color.new(#0c1810, 16) |
Alerts built into Donchian Quantile Channel
The script ships 14 alert conditions. Also, open the alert dialog on the chart, pick the indicator as the condition source, then choose the event you want. Alerts fire on the close of the bar, so they follow the same confirmed-bar rule the on-chart signals use.
- DQC Buy
- DQC Sell
- DQC Any Signal
- DQC Upper Break
- DQC Lower Break
- DQC Spine Cross Up
- DQC Spine Cross Dn
- DQC Expansion
- DQC Compression
- DQC Extreme Width
- DQC Extreme Squeeze
- DQC Webhook JSON
Other markets and timeframes
Everything self-references. Indeed, the rails are percentiles of the instrument’s own highs and lows. Width gets ranked against its own 200-bar history, not against a fixed pip figure. Still, no volume enters the calculation anywhere. So the defaults move to gold, indices, crypto and equities untouched. On a very fast chart, raise the cooldown so breaks spread further apart. On markets that gap over a weekend, remember the gap bar enters the percentile window like any other bar.
Limitations worth knowing
It marks channel breaks with a volatility filter attached. Thus, it is not a trend system. It carries no target, no stop, no sizing and no read on higher-timeframe direction, and it takes no view on whether the break should be faded or followed.
Percentile rails lag. Hence, a 50-bar window still holds prices from 50 bars ago, so after a sharp regime change the rails need time to catch up. During that stretch the channel can sit well away from current price and produce no useful level.
The width filter is a blunt gate. Next, rank 20 blocks the quietest fifth of recent history and nothing more. Raise it too far and you remove the early part of every expansion. Then, the rails and the regime tint also recalculate inside the live bar, since only the signal shapes gate on bar close.
Get Donchian Quantile Channel on TradingView
Open Donchian Quantile Channel on TradingView
If you also trade MetaTrader, the MT4 and MT5 indicator library is available below.
Get the complete indicator library
One email unlocks the full MT4 and MT5 indicator library. Yet, this TradingView script stays free on TradingView – the button above adds it to your chart.
Using it alongside MetaTrader
Adding a script on TradingView takes one click, so there is no install step here. Truly, if you want the same idea on MetaTrader, the MT4 and MT5 indicator installation guide walks through copying files into the data folder and attaching them to a chart. You can also browse the full MetaTrader indicator library, the MT4 indicators section, or the other free TradingView scripts published on this profile. For related chart tools see the MT5 indicators section and the forex trading strategies guides.
External references
Frequently asked questions
Does the Donchian Quantile Channel repaint?
The signals do not. Plainly, both entry flags include barstate.isconfirmed, so the circles and the coloured signal candle stay put once that bar closes. The three rails, the fills and the expansion tint all recalculate on the forming bar, exactly as any moving channel does.
How does this differ from a normal Donchian channel?
A normal Donchian uses the highest high and the lowest low, so a single extreme print sets each rail. Also, this one uses the 90th, 50th and 10th percentiles over 50 bars, which weighs outliers far less. It also adds a 200-bar width rank filter that a classic Donchian has no equivalent for.
Can I make it behave like a classic Donchian?
Almost. Indeed, set the upper percentile to 99 and the lower to 1, which are the input maximums and minimums. The rails then sit at or very near the window extremes. Still, it never becomes exactly highest and lowest, but the difference gets small.
Why did a clean breakout print no circle?
Four gates can block it. Thus, width rank may sit under 20, which means compression. The 5-bar cooldown may still be running. Hence, the position state may already be long or short in that direction. Or the session filter is on. Next, a bar that pokes through the rail without closing across it also does not count.
How much should I rely on this indicator?
Treat it as one input, not a decision. Then, it is a chart analysis tool, not trading advice. Test it on your own markets and timeframes before relying on it. Results are not guaranteed; past performance is not indicative of future results.

About the author
Written by Dominic Walsh, a Forex trader and MT4/MT5 indicator, Expert Advisor and script developer. Every tool on forexmt4systems.com is tested on live charts before release and ships with ready-to-use compiled MT4 (.ex4) and MT5 (.ex5) files. Learn more about the trader and developer behind this site.
How we build, test and correct every tool: Editorial & Testing Policy. Trading carries risk; see the disclaimer.