
Drawing retracements by hand costs time, and two traders rarely pick the same swing. Also, dynamic Fibonacci Auto, a free auto fibonacci indicator TradingView traders can add in one click, removes that step. It locks onto the last confirmed pivot high and pivot low. Then it projects the 23.6, 38.2, 50, 61.8 and 78.6 retracements, plus the 127.2 and 161.8 extensions, and flags bounces inside the golden zone.
It is free and open source. Indeed, you can add it to any chart from the Dynamic Fibonacci Auto script page on TradingView, and the full Pine source is published there for you to read.
What Dynamic Fibonacci Auto plots on the price chart
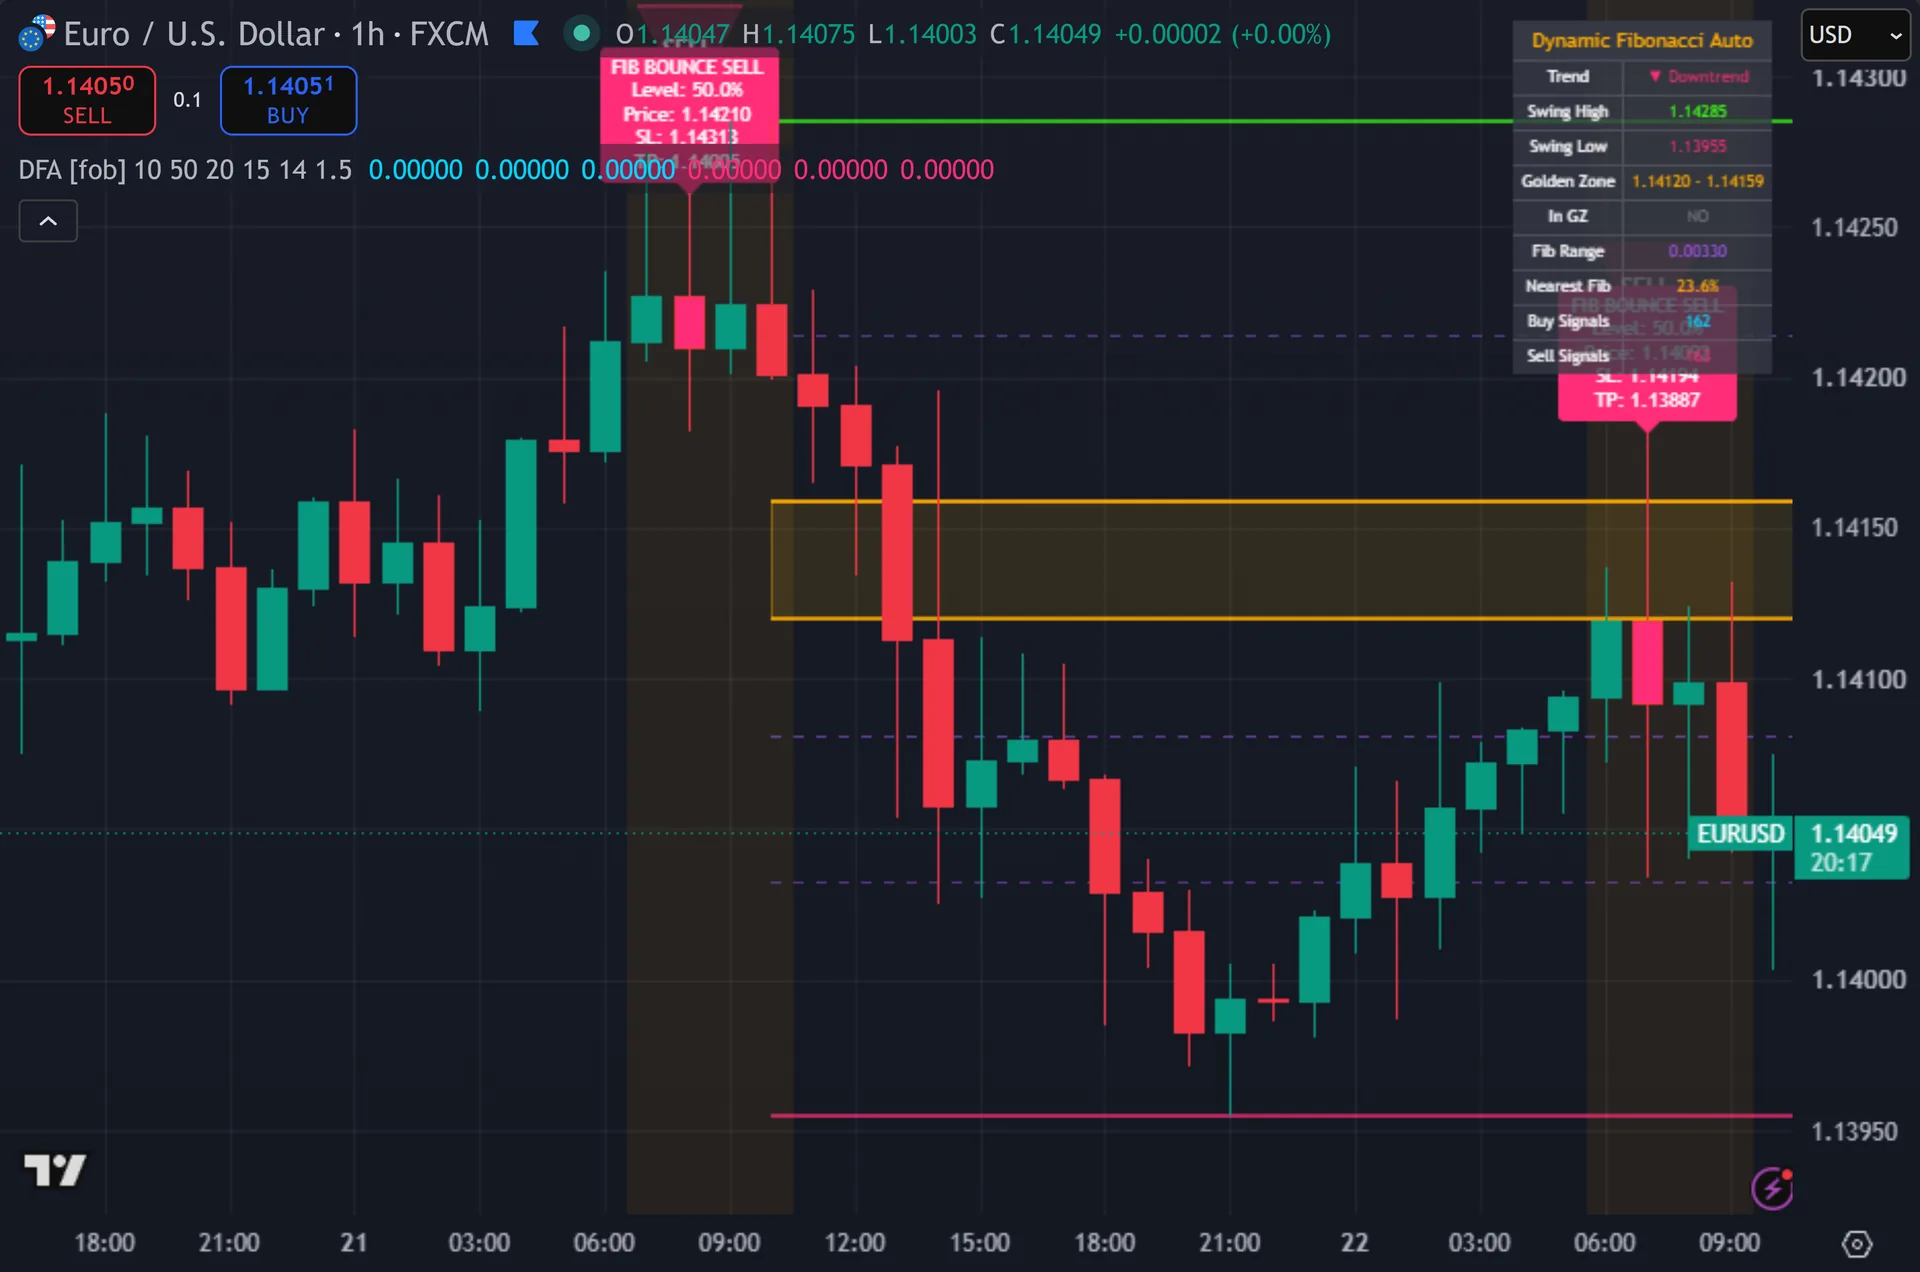
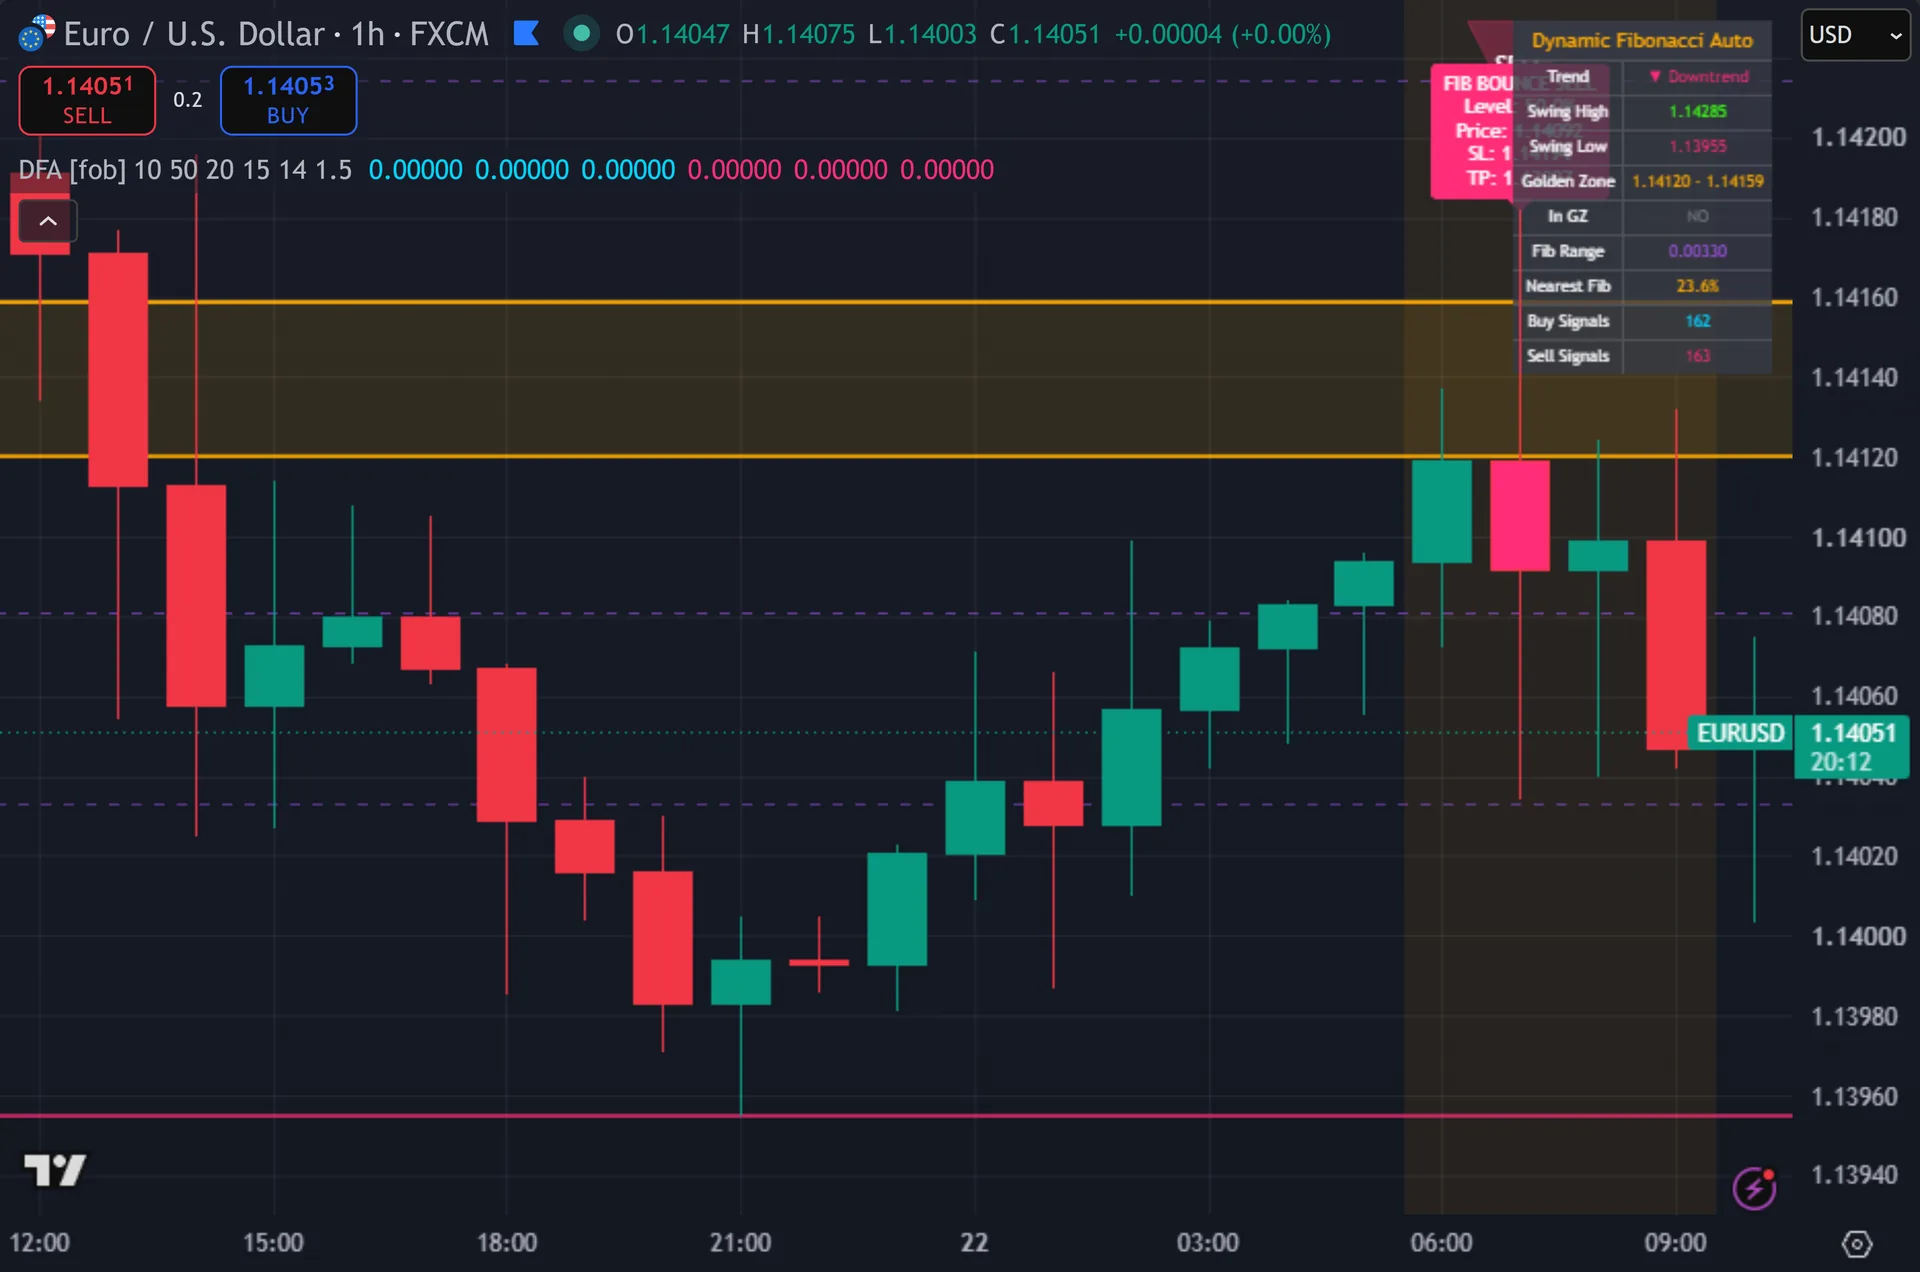
Seven lines stretch from the older swing to 20 bars ahead of price, each carrying its percentage at the right edge. Still, solid orange marks 50 and 61.8. A shaded box fills the band between them – the golden zone – and the background tints while price trades inside it. Thus, green and pink lines mark the swing high and swing low. Signals print as triangles with a label naming the nearest level, the entry price, an ATR stop and a target. Hence, a ten-row table reports trend, both swings, the zone range, the nearest level and signal counts.
How Dynamic Fibonacci Auto is built
Step one: find the swings
The script calls pivothigh and pivotlow with a length of 10 on each side. Next, a bar becomes a pivot high only after 10 later bars fail to exceed it. That is the honest cost of automatic swings: confirmation arrives 10 bars after the high itself. Then, the script backdates the anchor to the true pivot bar, so the geometry lines up once it appears.
It then keeps the most recent confirmed high and low, along with their bar indexes. Direction follows from their order. If the low confirmed before the high, the script calls it an uptrend and measures retracements down from the high. Yet, if the high came first, it flips and measures up from the low. The range is simply high minus low, and it must stay positive for anything to draw.
Step two: build the zone and the signal
Each level takes a fraction of that range. In an uptrend the script subtracts 0.236, 0.382, 0.500, 0.618 and 0.786 of the range from the swing high. Extensions run past the swing instead. Truly, it adds 0.272 and 0.618 of the range beyond the high, which gives the familiar 127.2 and 161.8 marks.
The golden zone is the band between the 50 and 61.8 lines. Plainly, price counts as inside when the bar low sits at or under the zone top and the bar high sits at or above the zone bottom. A bullish bounce then needs a close above the open and above the zone midpoint.
Four filters stand between a bounce and an arrow. Also, volume must beat its 20-bar average. The trend flag must read uptrend, and close must sit above the 50-period EMA. Indeed, fifteen bars must have passed since the last signal. Finally the bar must close, because the whole test runs behind barstate.isconfirmed.
How to read the signals
Read the table first. Still, trend tells you which way the script measured the range. In GZ tells you whether price currently works the 50 to 61.8 band. Thus, nearest Fib names the level closest to the current close, which helps when the lines crowd together.
The arrow label names the level, the entry price, a stop at 1.5 ATR and a target at 3 ATR. Hence, those numbers give you a frame at a fixed 2:1 ratio. They do not adapt, and the script never checks whether either level gets hit.
Expect the whole level set to jump when a fresh pivot confirms. Next, the bounce logic stays honest – every arrow used levels that already existed on that bar – but the lines you see now differ from the lines of 10 bars ago. Note a level down if you plan to trade it.
Every Dynamic Fibonacci Auto setting explained
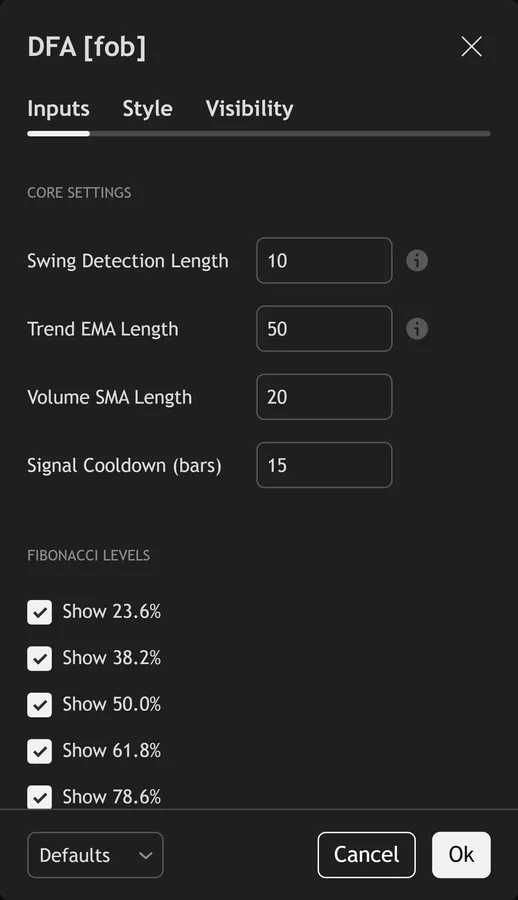
The script exposes 21 inputs, grouped in the settings panel exactly as shown below. Defaults are the published values.
Core Settings
| Setting | What it does | Default | Range |
|---|---|---|---|
| Swing Detection Length | Lookback for pivot high/low detection | 10 | 3 to 30 |
| Trend EMA Length | EMA for trend direction confirmation on bounce signals | 50 | 10 to 200 |
| Volume SMA Length | Sets the volume sma length used in the calculation. | 20 | 5 to 50 |
| Signal Cooldown (bars) | Sets the signal cooldown (bars) used in the calculation. | 15 | 5 to 50 |
Fibonacci Levels
| Setting | What it does | Default | Range |
|---|---|---|---|
| Show 23.6% | Toggles show 23.6% on the chart. | on | on / off |
| Show 38.2% | Toggles show 38.2% on the chart. | on | on / off |
| Show 50.0% | Toggles show 50.0% on the chart. | on | on / off |
| Show 61.8% | Toggles show 61.8% on the chart. | on | on / off |
| Show 78.6% | Toggles show 78.6% on the chart. | on | on / off |
Advanced Settings
| Setting | What it does | Default | Range |
|---|---|---|---|
| ATR Length | Sets the atr length used in the calculation. | 14 | 5 to 50 |
| SL ATR Multiplier | Stop-loss as ATR multiple | 1.5 | 0.5 to 5.0 |
| Show SL/TP on Labels | Toggles show sl/tp on labels on the chart. | on | on / off |
| Show Extension Levels | Show 127.2% and 161.8% extension levels | on | on / off |
Visual Settings
| Setting | What it does | Default | Range |
|---|---|---|---|
| Show Info Table | Toggles show info table on the chart. | on | on / off |
| Show Golden Zone Fill | Toggles show golden zone fill on the chart. | on | on / off |
| Show Golden Zone Background | Background tint when price is in golden zone | on | on / off |
| Buy Color | Colour used for buy color. | #00d4ff | |
| Sell Color | Colour used for sell color. | #ff2d78 | |
| Bullish Accent | Colour used for bullish accent. | #39ff14 | |
| Level Color | Colour used for level color. | #a855f7 | |
| Golden Zone Color | Colour used for golden zone color. | #ffaa00 |
Alerts built into Dynamic Fibonacci Auto
The script ships 11 alert conditions. Then, open the alert dialog on the chart, pick the indicator as the condition source, then choose the event you want. Alerts fire on the close of the bar, so they follow the same confirmed-bar rule the on-chart signals use.
- Bullish Fib Bounce
- Bearish Fib Bounce
- Price in Golden Zone
- New Swing High
- New Swing Low
- Any Fib Signal
- Unconfirmed Bull Bounce
- Unconfirmed Bear Bounce
- Fib Range Expansion
Other markets and timeframes
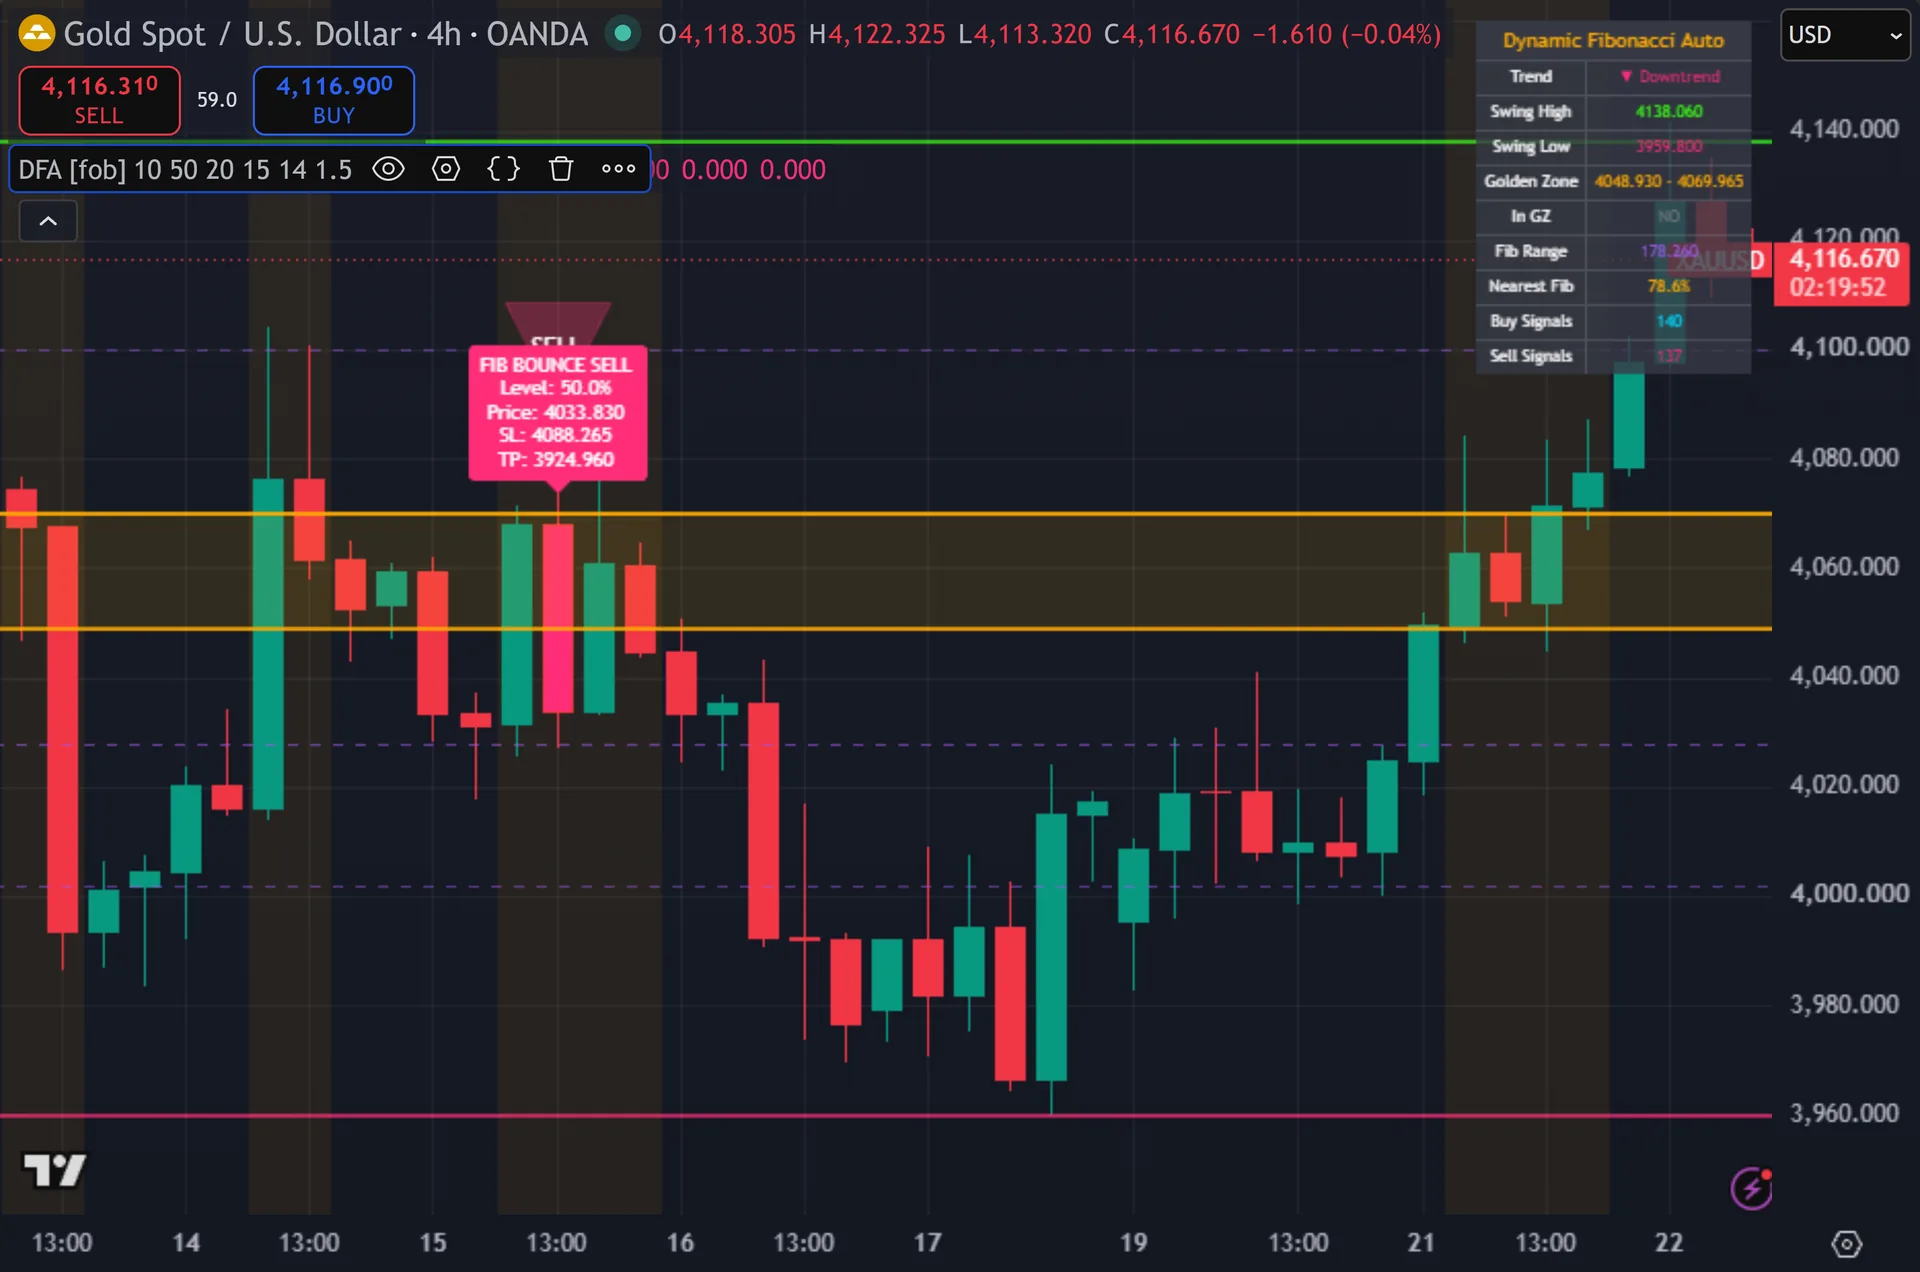
The maths scales with whatever swing it finds, so no input depends on a currency or a price level. Yet, ranges, retracements and the golden zone all come from high minus low on the chart in front of you. Gold, indices, crypto and equities behave the same way. Truly, two inputs deserve a look per market. Swing length matters because a fast chart throws more pivots. Plainly, the volume filter matters because it needs a real volume feed to mean anything.
Limitations worth knowing
Pivot confirmation lags by the swing length. Also, with the default of 10, the tool learns about a high 10 bars after it prints. It cannot mark a turn in real time, and no pivot setting removes that delay.
Only the latest high and the latest low feed the calculation. Indeed, the script does not rank swings by size or hold a stack of older ranges, so a small recent pivot can replace a far more meaningful one. Raise the swing length when the levels look too local.
The stop and target on the label come from a fixed 1.5 ATR and 3 ATR rule. Still, the script does no trade management and keeps no record of results. The counters in the table simply count arrows, not outcomes.
Get Dynamic Fibonacci Auto on TradingView
Open Dynamic Fibonacci Auto on TradingView
If you also trade MetaTrader, the MT4 and MT5 indicator library is available below.
Get the complete indicator library
One email unlocks the full MT4 and MT5 indicator library. Thus, this TradingView script stays free on TradingView – the button above adds it to your chart.
Using it alongside MetaTrader
Adding a script on TradingView takes one click, so there is no install step here. Hence, if you want the same idea on MetaTrader, the MT4 and MT5 indicator installation guide walks through copying files into the data folder and attaching them to a chart. You can also browse the full MetaTrader indicator library, the MT4 indicators section, or the other free TradingView scripts published on this profile. For related chart tools see the MT5 indicators section and the forex trading strategies guides.
External references
- Elliott wave principle on Wikipedia
- Elliott Wave Theory at Investopedia
- Fibonacci Arcs at StockCharts ChartSchool
Frequently asked questions
Does Dynamic Fibonacci Auto repaint?
Signals do not. Next, every arrow waits for barstate.isconfirmed and uses levels that already existed on that bar. The lines differ. Then, they redraw whenever a fresh pivot confirms, and that confirmation lands 10 bars after the actual swing point.
What is the golden zone?
It is the band between the 50 and 61.8 percent retracements. Yet, many traders watch that pocket for continuation entries. The script shades it, tints the background while price trades inside it, and hunts for bounces only there.
Why did price touch 61.8 with no arrow?
Four filters can block it. Truly, volume sat at or below its 20-bar average, the close fell on the wrong side of the 50 EMA, the trend flag disagreed, or the 15-bar cooldown had not elapsed yet.
Can I use it on lower timeframes?
Yes, though pivots come faster and levels shift more often. Plainly, raise the swing length toward 20 or 30 on M1 and M5 charts, and raise the cooldown so arrows spread further apart.
How much should I rely on this indicator?
Treat it as one input, not a decision. Also, it is a chart analysis tool, not trading advice. Test it on your own markets and timeframes before relying on it. Results are not guaranteed; past performance is not indicative of future results.

About the author
Written by Dominic Walsh, a Forex trader and MT4/MT5 indicator, Expert Advisor and script developer. Every tool on forexmt4systems.com is tested on live charts before release and ships with ready-to-use compiled MT4 (.ex4) and MT5 (.ex5) files. Learn more about the trader and developer behind this site.
How we build, test and correct every tool: Editorial & Testing Policy. Trading carries risk; see the disclaimer.