
Big volume does not always mean continuation. Also, sometimes it marks the last buyers or sellers giving up. Exhaustion Volume Spike is a free volume exhaustion indicator TradingView traders can drop on any chart. Indeed, it waits for volume to clear twice its 20-bar average, then runs three trend checks before it calls that spike a turn rather than a push. Every other spike stays blue.
It is free and open source. Still, you can add it to any chart from the Exhaustion Volume Spike script page on TradingView, and the full Pine source is published there for you to read.
What Exhaustion Volume Spike plots on the price chart
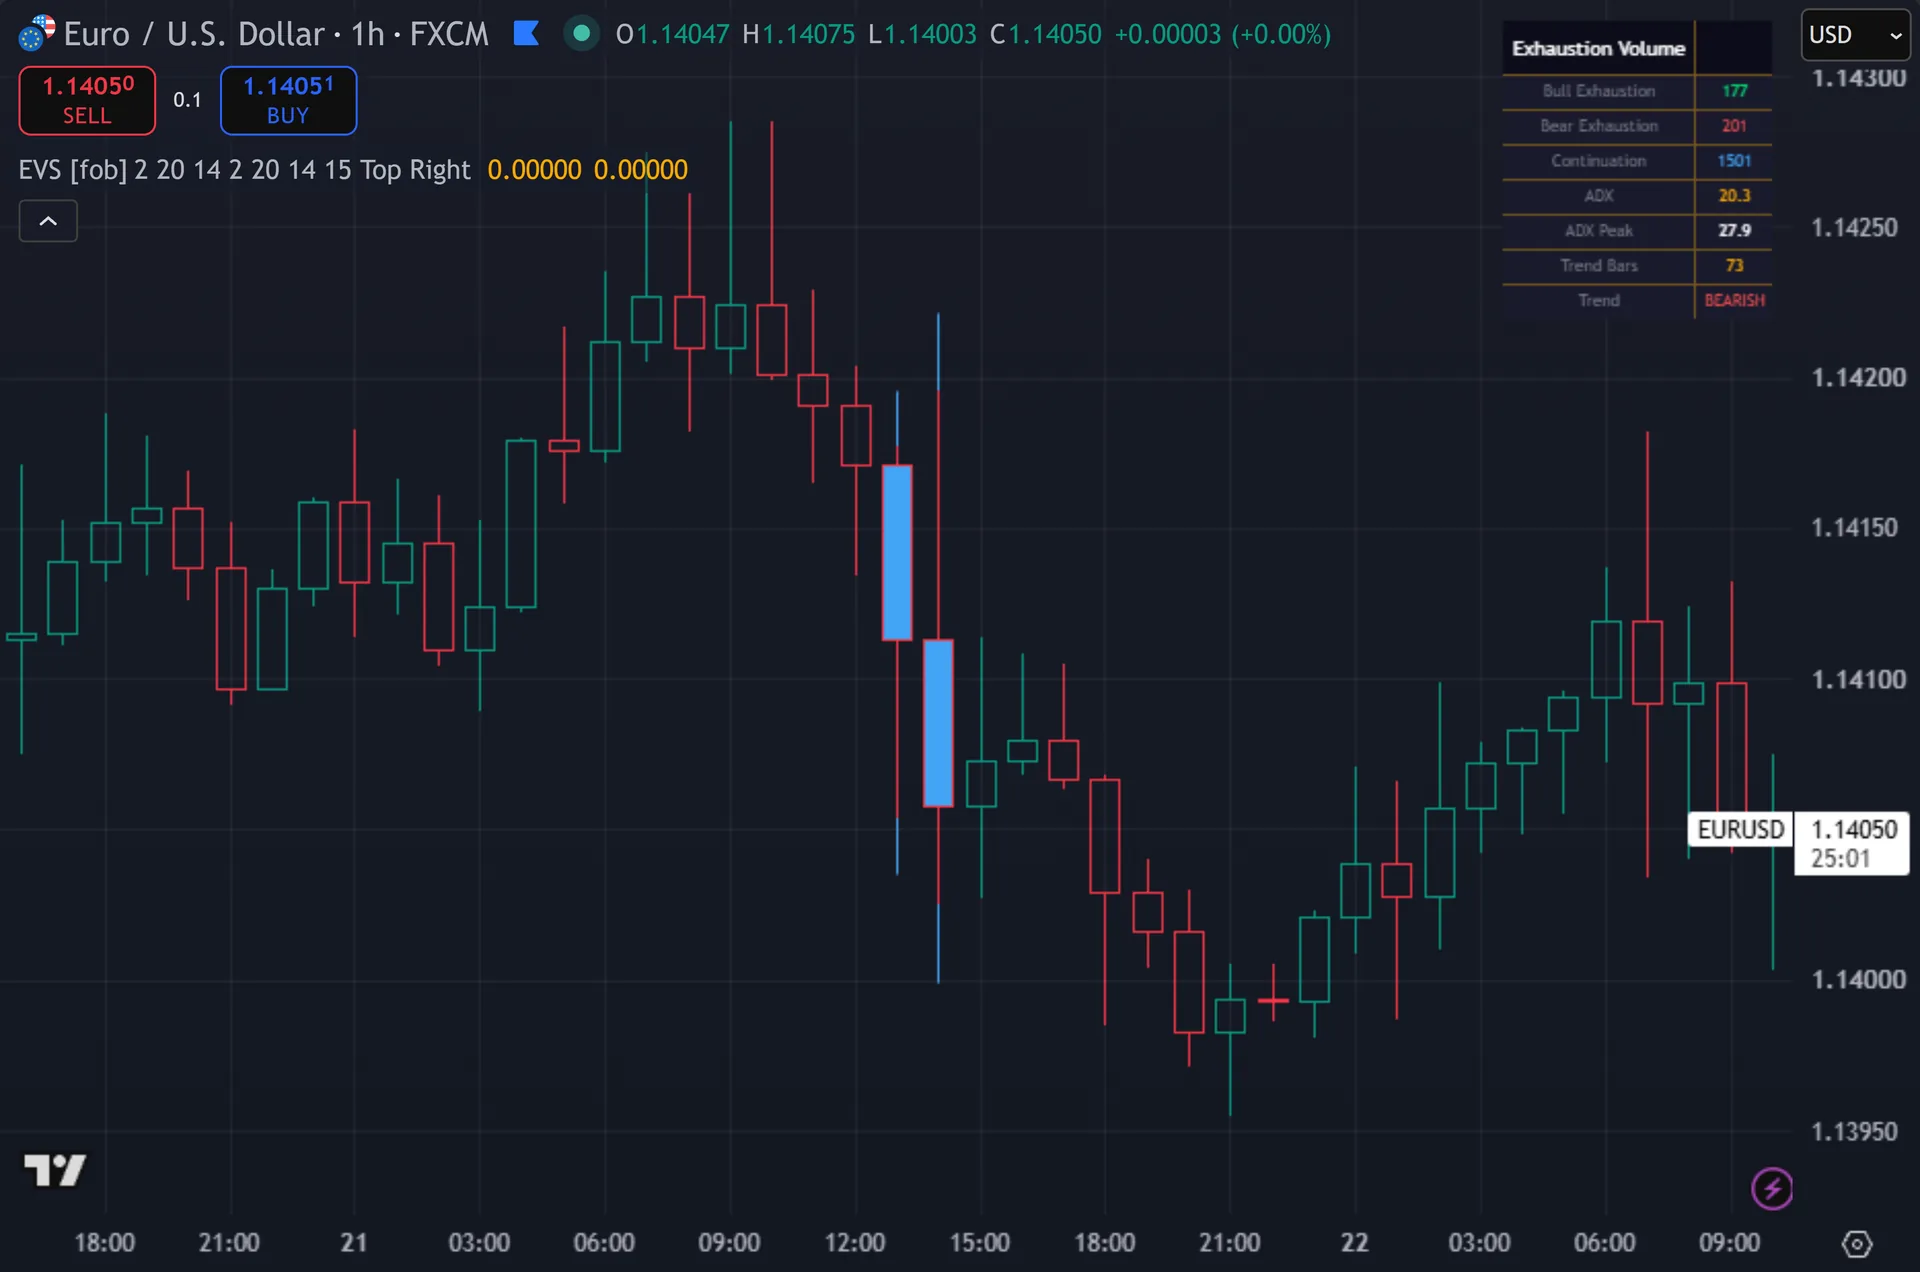
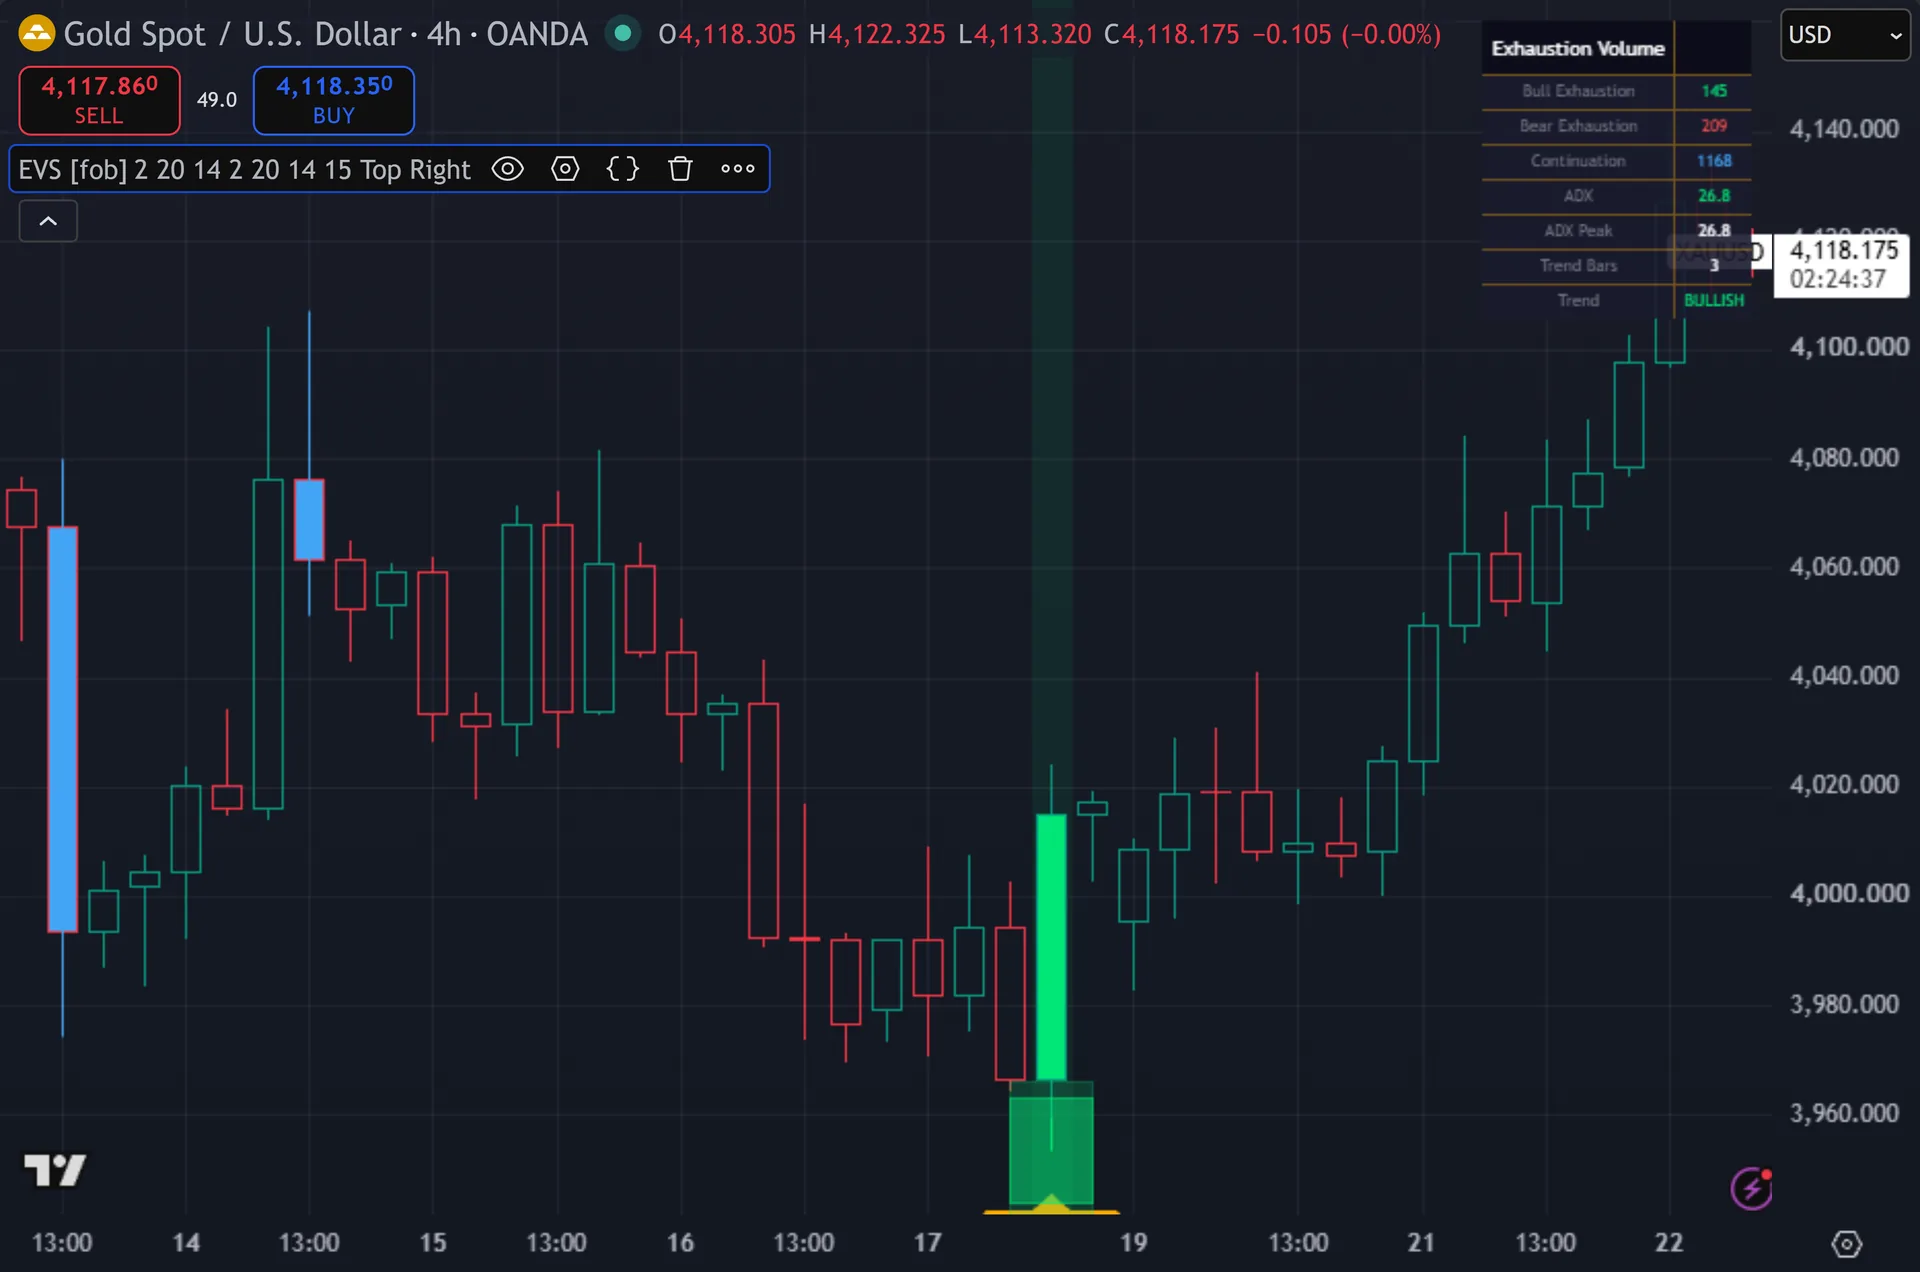
Qualifying bars get an orange EXHAUST label – below the bar for a bullish call, above it for a bearish one. Thus, three stacked boxes glow around the wick so the mark reads at a glance. Continuation spikes instead get a thin blue box across the bar range. Hence, the script also tints the signal bar and washes the background behind it. A small table sits top right. Next, it counts bull, bear and continuation spikes, then prints live ADX, ADX peak, bars in trend and trend direction.
How Exhaustion Volume Spike is built
Step one: define the spike and the trend
The script averages volume over 20 bars with a simple moving average. Then, any bar whose volume clears that average times the Volume Spike Multiplier counts as a spike. The multiplier starts at 2.0 and ranges from 1.2 to 5.0. Yet, so a spike means twice the recent norm by default, never a fixed lot count.
Trend comes from two EMAs. Truly, the script tracks EMA 20 against EMA 50. When EMA 20 climbs above EMA 50, it sets the trend to bullish, resets the bar counter to zero and re-seeds the ADX peak. Plainly, a cross the other way sets bearish and resets the same two values. That counter answers one question. How deep into this move are we?
A full Wilder ADX runs alongside at length 14. Also, the script builds DI+ and DI- from directional movement, smooths both with RMA, then smooths DX the same way. It also stores the highest ADX reading seen since the last trend flip.
Step two: four gates before an EXHAUST label
A spike alone prints nothing. Four gates must agree. First, bars in trend must exceed Min Bars in Trend, which starts at 20. Second, ADX must sit more than 2.0 points below its peak for this trend. Third, momentum must wane: in an uptrend, 14-bar momentum must drop under its own 14-bar average, and the mirror applies in a downtrend. Fourth, the bar must close.
Direction then flips the reading. Indeed, a bearish trend that exhausts means sellers are tired, so the script marks a bullish EXHAUST. A bullish trend that exhausts marks bearish. Still, a 15-bar cooldown per direction stops repeat labels inside the same turn.
Any spike that fails those gates counts as continuation, and the script draws it in blue. Thus, that split is the whole point of the tool. It separates volume that pushes from volume that ends. Hence, the table keeps a running count of both, so you can see how the current market behaves.
How to read the signals
Start with the trend rows in the table. Next, EXHAUST labels only appear once the counter passes 20 bars, so an early flag tells you the move has already run a while. Then check the ADX pair. Then, a live reading well under its peak is the condition that let the label through, and the wider that gap, the more the trend has cooled.
Treat the label as a warning about the current move, not an entry. Yet, it says the crowd just dumped size and the trend failed to accelerate. Where that happens matters. Truly, the same label at a prior swing high carries more weight than one printed mid-range.
The blue continuation boxes matter too. Plainly, a run of them tells you volume keeps pushing and the trend still has fuel. When those stop and an orange label appears, the character of the move just changed.
Every Exhaustion Volume Spike setting explained
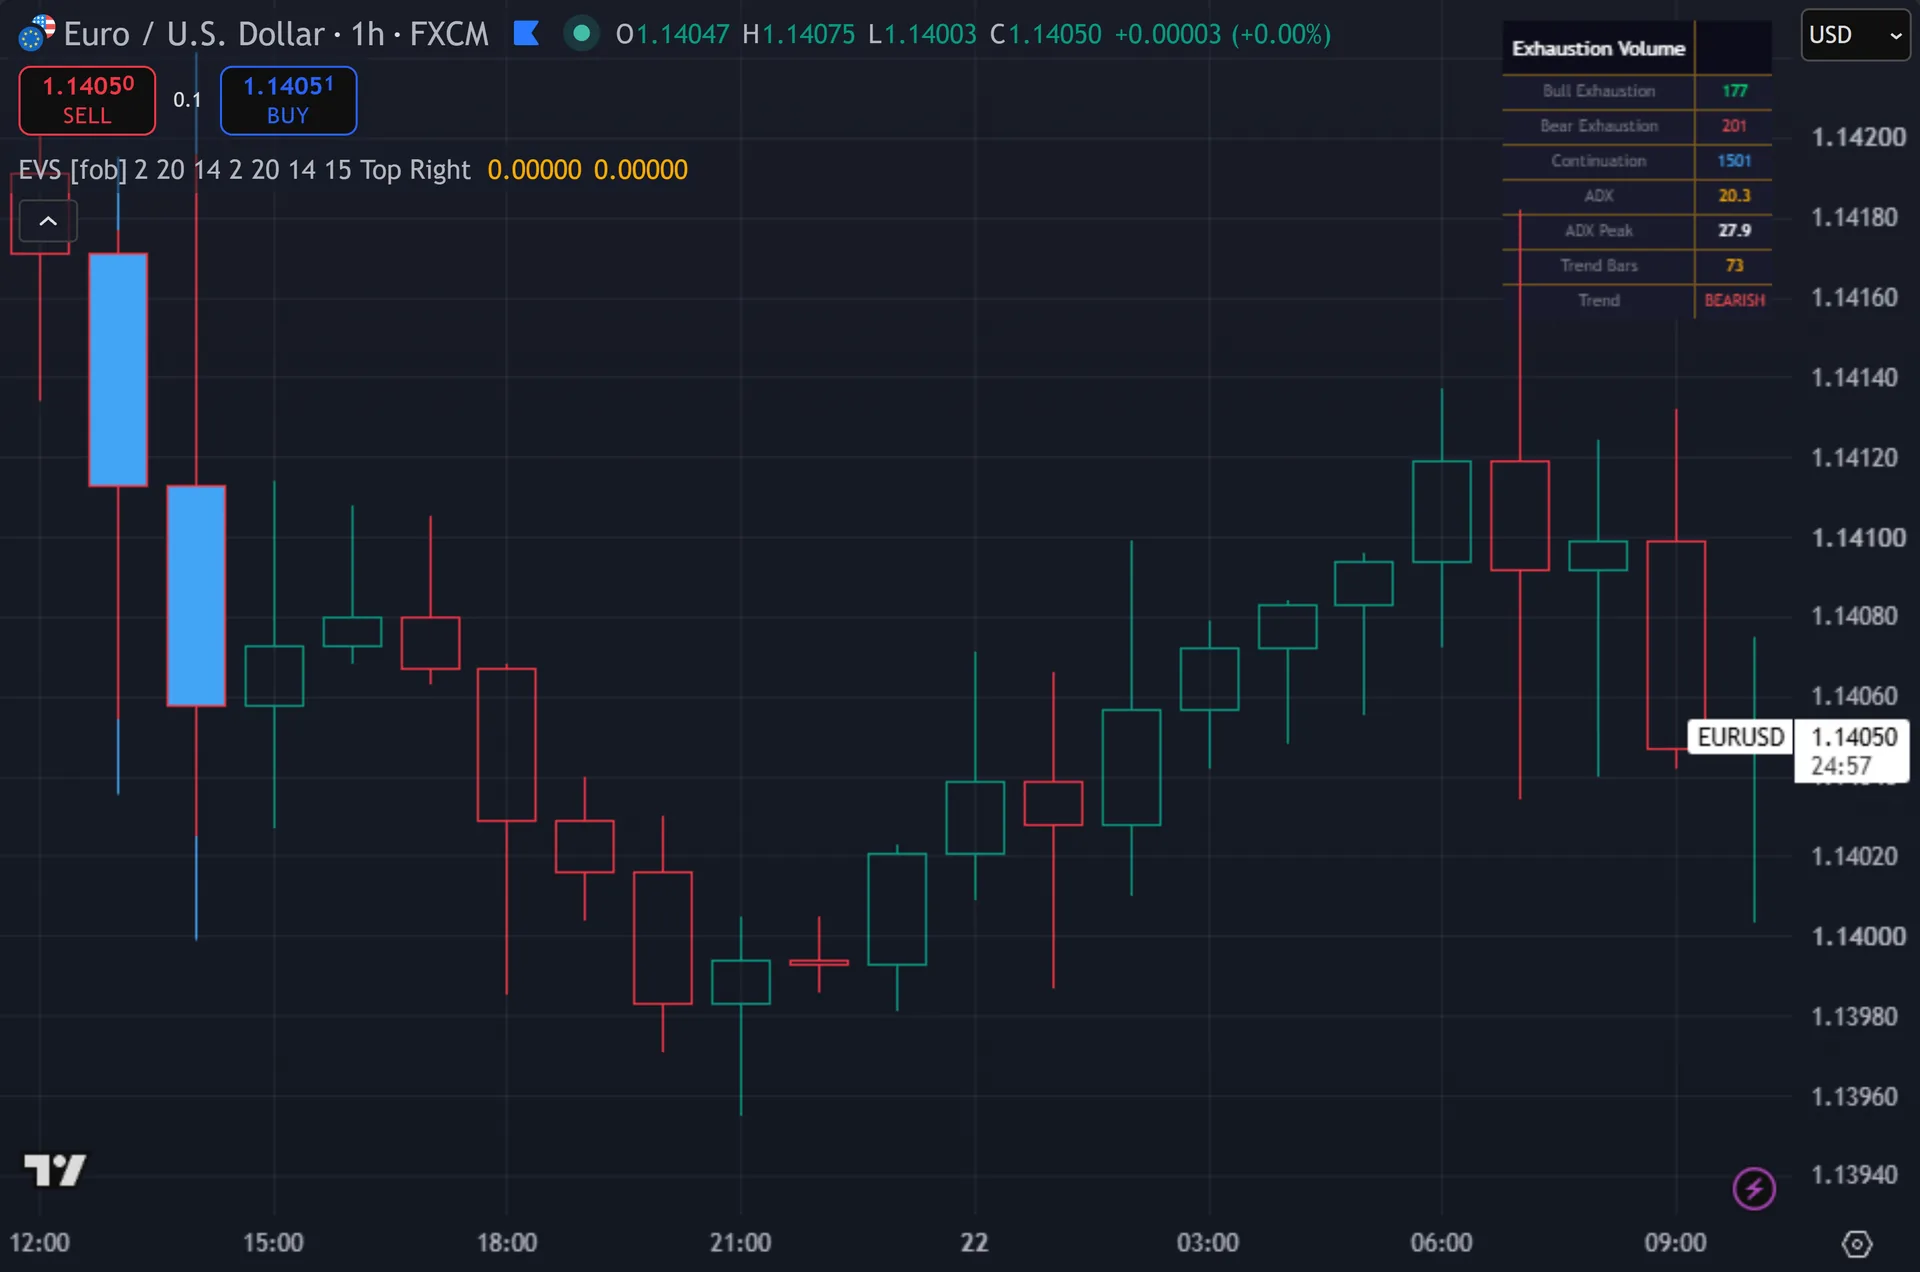
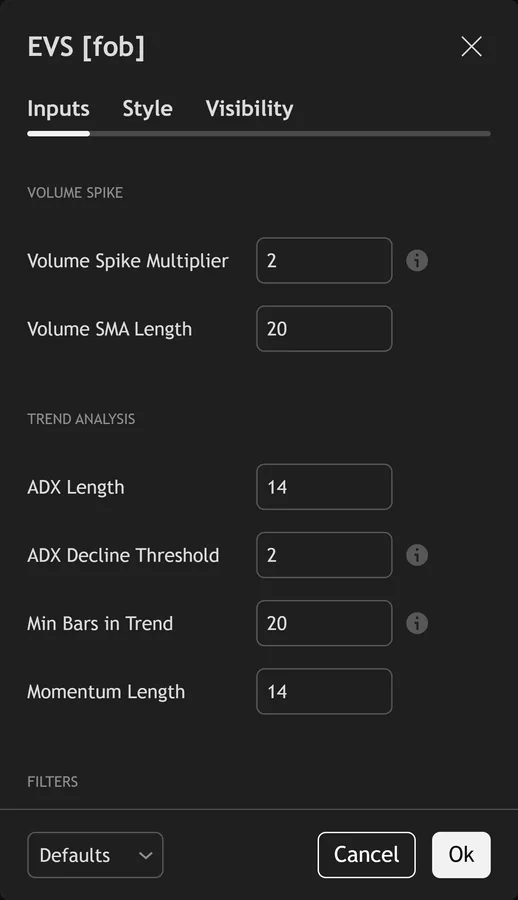
The script exposes 11 inputs, grouped in the settings panel exactly as shown below. Defaults are the published values.
Volume Spike
| Setting | What it does | Default | Range |
|---|---|---|---|
| Volume Spike Multiplier | Volume must exceed SMA by this factor | 2.0 | 1.2 to 5.0 |
| Volume SMA Length | Sets the volume sma length used in the calculation. | 20 | 5 to 100 |
Trend Analysis
| Setting | What it does | Default | Range |
|---|---|---|---|
| ADX Length | Sets the adx length used in the calculation. | 14 | 5 to 50 |
| ADX Decline Threshold | ADX must have declined by this amount from peak | 2.0 | 0.5 to 10.0 |
| Min Bars in Trend | How many bars into a move before exhaustion possible | 20 | 5 to 100 |
| Momentum Length | Sets the momentum length used in the calculation. | 14 | 5 to 50 |
Filters
| Setting | What it does | Default | Range |
|---|---|---|---|
| Signal Cooldown Bars | Sets the signal cooldown bars used in the calculation. | 15 | 5 to 50 |
Visuals
| Setting | What it does | Default | Range |
|---|---|---|---|
| Show Glow Effects | Toggles show glow effects on the chart. | on | on / off |
| Show All Volume Spikes | Highlight continuation spikes too | on | on / off |
Info Table
| Setting | What it does | Default | Range |
|---|---|---|---|
| Show Info Table | Toggles show info table on the chart. | on | on / off |
| Table Position | Choose the table position from the listed options. | Top Right | Top Left, Top Right, Bottom Left, Bottom Right |
Alerts built into Exhaustion Volume Spike
The script ships 11 alert conditions. Also, open the alert dialog on the chart, pick the indicator as the condition source, then choose the event you want. Alerts fire on the close of the bar, so they follow the same confirmed-bar rule the on-chart signals use.
- Bull Exhaustion
- Bear Exhaustion
- Any Exhaustion
- Continuation Spike
- Any Volume Spike
- ADX Decline + Spike
- Extreme Bull Exhaust
- Extreme Bear Exhaust
- Exhaustion Webhook
Other markets and timeframes
The maths runs on ratios, so the defaults travel. Indeed, volume meets its own 20-bar average, ADX already scales 0 to 100, and momentum meets its own mean. Nothing uses a pip value or a fixed lot size. Still, one honest caveat applies to spot forex. Volume there comes from your broker’s tick count, not from a central exchange, so the spike test measures activity rather than traded size. Thus, stocks, futures and crypto feed it real exchange volume.
Limitations worth knowing
This flags exhaustion. Hence, it does not tell you what happens next. Trends often stall, chop sideways for thirty bars, then continue. Next, the label carries no stop, no target and no position size. You still bring your own structure and risk plan.
The trend model is two EMAs and nothing more. In a range, EMA 20 and EMA 50 cross back and forth, so the bar counter keeps resetting and the 20-bar gate rarely opens. You will see few labels in chop. Then, that is by design, yet it also means the tool goes quiet exactly when many traders want an opinion.
Volume drives the first gate. On instruments with no volume feed the indicator prints nothing at all. On spot forex the tick-volume proxy varies between brokers, so the same chart on two feeds can produce slightly different spikes.
Get Exhaustion Volume Spike on TradingView
Open Exhaustion Volume Spike on TradingView
If you also trade MetaTrader, the MT4 and MT5 indicator library is available below.
Get the complete indicator library
One email unlocks the full MT4 and MT5 indicator library. Yet, this TradingView script stays free on TradingView – the button above adds it to your chart.
Using it alongside MetaTrader
Adding a script on TradingView takes one click, so there is no install step here. Truly, if you want the same idea on MetaTrader, the MT4 and MT5 indicator installation guide walks through copying files into the data folder and attaching them to a chart. You can also browse the full MetaTrader indicator library, the MT4 indicators section, or the other free TradingView scripts published on this profile. For related chart tools see the MT5 indicators section and the forex trading strategies guides.
External references
- Accumulation/distribution index on Wikipedia
- On-Balance Volume at Investopedia
- CandleVolume at StockCharts ChartSchool
Frequently asked questions
Does Exhaustion Volume Spike repaint?
No. Plainly, both exhaustion signals gate on barstate.isconfirmed, so a label appears only after the bar closes. The historical chart matches what a live session would have shown. Also, the trade-off is timing – you act on the next bar’s open.
What separates an exhaustion spike from a continuation spike?
Both clear the same volume test. Indeed, an exhaustion spike also passes three trend checks: at least 20 bars into the move, ADX at least 2.0 points below its peak, and momentum under its own average. Spikes that miss any of those show up as blue continuation boxes.
Why does a bullish label appear during a downtrend?
That is intended. Still, a bullish EXHAUST means the bearish move is running out of sellers, so the script reads it as a possible upside turn. The mirror applies to a bearish label inside an uptrend.
Can I run it on the 5-minute chart?
Yes. Thus, every threshold stays relative, so no retuning is needed. Fast charts throw more spikes, so consider raising the Signal Cooldown above 15 bars and the Volume Spike Multiplier above 2.0 to thin the marks.
How much should I rely on this indicator?
Treat it as one input, not a decision. Hence, it is a chart analysis tool, not trading advice. Test it on your own markets and timeframes before relying on it. Results are not guaranteed; past performance is not indicative of future results.

About the author
Written by Dominic Walsh, a Forex trader and MT4/MT5 indicator, Expert Advisor and script developer. Every tool on forexmt4systems.com is tested on live charts before release and ships with ready-to-use compiled MT4 (.ex4) and MT5 (.ex5) files. Learn more about the trader and developer behind this site.
How we build, test and correct every tool: Editorial & Testing Policy. Trading carries risk; see the disclaimer.