
Fibonacci levels usually mark price. This one marks time. Fibonacci Time Window is a fibonacci time zones indicator TradingView traders can use to project forward from the gap between the last two confirmed swing pivots. Also, that gap becomes a base cycle. The script multiplies it by 1.0, 1.618 and 2.618, then draws three dashed windows where the next turn may land. Indeed, each window still needs a trend-aligned EMA cross before anything fires.
It is free and open source. Still, you can add it to any chart from the Fibonacci Time Window script page on TradingView, and the full Pine source is published there for you to read.
What Fibonacci Time Window plots on the price chart
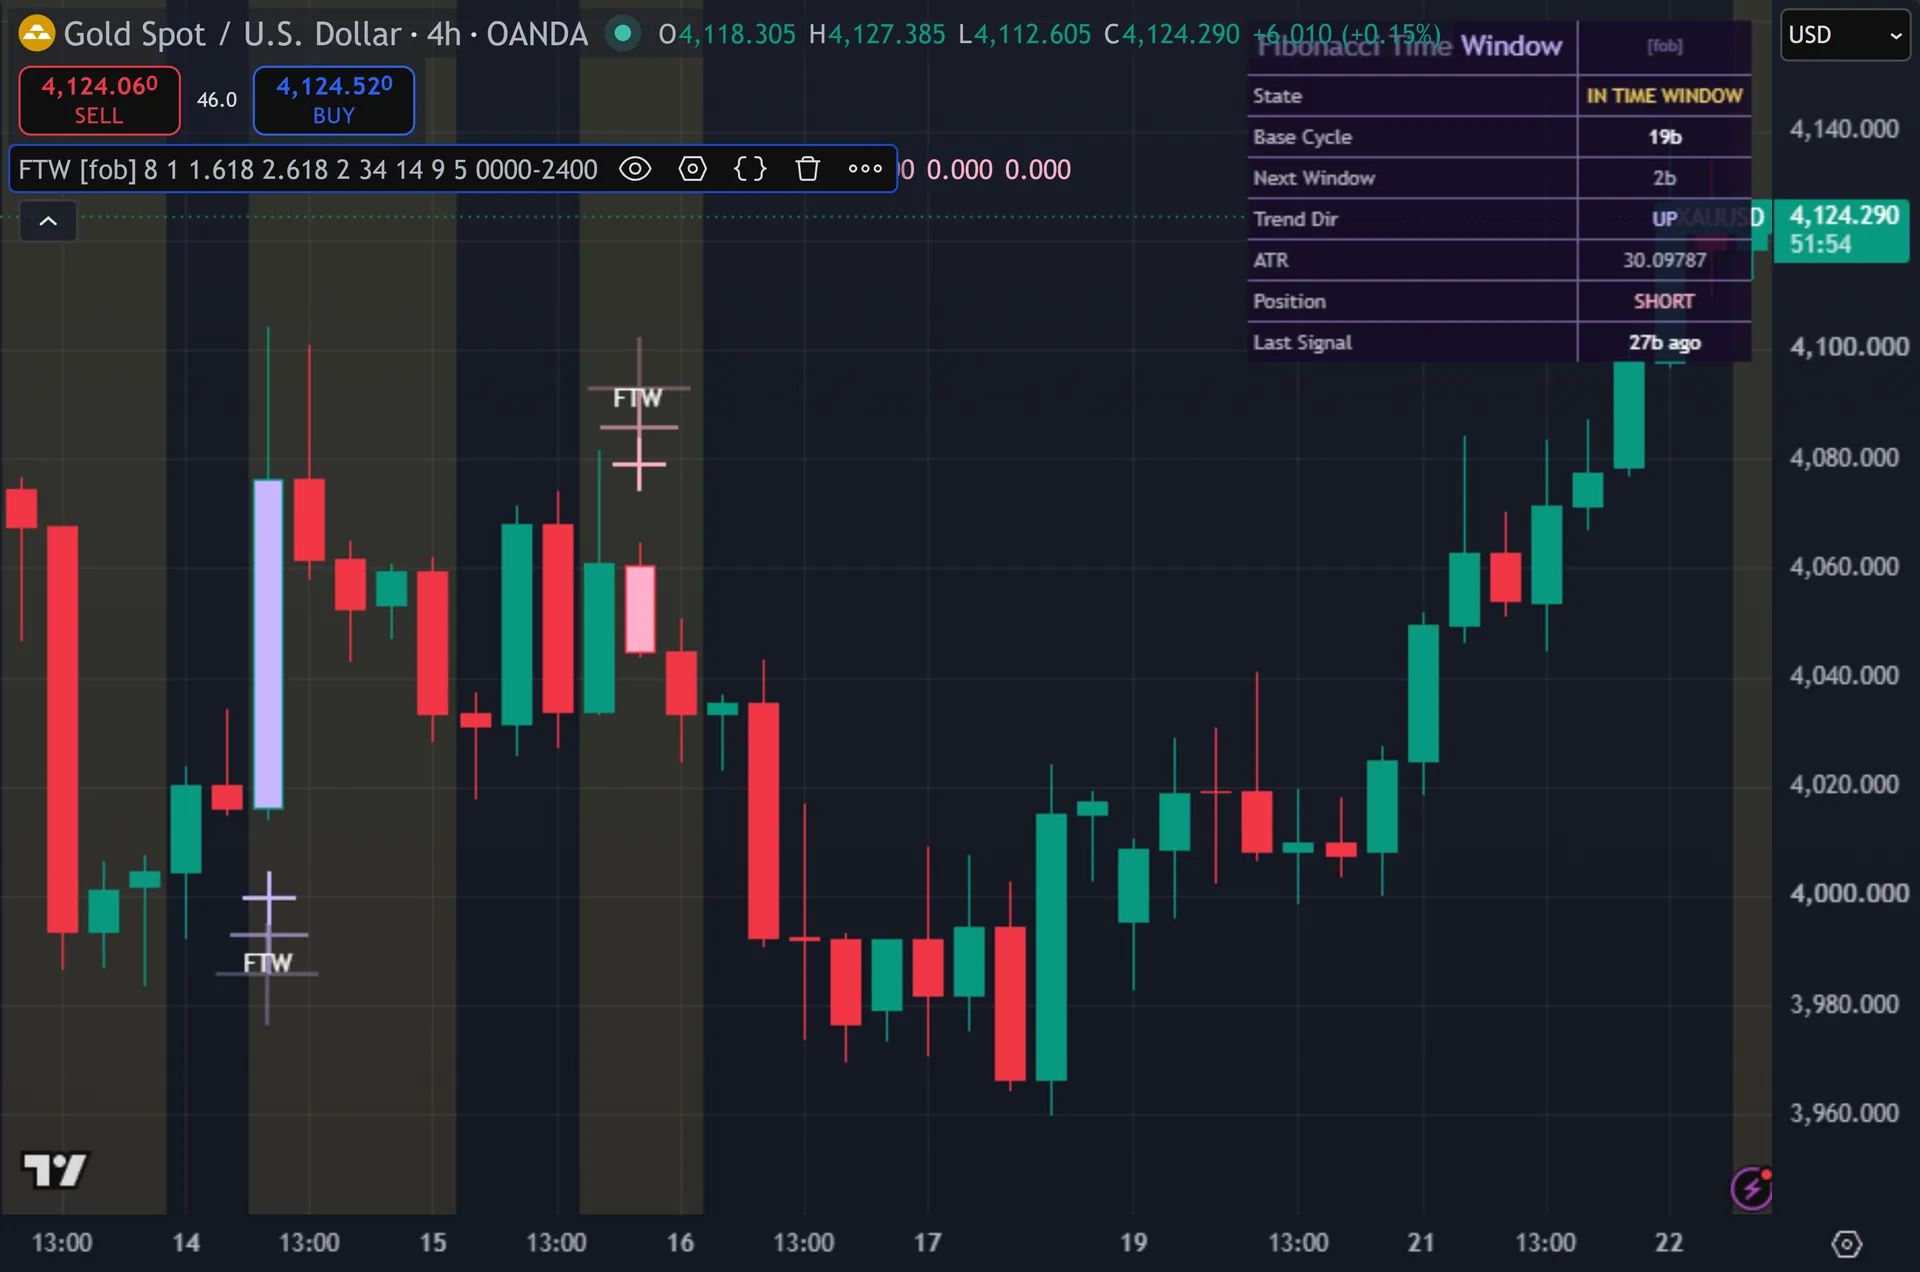
Three dashed vertical lines mark the projected windows. Thus, each stands four ATR tall and sits on its projected bar. The 1.0 line takes the buy colour, the 1.618 line takes gold and the 2.618 line takes the sell colour. Hence, the chart background turns gold whenever price sits inside a window. Cross markers print below and above the bars on entries, tagged FTW, and the signal bar changes colour. Next, an eight-row dashboard lists the state, base cycle length, bars to the next window, trend direction, ATR and position.

How Fibonacci Time Window is built
Finding the base cycle
Everything starts with pivots. Then, the script calls ta.pivothigh and ta.pivotlow with a length of 8 on each side. A swing point therefore confirms only after eight further bars print. Yet, the pivot itself sits at bar_index minus 8, and the script stores that bar number.
When a new pivot confirms, the previously stored pivot becomes the anchor. Truly, the base cycle is simply the bar distance between the two. The script does not care whether both are highs, both are lows or one of each. Plainly, it takes whichever two came last, so on most charts the base cycle measures a half swing, high to low or low to high.
That base cycle then gets multiplied by the three ratios: 1.0, 1.618 and 2.618. Also, each product is added to the pivot bar to give a target bar number. The Window Tolerance input adds two bars of slack on each side, so each window runs five bars wide in practice. Indeed, every new pivot deletes the old three lines and draws a fresh set.
Timing the entry
Sitting inside a window is not a signal. Still, the script also needs a direction and a trigger. A 34-period EMA sets the bias: closes above it read up, closes below read down. Thus, a 9-period EMA supplies the trigger through a close cross.
So a long needs three things at once. Hence, price must sit inside one of the three windows. The close must sit above the 34 EMA. Next, and the close must cross up through the 9 EMA on that bar. A short needs the mirror image. Then, two more gates follow: five bars of cooldown, and barstate.isconfirmed so the bar has closed.
One point deserves care. Yet, the header calls these reversal-time windows, but the entry rule trades with the trend rather than against it. A long fires when price already sits above the 34 EMA and then reclaims the 9 EMA. In practice the tool times continuation entries at Fibonacci bar counts. It does not fade the move.
How to read the signals
Watch the State row first. Truly, WARMING UP means no base cycle exists yet. AWAITING WINDOW means the projections are drawn and price has not reached them. IN TIME WINDOW means the gold background is live, and an entry can fire on the next qualifying cross.
Use the base cycle length as a sanity check. Plainly, a base cycle of 40 bars on a 15-minute chart describes a swing rhythm you can see on screen. A base cycle of 3 bars describes noise, and the windows it projects land almost immediately and mean little.
Treat the window as a filter and the EMA cross as the trigger. Windows narrow when you act. They do not tell you which way to act, and the 34 EMA handles that job. Also, when bias and window disagree, the script simply stays quiet.

Every Fibonacci Time Window setting explained
The script exposes 17 inputs, grouped in the settings panel exactly as shown below. Defaults are the published values.
Time Cycle
| Setting | What it does | Default | Range |
|---|---|---|---|
| Pivot Length | Bars each side to confirm the swing pivots that set the base cycle. | 8 | 2 to 40 |
| Fib Ratio 1 | Sets the fib ratio 1 used in the calculation. | 1.0 | 0.5 to 5.0 |
| Fib Ratio 2 | Sets the fib ratio 2 used in the calculation. | 1.618 | 0.5 to 5.0 |
| Fib Ratio 3 | Sets the fib ratio 3 used in the calculation. | 2.618 | 0.5 to 5.0 |
| Window Tolerance | Bars of slack around each projected time window. | 2 | 0 to 10 |
| Trend EMA | Defines the directional bias inside a time window. | 34 | 5 to 200 |
| ATR Length | Sets the atr length used in the calculation. | 14 | 5 to 50 |
Signal Logic
| Setting | What it does | Default | Range |
|---|---|---|---|
| Entry Reclaim EMA | Inside a time window, a close-cross of this EMA in the trend direction times the entry. | 9 | 2 to 50 |
| Cooldown Bars | Sets the cooldown bars used in the calculation. | 5 | 1 to 40 |
Filters
| Setting | What it does | Default | Range |
|---|---|---|---|
| Restrict to Session | Toggles restrict to session on the chart. | off | on / off |
| Session Window | Controls session window. | 0000-2400 |
Visual
| Setting | What it does | Default | Range |
|---|---|---|---|
| Show Time Windows | Toggles show time windows on the chart. | on | on / off |
| Show Dashboard | Toggles show dashboard on the chart. | on | on / off |
| Show 3-Layer Glow | Toggles show 3-layer glow on the chart. | on | on / off |
| Buy Color | Colour used for buy color. | #c8b6ff | |
| Sell Color | Colour used for sell color. | #ffafcc | |
| Dashboard BG | Colour used for dashboard bg. | color.new(#160a26, 14) |

Alerts built into Fibonacci Time Window
The script ships 15 alert conditions. Indeed, open the alert dialog on the chart, pick the indicator as the condition source, then choose the event you want. Alerts fire on the close of the bar, so they follow the same confirmed-bar rule the on-chart signals use.
- FTW Buy
- FTW Sell
- FTW Any Signal
- FTW Window Open
- FTW Window Close
- FTW Window 1
- FTW Window 1.618
- FTW Window 2.618
- FTW New Pivot Hi
- FTW New Pivot Lo
- FTW EMA Up
- FTW EMA Down
Other markets and timeframes
This one travels well. Still, there is no volume input, no session default and no pip-based distance anywhere in the logic. Pivots count bars, the base cycle counts bars, and both EMAs stay relative to price. Thus, ATR appears only to size the dashed lines and fill a dashboard row. So gold, indices and crypto run on the same defaults. Hence, the input worth revisiting is Pivot Length. Raise it on noisy intraday charts for fewer and cleaner swing points.
Limitations worth knowing
Pivots confirm eight bars late. Next, that is the cost of ta.pivothigh with a length of 8. The projection therefore appears eight bars after the swing that produced it. Then, when the base cycle is short, a projected window can even land on bars that already printed, so a dashed line shows up to the left of the bar that drew it.
Only the latest projection survives. Yet, every new pivot deletes the three lines and redraws them from the new anchor. There is no history of past windows on the chart, and no record of whether earlier windows produced a turn.
It offers no price levels at all. Truly, the tool answers when, never where. There is no stop, no target, no zone and no measure of swing size. Plainly, Fibonacci time projection also remains a discretionary technique with no settled evidence behind it, and the script makes no attempt to validate it.
Get Fibonacci Time Window on TradingView
Open Fibonacci Time Window on TradingView
If you also trade MetaTrader, the MT4 and MT5 indicator library is available below.
Get the complete indicator library
One email unlocks the full MT4 and MT5 indicator library. Also, this TradingView script stays free on TradingView – the button above adds it to your chart.
Using it alongside MetaTrader
Adding a script on TradingView takes one click, so there is no install step here. Indeed, if you want the same idea on MetaTrader, the MT4 and MT5 indicator installation guide walks through copying files into the data folder and attaching them to a chart. You can also browse the full MetaTrader indicator library, the MT4 indicators section, or the other free TradingView scripts published on this profile. For related chart tools see the MT5 indicators section and the forex trading strategies guides.
External references
- Candlestick pattern on Wikipedia
- Pivot Point at Investopedia
- Candlestick Charts at StockCharts ChartSchool
Frequently asked questions
Does Fibonacci Time Window repaint?
Signals do not. Still, entries gate on barstate.isconfirmed, so a cross marker prints only after the bar closes. The projected lines work differently. Thus, each new confirmed pivot deletes the previous three lines and draws a new set, so the windows on screen always reflect the most recent pivot pair.
How far ahead does it project?
Three windows from the last pivot, at 1.0, 1.618 and 2.618 times the base cycle. Hence, with a 30-bar base cycle those land roughly 30, 49 and 79 bars ahead. Each window carries two bars of tolerance on each side.
Why did price enter a window with no signal?
A window alone fires nothing. Next, the close must also sit on the correct side of the 34 EMA and cross the 9 EMA on that bar. Add the five-bar cooldown and the closed-bar rule, and most window visits pass without a marker.
Can I change the ratios?
Yes. Then, all three ratios are inputs and each accepts a value from 0.5 to 5.0. Some traders swap 2.618 for 4.236, or set the first ratio to 0.618 to get an earlier window.
How much should I rely on this indicator?
Treat it as one input, not a decision. Yet, it is a chart analysis tool, not trading advice. Test it on your own markets and timeframes before relying on it. Results are not guaranteed; past performance is not indicative of future results.

About the author
Written by Dominic Walsh, a Forex trader and MT4/MT5 indicator, Expert Advisor and script developer. Every tool on forexmt4systems.com is tested on live charts before release and ships with ready-to-use compiled MT4 (.ex4) and MT5 (.ex5) files. Learn more about the trader and developer behind this site.
How we build, test and correct every tool: Editorial & Testing Policy. Trading carries risk; see the disclaimer.