
Most cycle tools smooth price and hope a wave appears. Also, fourier Phase Rotation works from the maths instead. This market cycle indicator TradingView traders can run on any chart first strips out a 20-period SMA, then projects the last four detrended closes onto a sine and a cosine. Indeed, that gives one number – a phase angle in radians. When the angle flips sign and the prevailing bias agrees, the script prints an arrow.
It is free and open source. Still, you can add it to any chart from the Fourier Phase Rotation script page on TradingView, and the full Pine source is published there for you to read.
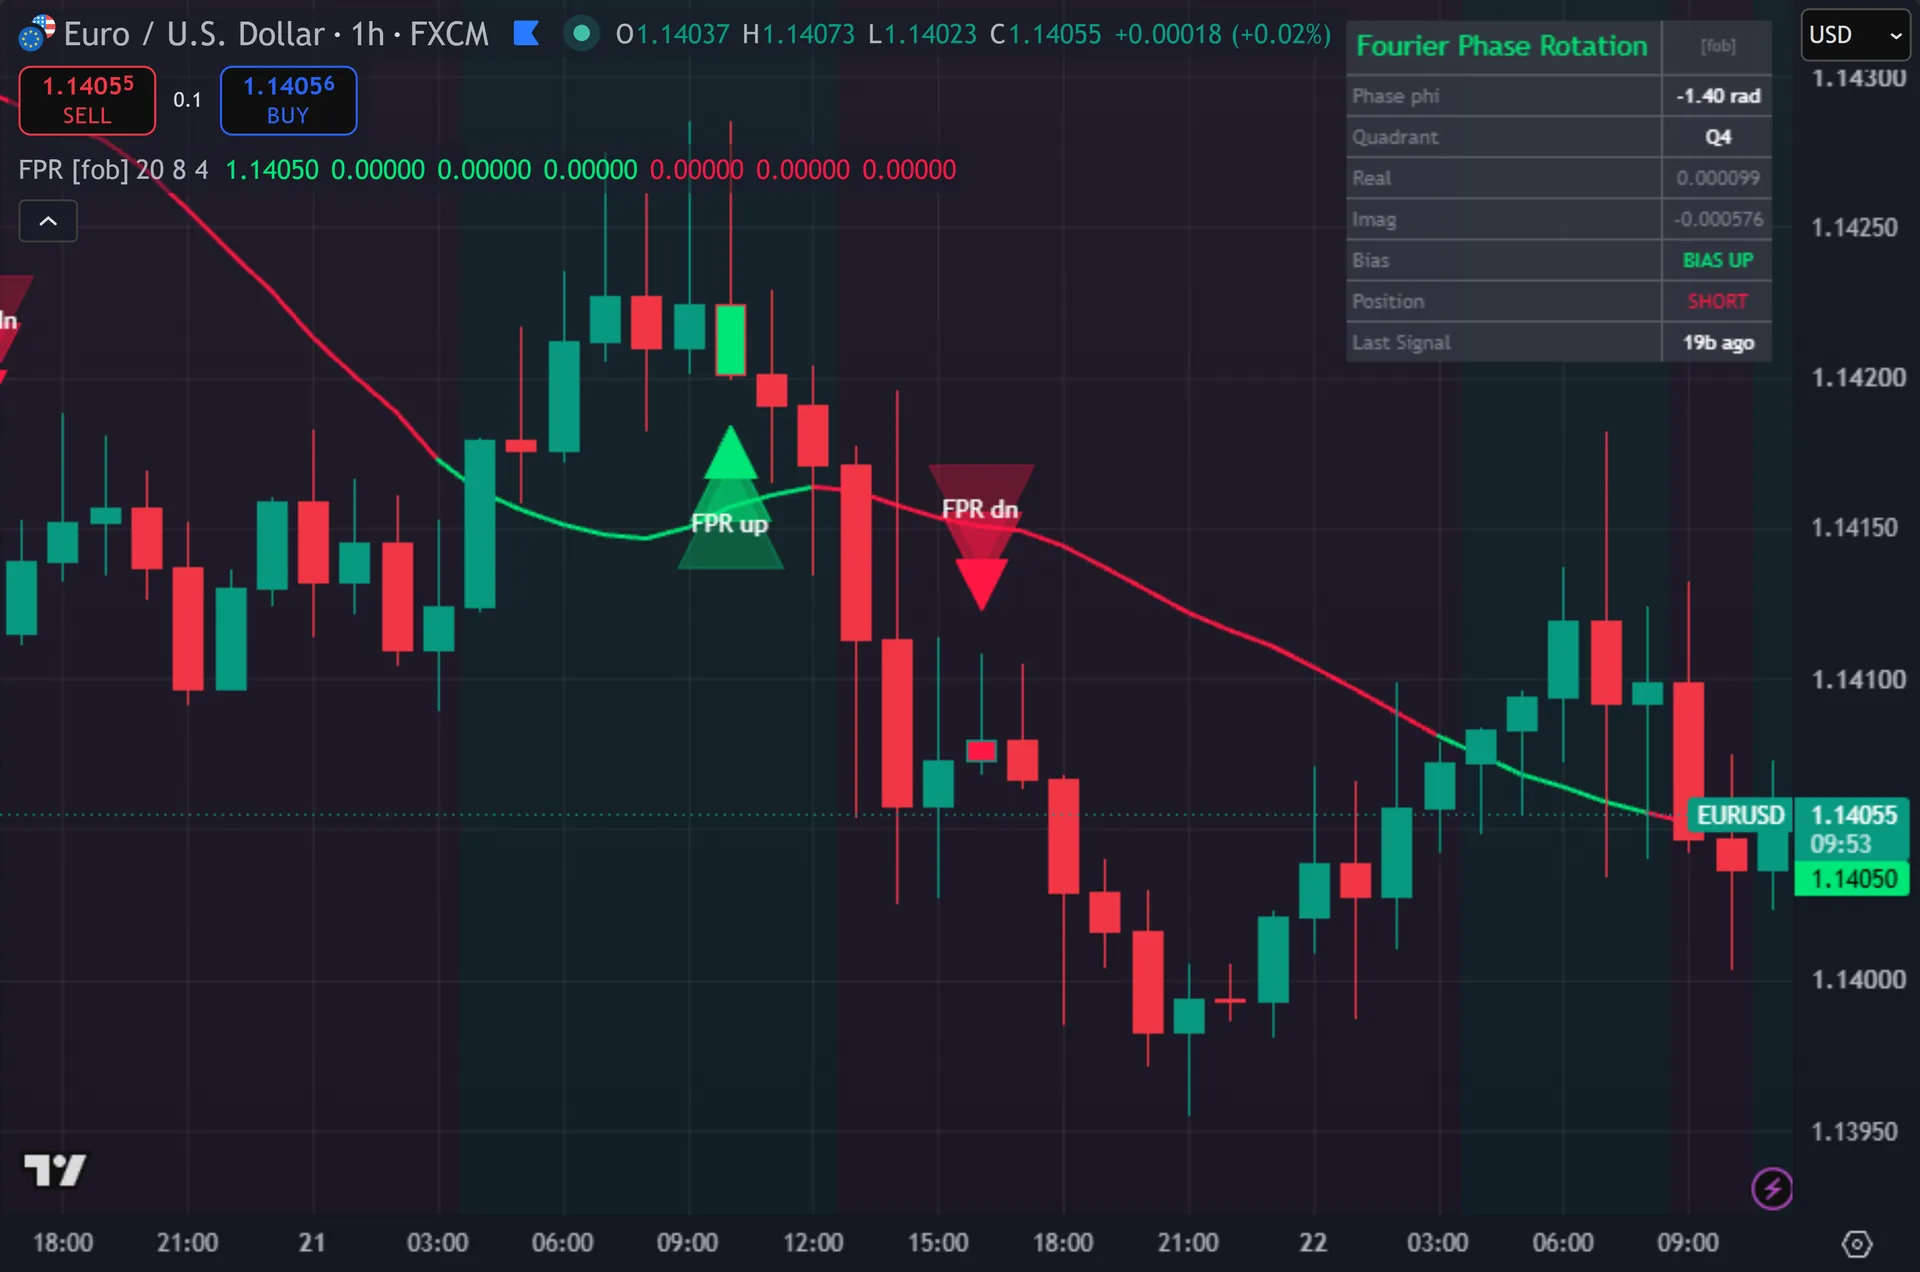
What Fourier Phase Rotation plots on the price chart
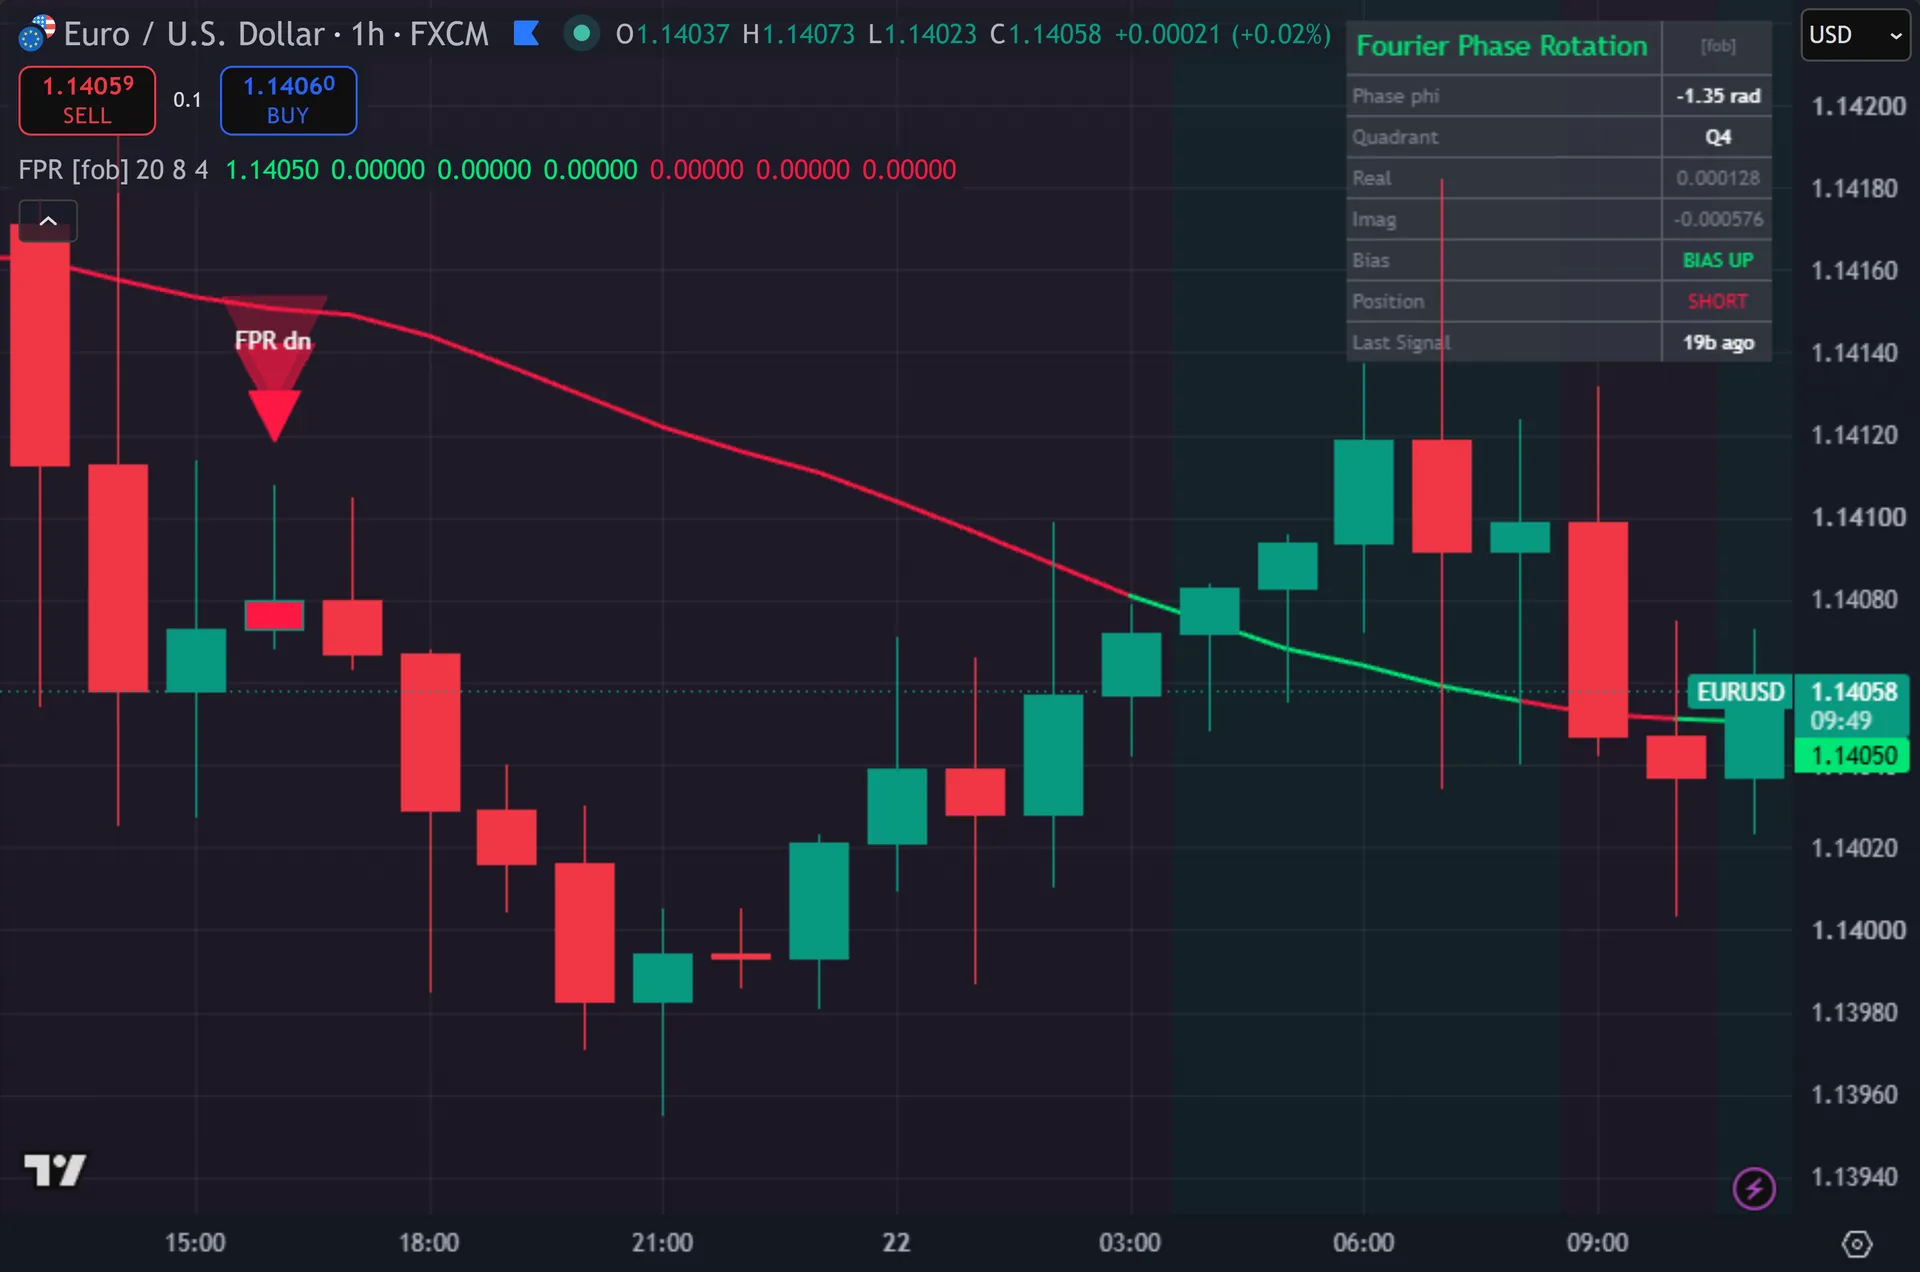
The script draws the 20-period detrend SMA directly on price. Thus, it paints the line green while close sits above it and red while close sits below. Signal bars carry stacked triangles, three layers per side for a glow effect, tagged FPR up beneath the bar or FPR dn above it. Hence, the signal bar itself gets recoloured. A faint background tint marks the current bias across the whole chart. Next, top right, an eight-row dashboard reads the phase angle in radians, the quadrant, the raw real and imaginary parts, bias, position state and bars since the last signal.
How Fourier Phase Rotation is built
Detrend first, then project
The script subtracts a 20-period SMA from close. Then, what remains is the oscillation around trend. Any Fourier projection needs a roughly zero-mean series, because raw price drift would swamp the calculation. Yet, you can set that SMA anywhere from 5 to 100 bars.
It then grabs four values: the detrended close now, and the same figure one, two and three bars back. Truly, a four-point discrete Fourier transform at bin one needs only two subtractions. The real part equals value zero minus value two. Plainly, the imaginary part equals value one minus value three. Divide the imaginary part by the real part, take the arctangent, and you hold phi – the instantaneous phase of that four-bar wave.
Be clear about the scope here. Also, four samples make a very short window. The script computes one frequency bin, not a spectrum. Indeed, it never estimates a dominant cycle length and it applies no window function. So treat it as a phase tracker on a fixed four-bar wave, not as full spectral analysis. Still, the upside of that choice is speed and zero filter lag, since no recursive smoother sits in the chain.
From phase flip to arrow
A candidate signal starts with a zero-cross of phi. Thus, an up-cross needs phi negative on the previous bar and zero or above now. A down-cross needs the reverse. Because phi is the arctangent of a ratio, that zero-cross simply means the ratio changed sign. Either the real part flipped or the imaginary part did.
Three filters then decide whether the cross becomes an arrow. Hence, bias must agree, so buys need close above the detrend SMA and sells need close below it. The internal position state must not already sit long for a buy, or short for a sell. Next, and the cooldown, four bars by default, must have elapsed since the previous mark.
The final gate is barstate.isconfirmed. Then, both the triangles and the alerts sit behind it, so nothing flashes up and disappears mid-candle. One quirk worth knowing: the script uses a plain arctangent, which returns values strictly between -1.5708 and +1.5708 radians. Yet, the dashboard quadrant cell therefore only ever shows Q1 or Q4. Q2 and Q3 are unreachable by construction.
How to read the signals
Read the SMA colour before the arrow. Truly, the line tells you which side the script will accept, because the bias filter blocks every counter-side cross. A run of red with no marks simply means no downward phase flip has landed yet.
Use the dashboard to see how close a flip sits. Plainly, the phase angle moves toward zero as the four-bar wave completes. The real and imaginary rows show which part is shrinking. Also, when both hover near zero, the reading turns noisy and the next cross carries little weight.
Signals need a closed bar, so an arrow lands at the open of the following candle. Indeed, that keeps the historical chart honest – what you see now matches what you would have seen live. It also means you act one bar after the phase turned, so let your stop allow for that bar’s range.
Every Fourier Phase Rotation setting explained
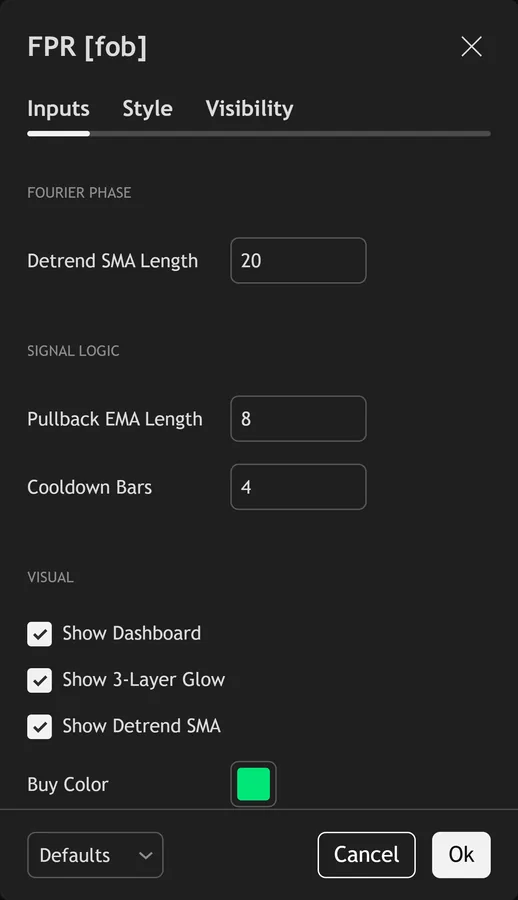
The script exposes 8 inputs, grouped in the settings panel exactly as shown below. Defaults are the published values.
Fourier Phase
| Setting | What it does | Default | Range |
|---|---|---|---|
| Detrend SMA Length | Sets the detrend sma length used in the calculation. | 20 | 5 to 100 |
Signal Logic
| Setting | What it does | Default | Range |
|---|---|---|---|
| Pullback EMA Length | Sets the pullback ema length used in the calculation. | 8 | 3 to 50 |
| Cooldown Bars | Sets the cooldown bars used in the calculation. | 4 | 1 to 20 |
Visual
| Setting | What it does | Default | Range |
|---|---|---|---|
| Show Dashboard | Toggles show dashboard on the chart. | on | on / off |
| Show 3-Layer Glow | Toggles show 3-layer glow on the chart. | on | on / off |
| Show Detrend SMA | Toggles show detrend sma on the chart. | on | on / off |
| Buy Color | Colour used for buy color. | #00e676 | |
| Sell Color | Colour used for sell color. | #ff1744 |
Alerts built into Fourier Phase Rotation
The script ships 11 alert conditions. Still, open the alert dialog on the chart, pick the indicator as the condition source, then choose the event you want. Alerts fire on the close of the bar, so they follow the same confirmed-bar rule the on-chart signals use.
- FPR Buy
- FPR Sell
- FPR Any Signal
- FPR Phase Up
- FPR Phase Down
- FPR Bias Up
- FPR Bias Down
- FPR Near Pi
- FPR Webhook JSON
Other markets and timeframes
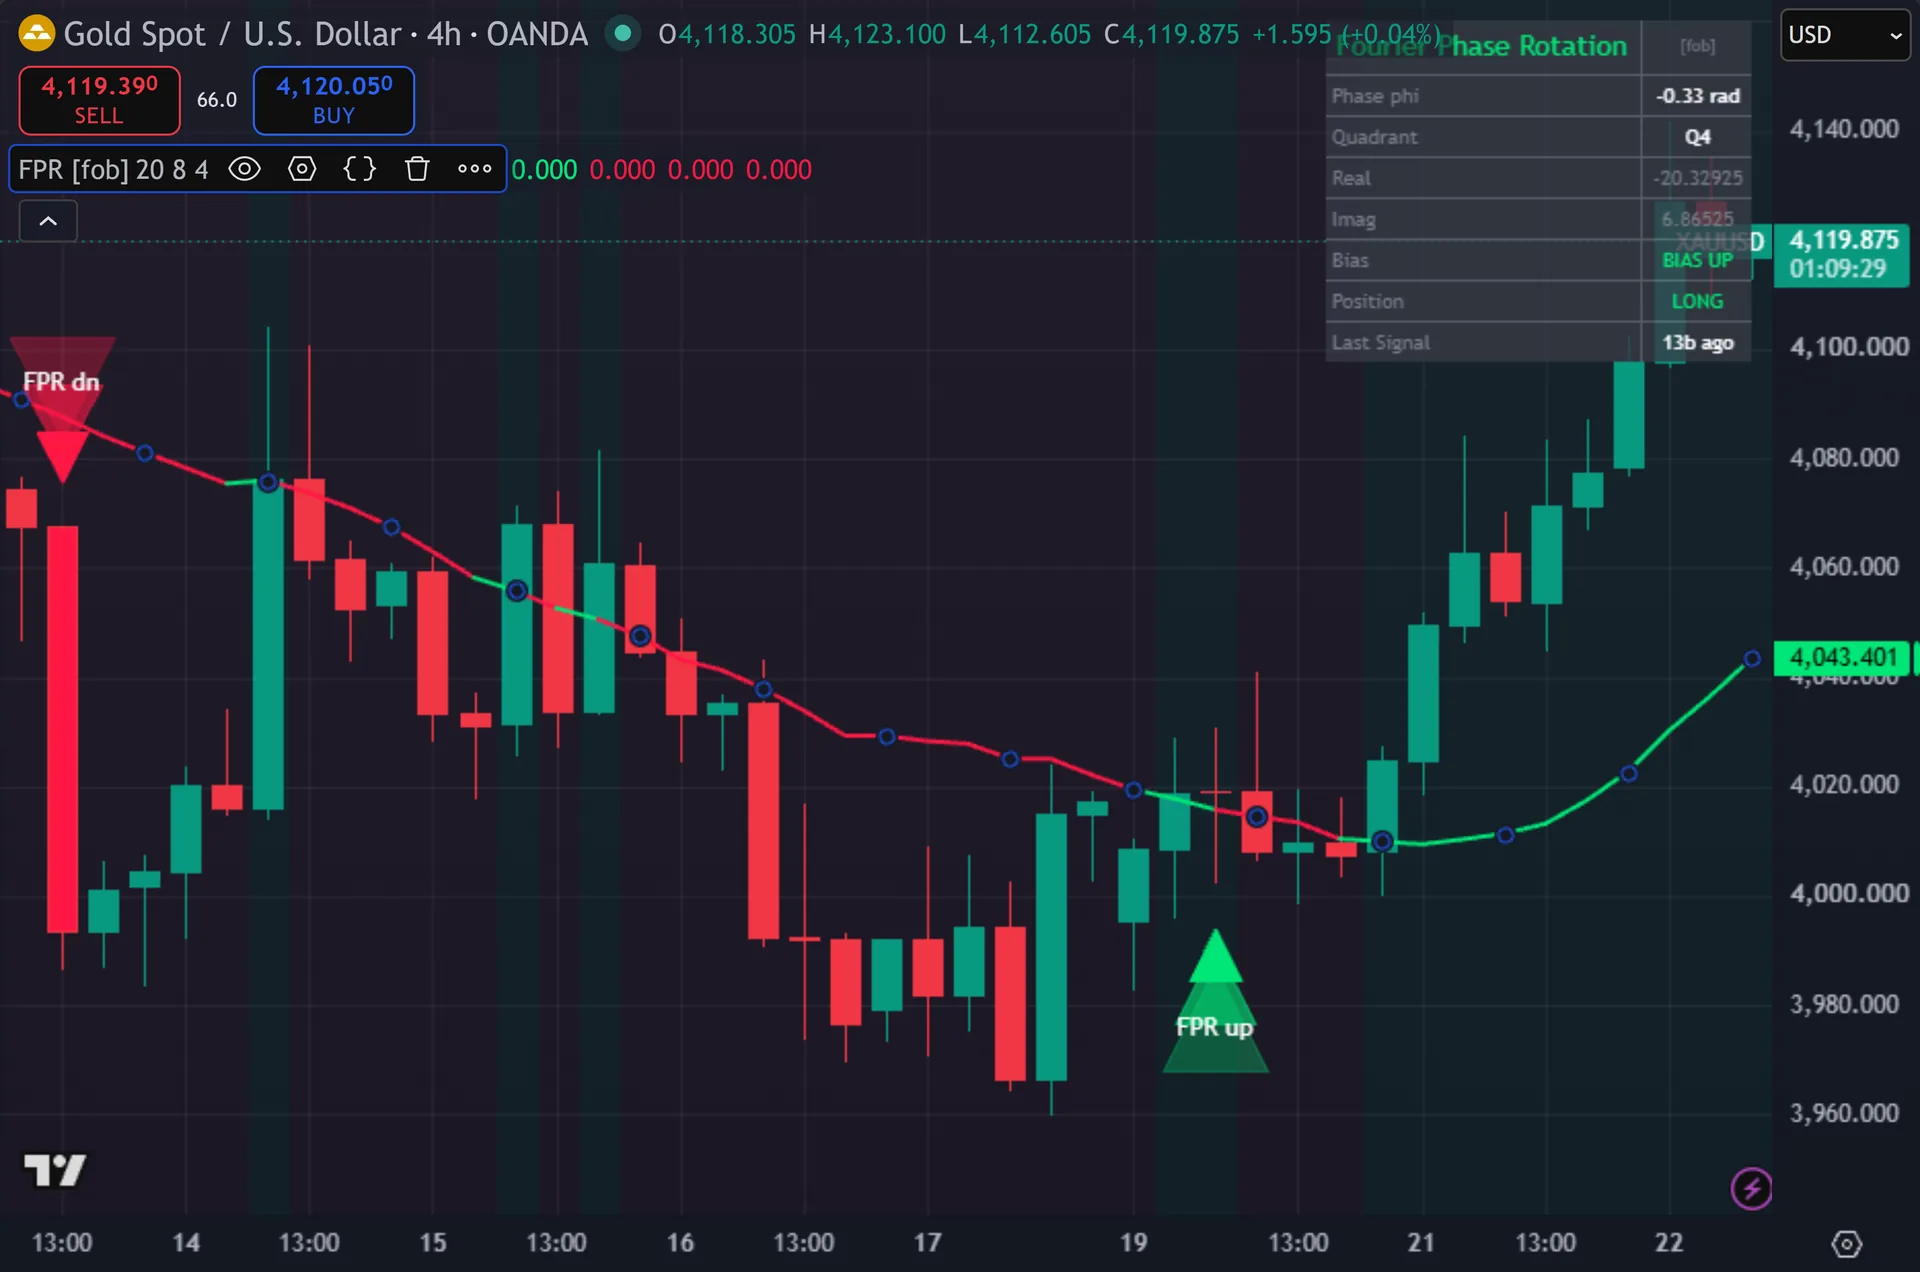
Nothing here ties to forex. Thus, the detrend step removes price level, and the phase angle is a ratio of two differences, so it carries no units at all. The same defaults work on gold, indices, crypto and equities with no retuning. Hence, volume never enters the calculation, which helps on instruments with thin or missing volume feeds. The one input worth revisiting per market is the cooldown, since a fast intraday chart produces far more phase crossings than a daily one.
Limitations worth knowing
This marks a turn in a short oscillation. Next, it is not a trading system. It sets no stop, no target and no size. Then, a four-bar window also reacts to noise, so choppy ranges produce crossings that lead nowhere, and the four-bar cooldown only thins them out rather than removing them.
Two cosmetic points deserve honesty. Yet, the Pullback EMA Length input builds an EMA that the signal logic never reads, so changing it does nothing to the arrows. And the background bias tint updates while the bar is still forming, unlike the arrows, which wait for the close.
The script measures phase only. Truly, it reports no cycle length, no amplitude and no confidence figure, so it cannot tell you whether a real cycle exists in the current regime. A trending market produces a detrended series with a strong drift component, and phase readings there mean much less than they do in a rotation.
Get Fourier Phase Rotation on TradingView
Open Fourier Phase Rotation on TradingView
If you also trade MetaTrader, the MT4 and MT5 indicator library is available below.
Get the complete indicator library
One email unlocks the full MT4 and MT5 indicator library. Plainly, this TradingView script stays free on TradingView – the button above adds it to your chart.
Using it alongside MetaTrader
Adding a script on TradingView takes one click, so there is no install step here. Also, if you want the same idea on MetaTrader, the MT4 and MT5 indicator installation guide walks through copying files into the data folder and attaching them to a chart. You can also browse the full MetaTrader indicator library, the MT4 indicators section, or the other free TradingView scripts published on this profile. For related chart tools see the MT5 indicators section and the forex trading strategies guides.
External references
- Breadth of market on Wikipedia
- Marketorder at Investopedia
- Stock Market Cycles at StockCharts ChartSchool
Frequently asked questions
Does Fourier Phase Rotation repaint?
No. Indeed, every arrow and every alert gates on barstate.isconfirmed, so a mark appears only once that bar has closed. The background bias tint does update live, but it is context shading rather than a signal.
Is this a real Fourier transform?
It is one bin of a four-point discrete Fourier transform, computed as two subtractions on the detrended close. Still, that is genuine, but it is a single frequency on a four-sample window. It does not decompose price into a spectrum or estimate a dominant cycle period.
Why does the dashboard never show Q2 or Q3?
The script takes a plain arctangent of the imaginary part over the real part. Thus, that function only returns angles between -1.5708 and +1.5708 radians. Half the circle is therefore unreachable, so the quadrant cell reads Q1 or Q4.
Which timeframe suits it best?
Any of them, since every step stays relative. Hence, higher timeframes give fewer and weightier marks. On very fast charts, raise the cooldown above four bars and lengthen the detrend SMA so the wave you track is not pure noise.
How much should I rely on this indicator?
Treat it as one input, not a decision. Next, it is a chart analysis tool, not trading advice. Test it on your own markets and timeframes before relying on it. Results are not guaranteed; past performance is not indicative of future results.

About the author
Written by Dominic Walsh, a Forex trader and MT4/MT5 indicator, Expert Advisor and script developer. Every tool on forexmt4systems.com is tested on live charts before release and ships with ready-to-use compiled MT4 (.ex4) and MT5 (.ex5) files. Learn more about the trader and developer behind this site.
How we build, test and correct every tool: Editorial & Testing Policy. Trading carries risk; see the disclaimer.