
A clean ABC leg is a measurement, not a feeling. Also, fractal Symmetry Detector is an ABC pattern indicator TradingView traders can use to grade that measurement. It reads the last three alternating pivots, divides the BC leg by the AB leg, and checks the result against 38.2, 50, 61.8 and 78.6 percent. Indeed, setups inside a tolerance of 0.08 get a symmetry score and two projected targets.
It is free and open source. Still, you can add it to any chart from the Fractal Symmetry Detector script page on TradingView, and the full Pine source is published there for you to read.
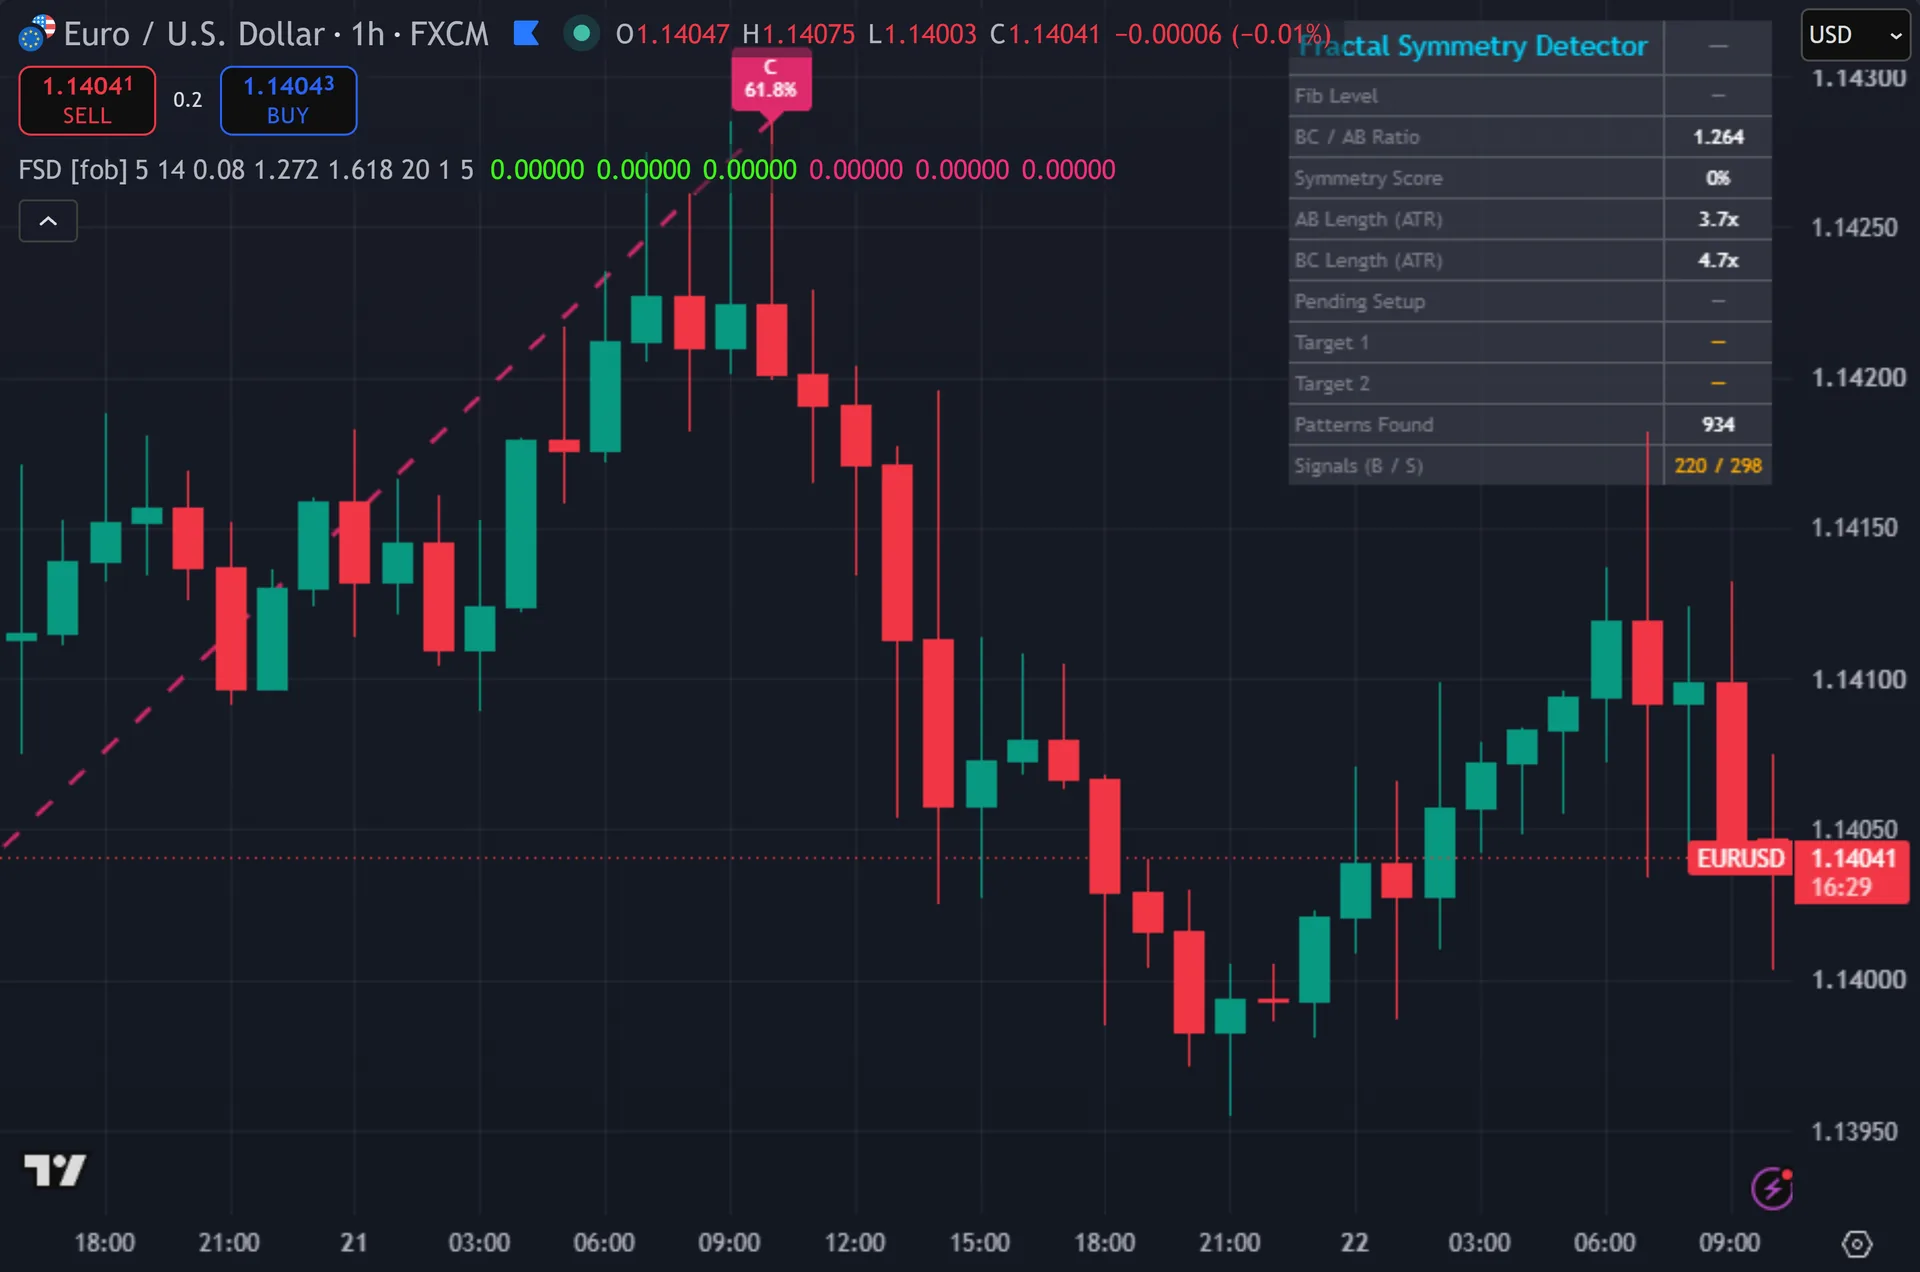
What Fractal Symmetry Detector plots on the price chart
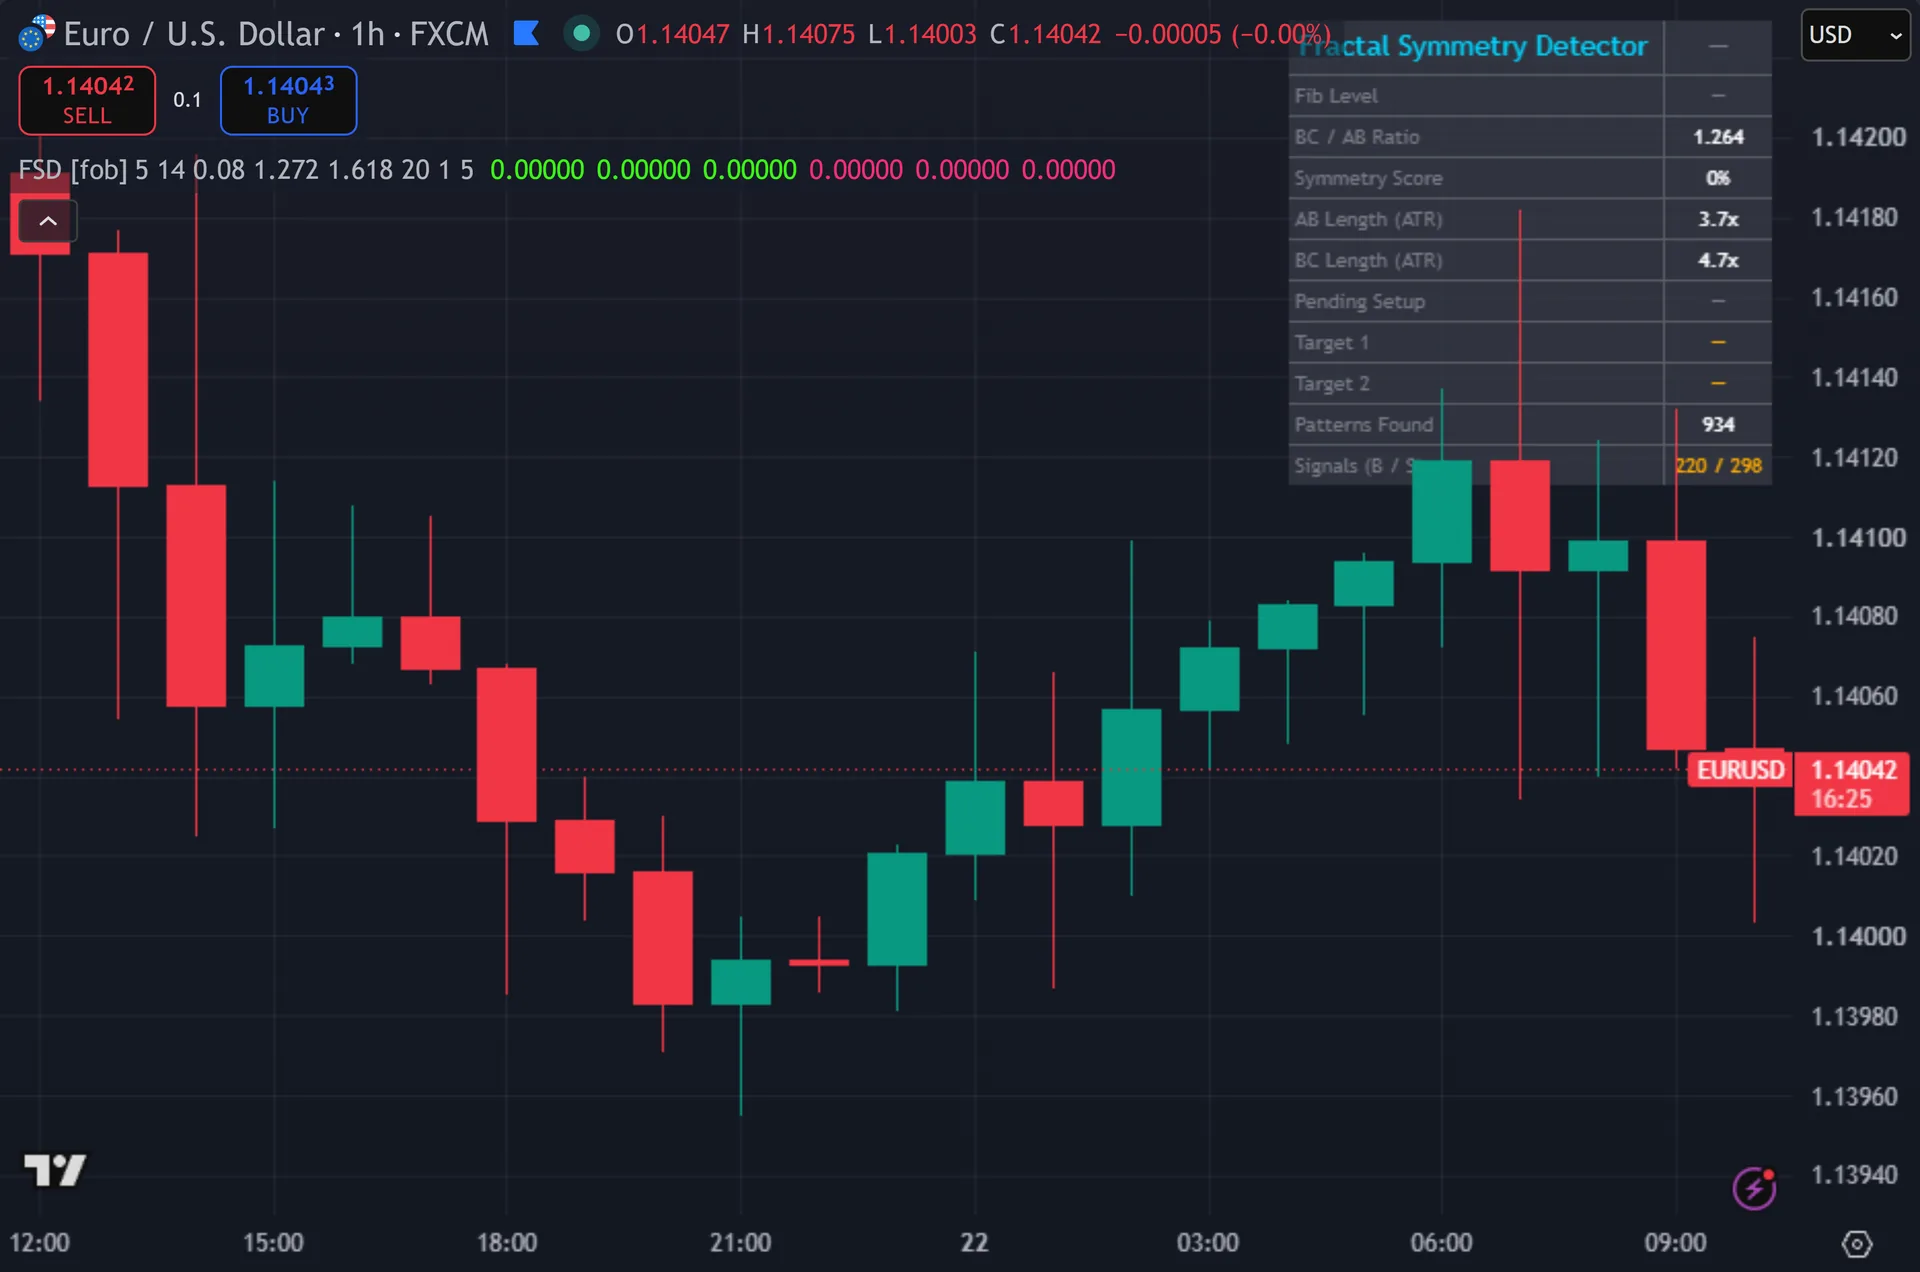
The script draws the pattern as two lines: a solid AB leg and a dashed BC leg, green for bullish and pink for bearish. Thus, a label sits at C with the matched Fibonacci level. Signals print as stacked triangles with an ABC tag, plus a context label carrying the retrace level and the first target. Hence, two dotted projection lines run 30 bars forward to T1 and T2. The dashboard lists pattern direction, the matched level, the raw BC over AB ratio, the symmetry score, both leg lengths in ATR, any pending setup, both targets and running counts.
How Fractal Symmetry Detector is built
Finding A, B and C
Pivot detection uses ta.pivothigh and ta.pivotlow with a length of 5 on both sides. Next, a pivot therefore confirms five bars after the bar that made it. The design accepts that lag and the script does not hide it – the C label lands five bars to the left of where it appears.
The script keeps a buffer of alternating pivots, capped at five entries. Then, if a new pivot matches the direction of the last one, it replaces that entry only when it runs more extreme – a higher high or a lower low. Otherwise the new pivot joins the sequence. Yet, the last three entries become A, B and C.
Direction comes from the pivot types. Truly, a low, then a high, then a low reads as a bullish continuation setup, with C as the pullback. A high, then a low, then a high reads bearish. Plainly, the script discards any sequence that fails to alternate.
Scoring and firing
AB is the absolute distance from A to B. Also, BC is the absolute distance from B to C. Dividing BC by AB gives the retrace ratio. Indeed, the script tests that ratio against four levels – 0.382, 0.5, 0.618 and 0.786 – with a tolerance of 0.08 either side. All four stay enabled by default, and because the 0.5 and 0.618 windows overlap, a ratio in the overlap reports as 61.8 percent.
The symmetry score converts the miss into a percentage. Still, it takes the distance from the matched level, divides by the tolerance, then subtracts from one. A ratio of exactly 0.618 scores 100. Thus, a ratio 0.04 away scores 50. The score grades geometric tidiness only.
Targets project from C using the AB length rather than the BC length. Hence, t1 sits at 1.272 times AB beyond C, and T2 at 1.618 times AB. You can edit both multipliers.
Four gates guard a signal: volume at or above its 20-bar average, a reversal candle at C that closes past the bar midpoint, a 5-bar cooldown, and a confirmed bar. Next, if the pattern completes but a gate blocks it, the script holds the setup pending for up to five bars and fires as soon as the gates clear.
How to read the signals
Take the symmetry score and the Fibonacci level together. Then, a 61.8 percent retrace scoring 95 is a tight, textbook pullback. A 38.2 percent match scoring 55 sits near the edge of the tolerance band and describes a much looser shape.
The AB and BC lengths in ATR give you scale. Yet, two legs measuring 4x and 2.5x ATR describe a real swing. The same ratio built from legs under 1x ATR is noise with good geometry, and the ratio alone would not tell you the difference.
Watch the Pending Setup row. Truly, it means the pattern completed but a gate blocked the entry, usually thin volume or a candle at C that closed the wrong way. The row clears after five bars if nothing triggers, which tells you the setup lapsed rather than fired.
Every Fractal Symmetry Detector setting explained
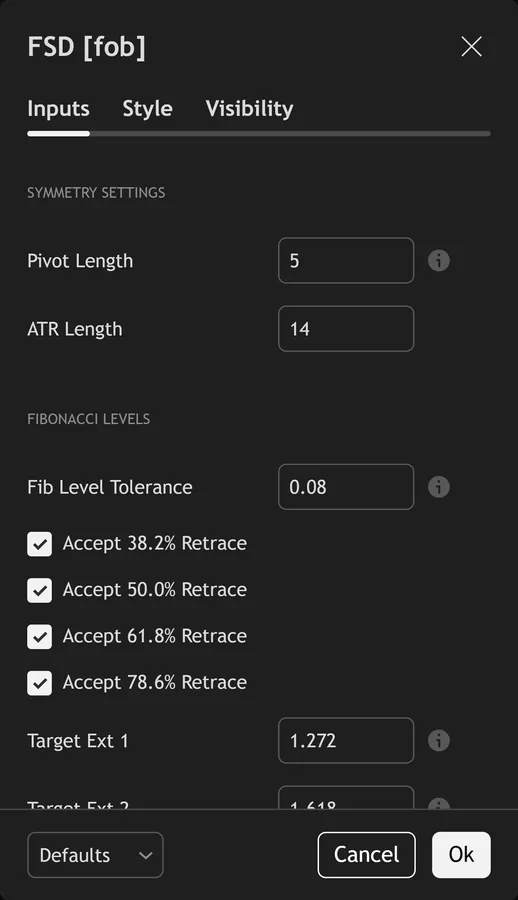
The script exposes 19 inputs, grouped in the settings panel exactly as shown below. Defaults are the published values.
Symmetry Settings
| Setting | What it does | Default | Range |
|---|---|---|---|
| Pivot Length | Lookback for swing high/low detection | 5 | 2 to 15 |
| ATR Length | Sets the atr length used in the calculation. | 14 | 5 to 50 |
Fibonacci Levels
| Setting | What it does | Default | Range |
|---|---|---|---|
| Fib Level Tolerance | Acceptable deviation from a Fib level (fraction) | 0.08 | 0.02 to 0.2 |
| Accept 38.2% Retrace | Toggles accept 38.2% retrace on the chart. | on | on / off |
| Accept 50.0% Retrace | Toggles accept 50.0% retrace on the chart. | on | on / off |
| Accept 61.8% Retrace | Toggles accept 61.8% retrace on the chart. | on | on / off |
| Accept 78.6% Retrace | Toggles accept 78.6% retrace on the chart. | on | on / off |
| Target Ext 1 | First CD projection | 1.272 | 1.0 to 2.0 |
| Target Ext 2 | Second CD projection | 1.618 | 1.0 to 3.0 |
Signal Settings
| Setting | What it does | Default | Range |
|---|---|---|---|
| Volume SMA Length | Sets the volume sma length used in the calculation. | 20 | 5 to 100 |
| Volume Confirm Multiplier | Sets the volume confirm multiplier used in the calculation. | 1.0 | 0.5 to 3.0 |
| Signal Cooldown Bars | Sets the signal cooldown bars used in the calculation. | 5 | 1 to 30 |
| Require Reversal Candle at C | C bar must close in reversal direction | on | on / off |
Visual Settings
| Setting | What it does | Default | Range |
|---|---|---|---|
| Show Dashboard | Toggles show dashboard on the chart. | on | on / off |
| Show ABC Pattern Lines | Toggles show abc pattern lines on the chart. | on | on / off |
| Show CD Target Projections | Toggles show cd target projections on the chart. | on | on / off |
| Show 3-Layer Signal Glow | Toggles show 3-layer signal glow on the chart. | on | on / off |
| Buy Color | Colour used for buy color. | #39ff14 | |
| Sell Color | Colour used for sell color. | #ff2d78 |
Alerts built into Fractal Symmetry Detector
The script ships 11 alert conditions. Plainly, open the alert dialog on the chart, pick the indicator as the condition source, then choose the event you want. Alerts fire on the close of the bar, so they follow the same confirmed-bar rule the on-chart signals use.
- FSD Buy ABC
- FSD Sell ABC
- FSD Any Signal
- FSD Pattern Complete
- FSD Golden Fib
- FSD Bull Setup Pending
- FSD Bear Setup Pending
- FSD Perfect Symmetry
- FSD Webhook JSON
Other markets and timeframes
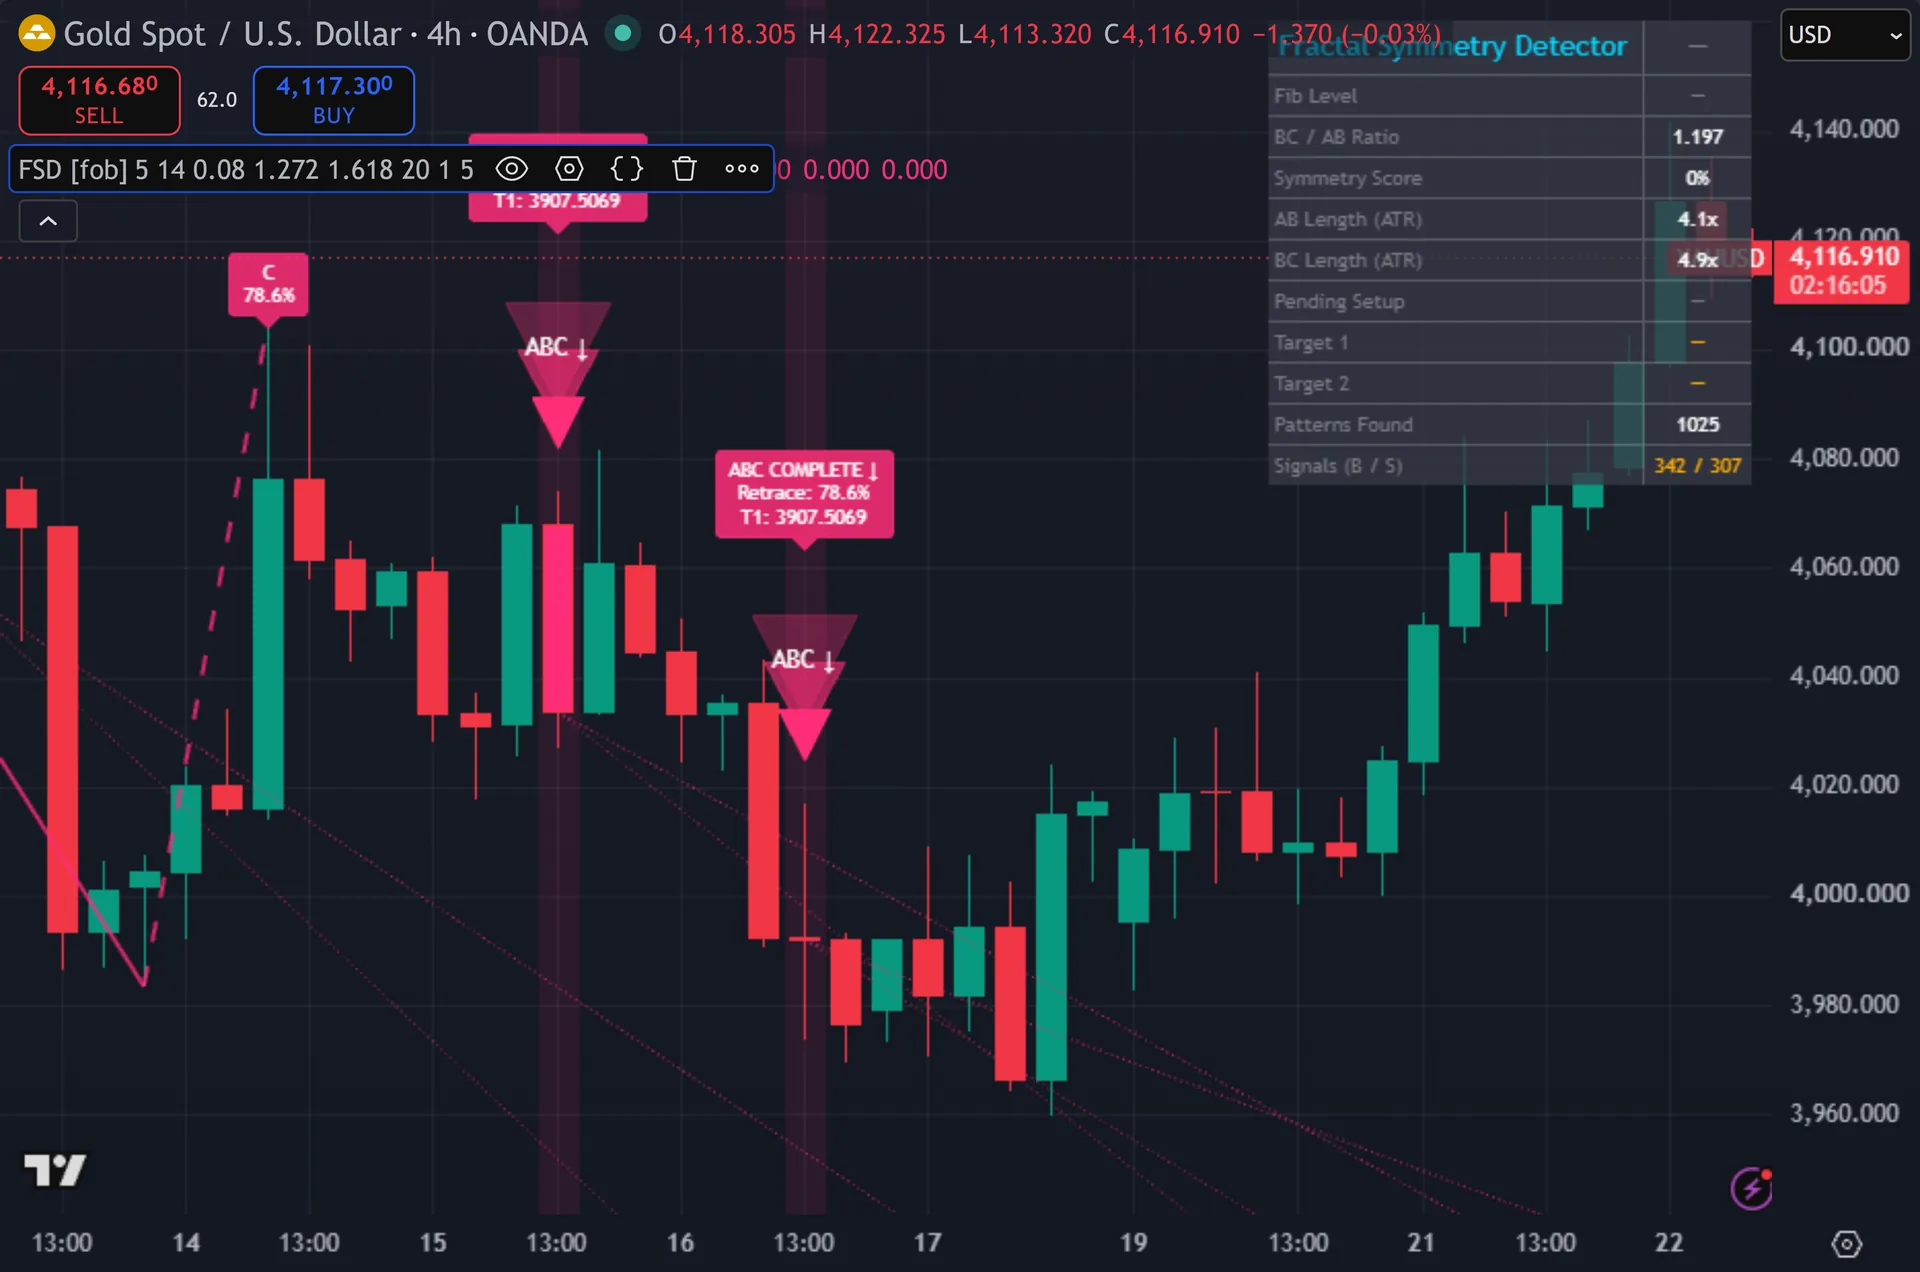
The pattern maths is pure geometry. Also, ratios between legs carry no currency or tick size, so 61.8 percent means the same thing on EURUSD, gold, an index or a stock. Leg lengths report in ATR multiples for the same reason. Indeed, one input does depend on the instrument: the volume filter, which compares volume to its own 20-bar average. Spot forex volume comes from broker tick counts, and symbols with no volume feed will block every signal.
Limitations worth knowing
Confirmation lags by design. Still, pivot length 5 means the script only recognises C five bars after it printed, and a signal can arrive later still if the setup waits in the pending state. Price has often moved well off C by the time a triangle appears, so entries at the C price are usually gone.
Only the last three alternating pivots matter. Thus, the script holds no library of harmonic shapes, applies no trend filter, and reads no higher timeframe. A textbook ratio can print against the dominant direction, and nothing here flags that.
The targets are projections, not forecasts. Hence, t1 and T2 come straight from the AB length multiplied by 1.272 and 1.618. The script never checks whether price reached them, and the dashboard counts patterns and signals only.
Get Fractal Symmetry Detector on TradingView
Open Fractal Symmetry Detector on TradingView
If you also trade MetaTrader, the MT4 and MT5 indicator library is available below.
Get the complete indicator library
One email unlocks the full MT4 and MT5 indicator library. Next, this TradingView script stays free on TradingView – the button above adds it to your chart.
Using it alongside MetaTrader
Adding a script on TradingView takes one click, so there is no install step here. Then, if you want the same idea on MetaTrader, the MT4 and MT5 indicator installation guide walks through copying files into the data folder and attaching them to a chart. You can also browse the full MetaTrader indicator library, the MT4 indicators section, or the other free TradingView scripts published on this profile. For related chart tools see the MT5 indicators section and the forex trading strategies guides.
External references
- Chart pattern on Wikipedia
- Fibonacci Retracement at Investopedia
- Fibonacci Arcs at StockCharts ChartSchool
Frequently asked questions
Does the Fractal Symmetry Detector repaint?
Signals do not, because every trigger requires barstate.isconfirmed. Yet, the pivots behind them still need five bars on each side to confirm, so a C point appears on the chart five bars after the bar that formed it. That lag is inherent to pivot detection, not a repaint.
Which Fibonacci retrace levels does it accept?
38.2, 50, 61.8 and 78.6 percent, all enabled by default, each with a tolerance of 0.08 on the BC over AB ratio. Truly, you can switch any of them off in the Fibonacci Levels group to narrow what qualifies.
What does the symmetry score actually measure?
How close the ratio sits to the matched level, expressed against the tolerance. Plainly, an exact hit scores 100, and a ratio right on the edge of the band scores near zero. It grades shape only and says nothing about what price does next.
Why does the dashboard show a pending setup with no arrow?
A gate blocked the entry. Also, volume sat under its 20-bar average, the candle at C closed on the wrong side of its midpoint, or the 5-bar cooldown had not elapsed. The script waits up to five bars for those gates to clear before dropping the setup.
How much should I rely on this indicator?
Treat it as one input, not a decision. Indeed, it is a chart analysis tool, not trading advice. Test it on your own markets and timeframes before relying on it. Results are not guaranteed; past performance is not indicative of future results.

About the author
Written by Dominic Walsh, a Forex trader and MT4/MT5 indicator, Expert Advisor and script developer. Every tool on forexmt4systems.com is tested on live charts before release and ships with ready-to-use compiled MT4 (.ex4) and MT5 (.ex5) files. Learn more about the trader and developer behind this site.
How we build, test and correct every tool: Editorial & Testing Policy. Trading carries risk; see the disclaimer.