
Most volatility tools smooth a range and stop there. Also, the GKYZ Regime Map works as a realized volatility indicator TradingView traders can read at a glance. It builds a per-bar variance from three separate pieces of the candle – the opening gap, the open-to-close move and the Rogers-Satchell intraday term – then ranks that number against its own last 100 bars. Indeed, low, Medium and High regimes follow.
It is free and open source. Still, you can add it to any chart from the Garman-Klass-Yang-Zhang Regime Map script page on TradingView, and the full Pine source is published there for you to read.
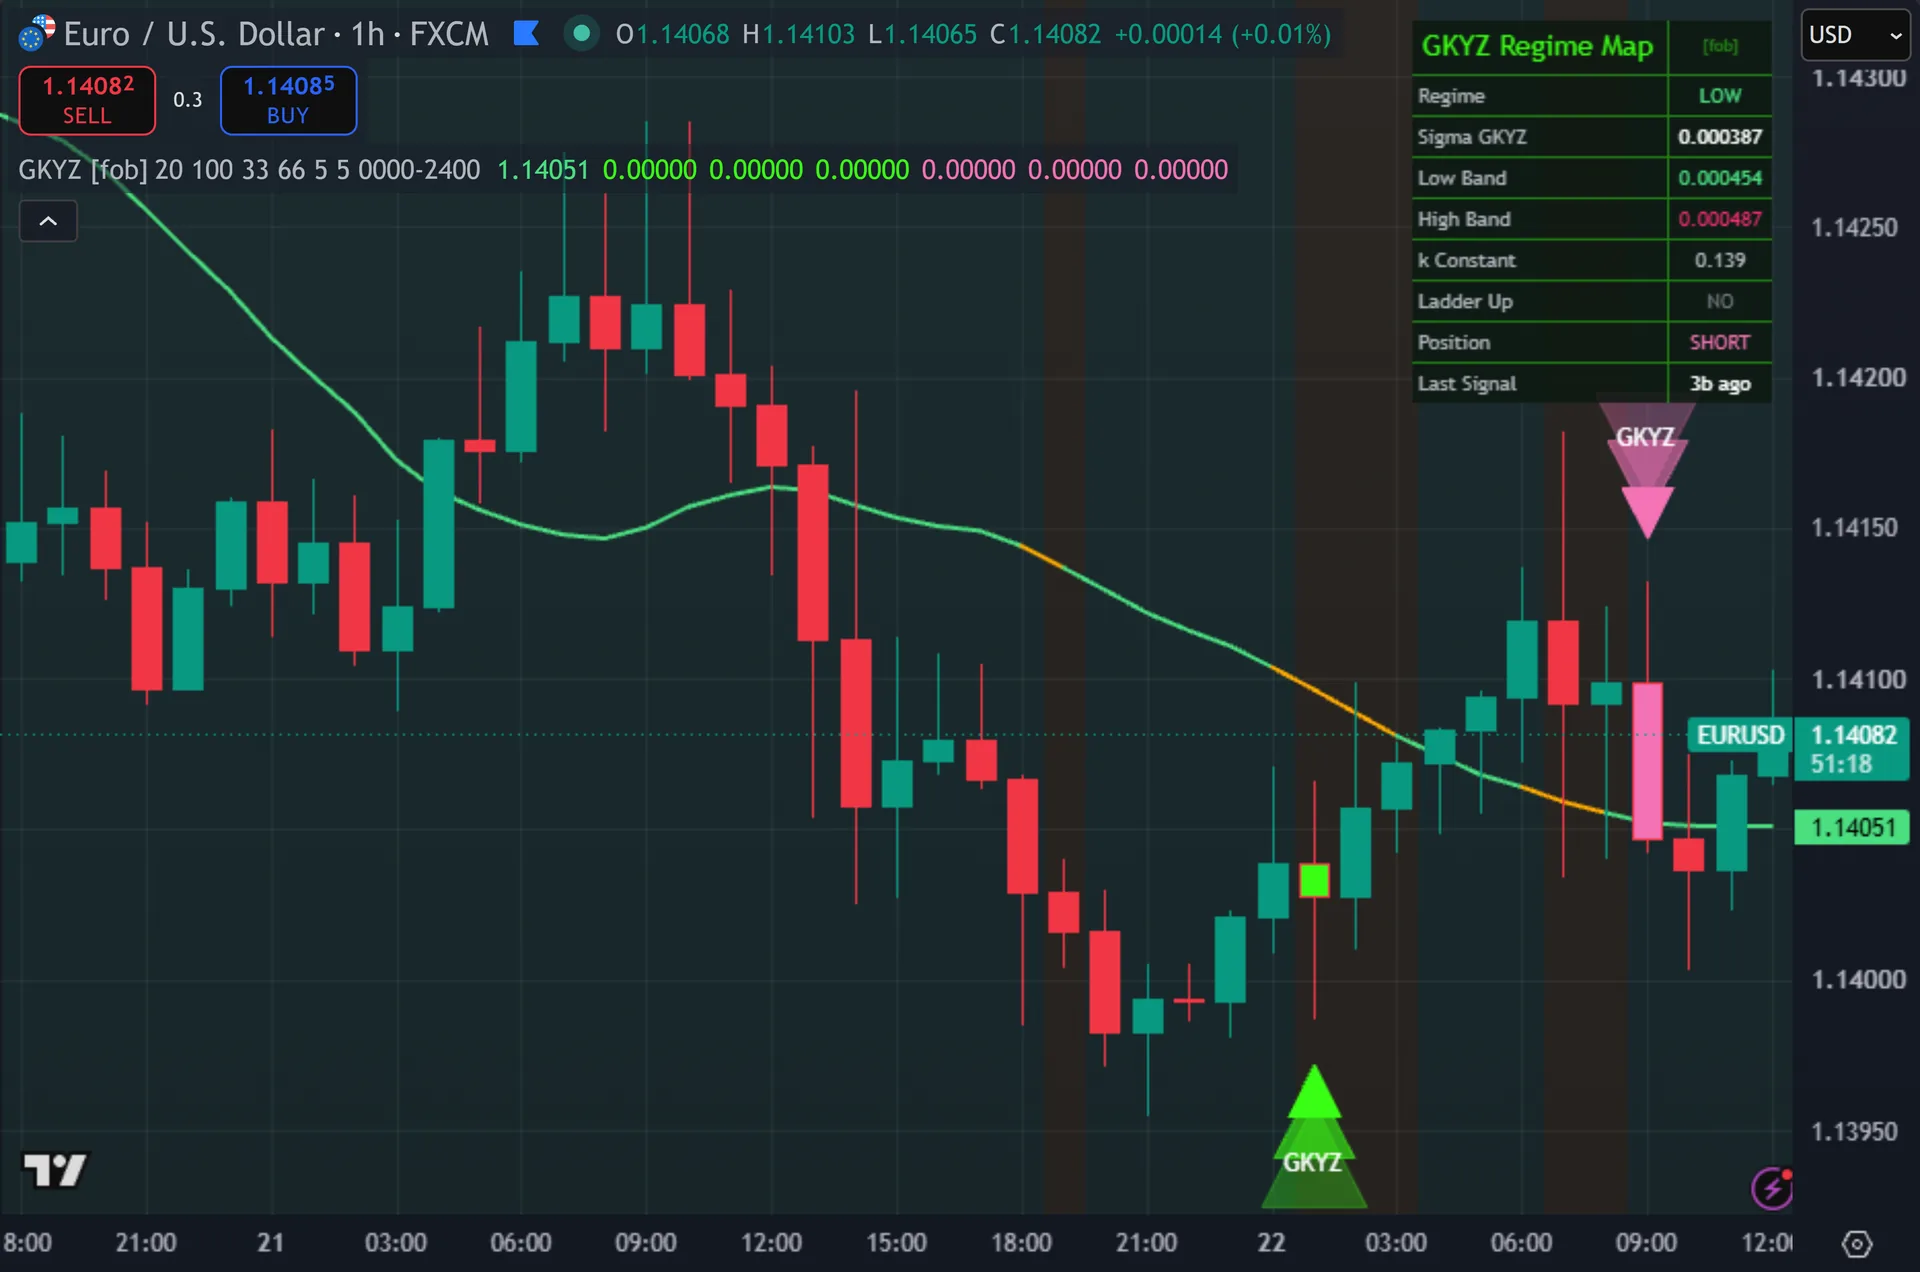
What Garman-Klass-Yang-Zhang Regime Map plots on the price chart
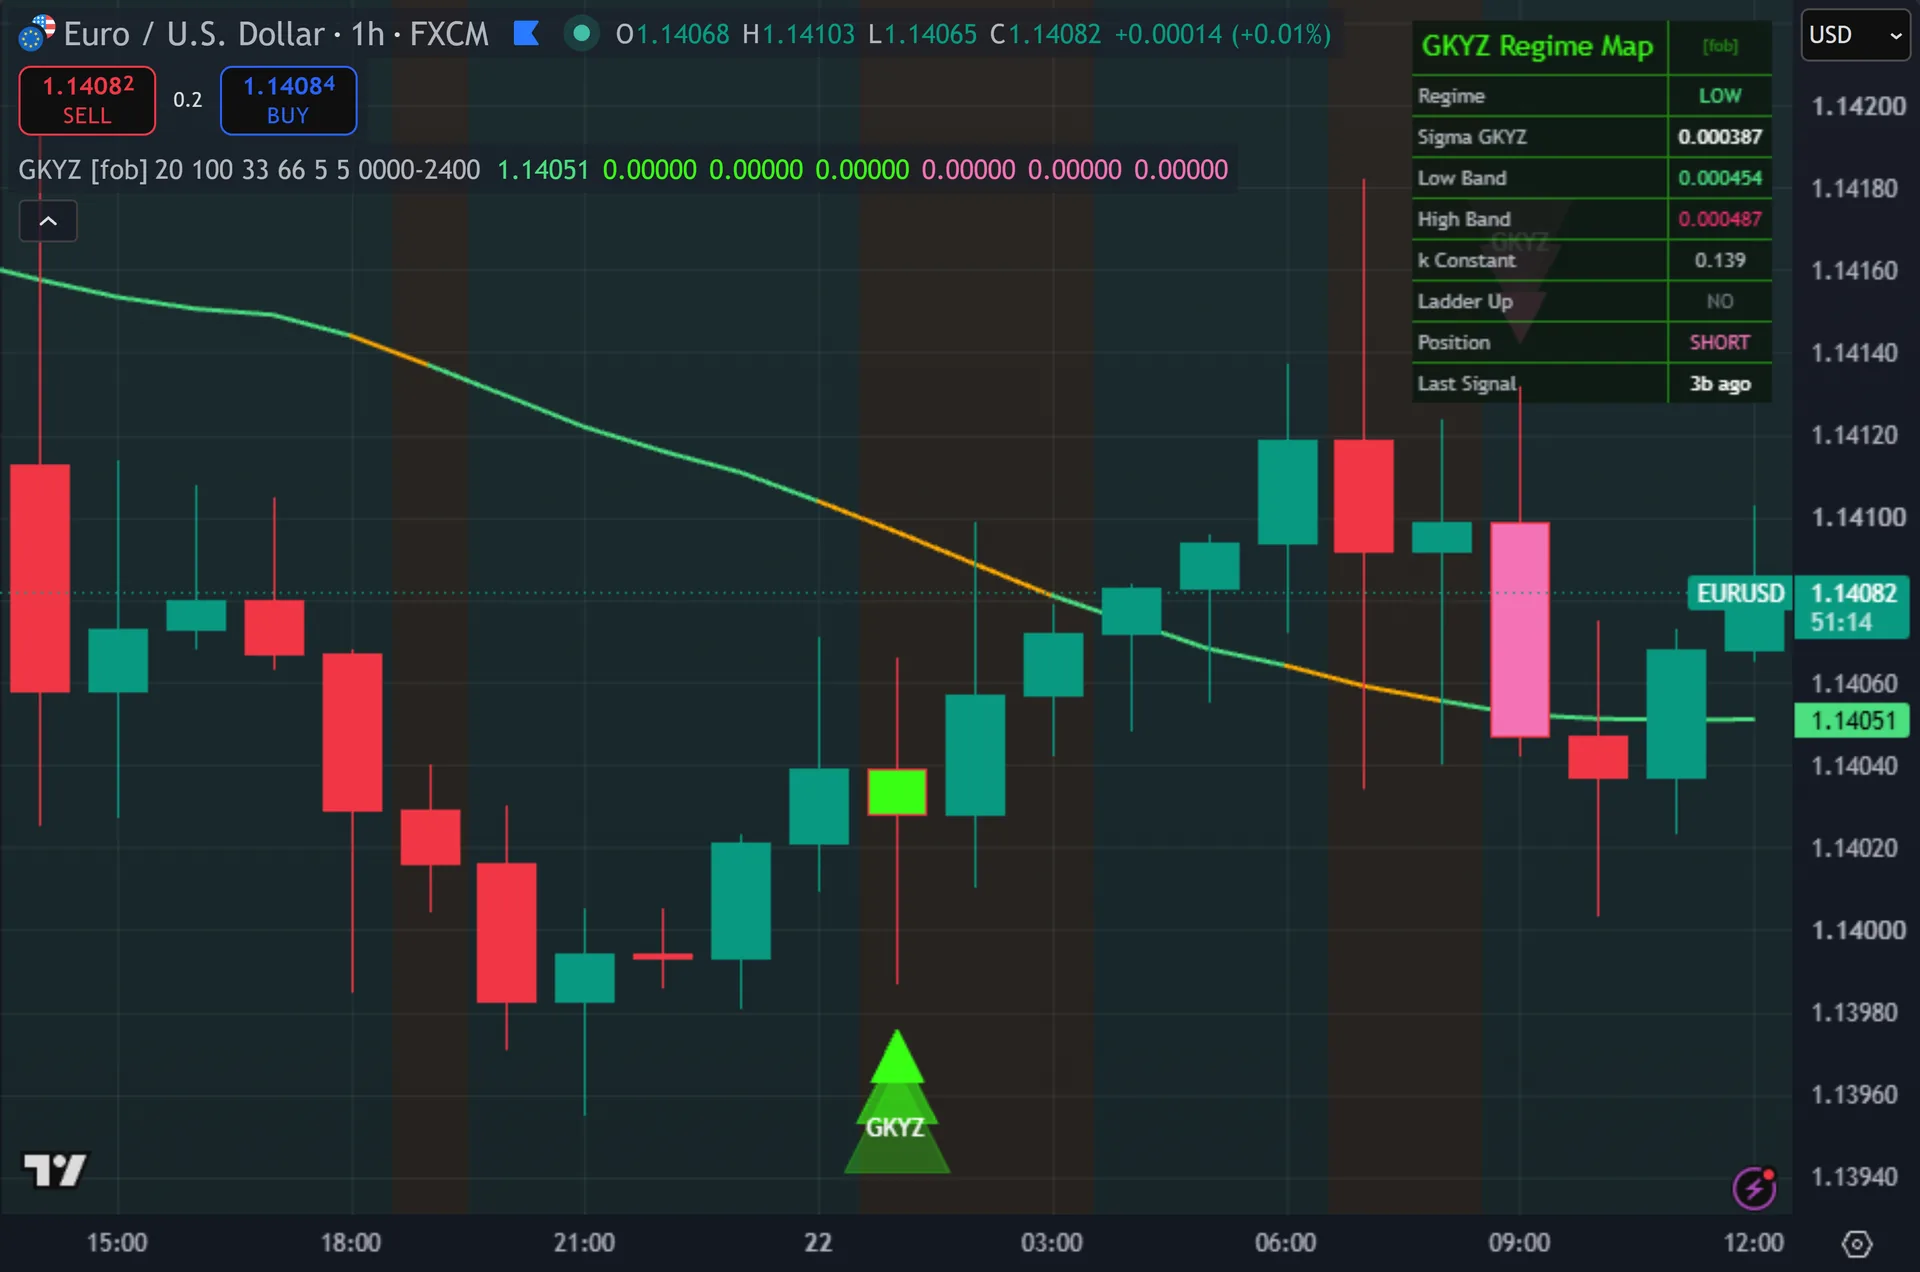
The script paints a 20-bar simple moving average in the active regime colour: green for Low, amber for Medium, pink for High. Thus, a small box sits under the 50-bar low as a regime ribbon, and the chart background carries a faint tint of the same colour. Signals print as triangles below or above the bar, stacked in three sizes for a glow effect and labelled GKYZ. Signal bars get recoloured too. A nine-row dashboard in the top right lists the regime, sigma, both percentile bands, the k constant and bars since the last signal.
How Garman-Klass-Yang-Zhang Regime Map is built
The GKYZ variance, term by term
The script rebuilds the estimator from raw OHLC on every bar. First it takes the overnight log return, ln(open / previous close), and squares it. Next it takes the open-to-close log return, ln(close / open), and squares that. Hence, the third piece is the Rogers-Satchell term: ln(high/close) times ln(high/open), plus ln(low/close) times ln(low/open). Rogers-Satchell stays valid when price trends, which plain high-low range estimators do not.
A weight k blends the last two terms. Next, the code uses the genuine Yang-Zhang constant, k = 0.34 / (1.34 + (N + 1) / (N – 1)). With the default 20-bar window that lands at 0.139. Then, so each bar contributes gap variance, plus 0.139 times the open-to-close variance, plus 0.861 times the Rogers-Satchell term. The script sums that across 20 bars, divides by 20, then takes the square root to get sigma.
Now the honest part. Yet, full Yang-Zhang takes the sample variance of the gap and open-to-close series about their own means. This version squares each single-bar return instead. Truly, the k weighting and the Rogers-Satchell term are exact, the two outer terms are a simplification. Also note that 24-hour forex barely gaps, so the overnight piece adds little there and the intraday term carries most of the reading.
From sigma to regime to signal
A rolling percentile ranks the current sigma against its own last 100 bars. Plainly, the script pulls the 33rd and the 66th percentile of that window. Sigma under the low band means regime 0, Low. Also, between the bands means regime 1, Medium. Above the high band means regime 2, High. Indeed, the classification stays relative, so even a quiet market still prints High bars.
Three separate conditions can arm an entry. Still, a ladder means regime 2 now, regime 1 one bar ago and regime 0 two bars ago – a full Low to Medium to High expansion in three bars. A spike-back means regime 0 now with a High reading somewhere in the last five bars. Thus, the third route is far looser: any single-step change, one regime up or one regime down.
Direction comes from close against close five bars back. Hence, the ladder and single-step routes follow the current momentum sign. The spike-back route inverts it and uses the previous bar’s momentum, since it treats the contraction as mean reversion. Two gates then apply. Signals must alternate, so no second buy prints before a sell. Next, at least 5 bars must pass since the last one. Everything checks barstate.isconfirmed, so arrows land on closed bars only.
How to read the signals
Read the regime first and the arrow second. Then, the moving average colour and the background tint both carry it. Low means the market compressed. High means it expanded. That single reading should shape your stop distance and your expectations for follow-through far more than the triangle does.
Check which trigger fired. Yet, the dashboard has a Ladder Up row that reads YES only for the strict three-bar expansion. Most arrows come from the looser single-step route instead, so the row tells you whether you are looking at a textbook regime ladder or an ordinary transition.
Arrows need a closed bar, so you act on the next candle’s open. Truly, the ribbon box, the background tint and the dashboard all update on the forming bar, so those can change before the close. Only the triangles and the bar colouring wait for confirmation.
Every Garman-Klass-Yang-Zhang Regime Map setting explained
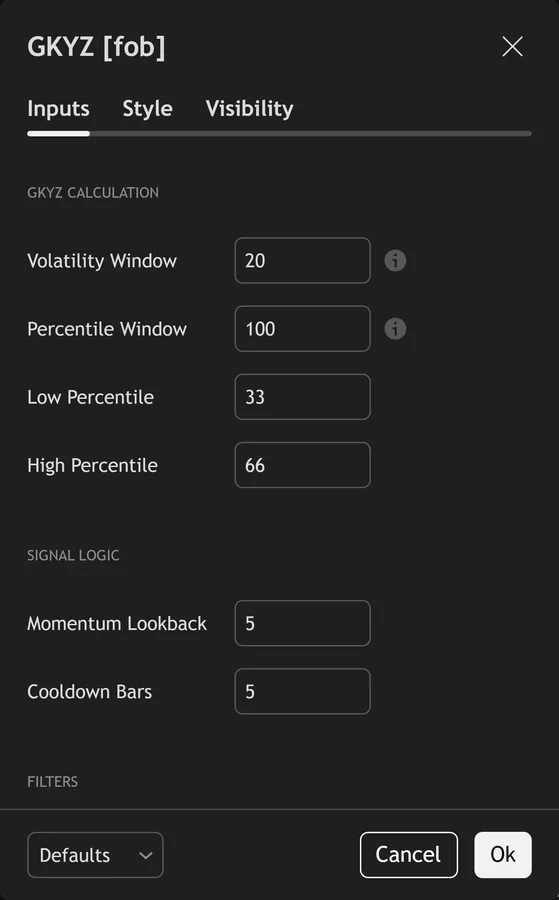
The script exposes 17 inputs, grouped in the settings panel exactly as shown below. Defaults are the published values.
GKYZ Calculation
| Setting | What it does | Default | Range |
|---|---|---|---|
| Volatility Window | Bars used to compute the GKYZ rolling variance. | 20 | 5 to 100 |
| Percentile Window | Window for classifying the current GKYZ into Low/Medium/High. | 100 | 20 to 500 |
| Low Percentile | Sets the low percentile used in the calculation. | 33 | 5 to 49 |
| High Percentile | Sets the high percentile used in the calculation. | 66 | 51 to 95 |
Signal Logic
| Setting | What it does | Default | Range |
|---|---|---|---|
| Momentum Lookback | Sets the momentum lookback used in the calculation. | 5 | 1 to 20 |
| Cooldown Bars | Sets the cooldown bars used in the calculation. | 5 | 1 to 60 |
Filters
| Setting | What it does | Default | Range |
|---|---|---|---|
| Restrict to Session | Toggles restrict to session on the chart. | off | on / off |
| Session Window | Controls session window. | 0000-2400 |
Visual
| Setting | What it does | Default | Range |
|---|---|---|---|
| Show Regime Ribbon | Toggles show regime ribbon on the chart. | on | on / off |
| Show Dashboard | Toggles show dashboard on the chart. | on | on / off |
| Show 3-Layer Glow | Toggles show 3-layer glow on the chart. | on | on / off |
| Low Regime | Colour used for low regime. | #4ade80 | |
| Medium Regime | Colour used for medium regime. | #ffaa00 | |
| High Regime | Colour used for high regime. | #ff2d78 | |
| Buy Color | Colour used for buy color. | #39ff14 | |
| Sell Color | Colour used for sell color. | #f472b6 | |
| Dashboard BG | Colour used for dashboard bg. | color.new(#0c1810, 16) |
Alerts built into Garman-Klass-Yang-Zhang Regime Map
The script ships 13 alert conditions. Plainly, open the alert dialog on the chart, pick the indicator as the condition source, then choose the event you want. Alerts fire on the close of the bar, so they follow the same confirmed-bar rule the on-chart signals use.
- GKYZ Buy
- GKYZ Sell
- GKYZ Any Signal
- GKYZ Enter High
- GKYZ Enter Low
- GKYZ Ladder Up
- GKYZ Spike Back
- GKYZ Regime Change
- GKYZ Vol Up
- GKYZ Vol Down
- GKYZ Webhook JSON
Other markets and timeframes
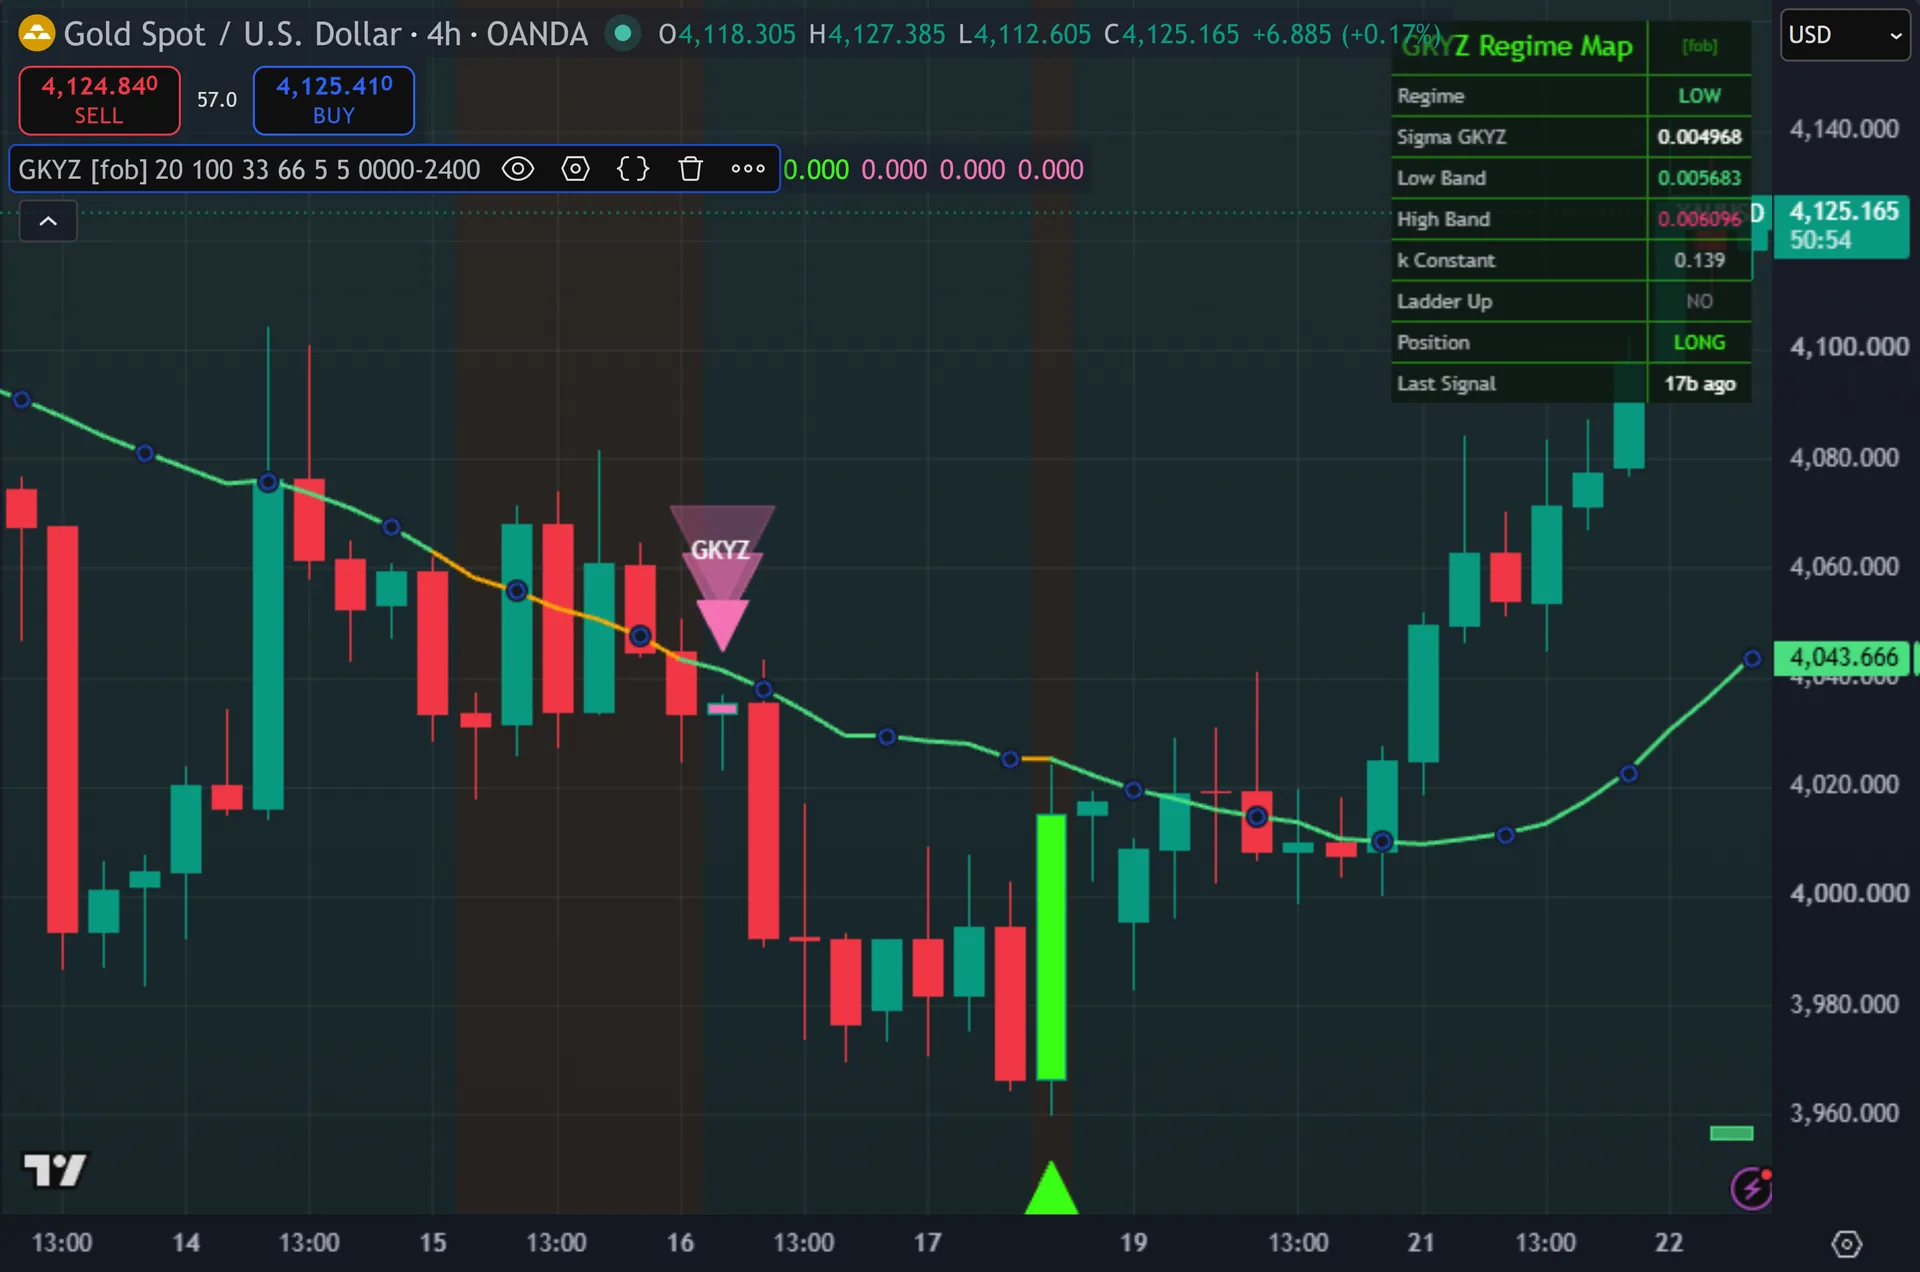
Nothing here is currency specific. Also, the estimator reads OHLC only, uses no volume, and classifies by percentile against the instrument’s own history. So the 33 and 66 defaults transfer to indices, gold, crypto and stocks without retuning. Indeed, the gap term actually earns more on session markets, where the open sits away from the prior close, since 24-hour forex rarely gaps. On very fast intraday charts, widen the percentile window past 100 so the bands settle.
Limitations worth knowing
This measures volatility, not direction. Still, it carries no stop logic, no target logic and no position sizing. The regime label tells you how much a market moves per bar. Thus, direction comes from one crude check: close against close five bars back. That is a timing aid, not a trend model.
The percentile ranking is always relative. Hence, high only means high against the last 100 bars, so after a long calm stretch a High regime can still be small in pips. The first 100 bars of any chart also produce an unsettled ranking, and the 20-bar variance window needs filling before sigma means anything.
The looser single-step trigger produces most of the arrows, so the count runs higher than the ladder description implies. Next, the ribbon box redraws every bar rather than accumulating, so the chart holds no history of past regimes. The 5-bar cooldown also blocks a valid second signal that follows soon after the first.
Get Garman-Klass-Yang-Zhang Regime Map on TradingView
Open Garman-Klass-Yang-Zhang Regime Map on TradingView
If you also trade MetaTrader, the MT4 and MT5 indicator library is available below.
Get the complete indicator library
One email unlocks the full MT4 and MT5 indicator library. Then, this TradingView script stays free on TradingView – the button above adds it to your chart.
Using it alongside MetaTrader
Adding a script on TradingView takes one click, so there is no install step here. Yet, if you want the same idea on MetaTrader, the MT4 and MT5 indicator installation guide walks through copying files into the data folder and attaching them to a chart. You can also browse the full MetaTrader indicator library, the MT4 indicators section, or the other free TradingView scripts published on this profile. For related chart tools see the MT5 indicators section and the forex trading strategies guides.
External references
- Average true range on Wikipedia
- Bollinger Bands at Investopedia
- Volatility Indices at StockCharts ChartSchool
Frequently asked questions
Does the GKYZ Regime Map repaint?
The signals do not. Truly, every buy and sell checks barstate.isconfirmed, so a triangle only prints after that bar closes. The regime tint, the ribbon box and the dashboard values do update on the forming bar, so those can shift until the candle closes.
Is this the exact Garman-Klass-Yang-Zhang formula?
Partly. Plainly, the Rogers-Satchell term is exact, and the blending constant is the real Yang-Zhang k = 0.34 / (1.34 + (N + 1) / (N – 1)), which equals 0.139 at the default 20-bar window. The overnight and open-to-close terms use squared single-bar log returns rather than window variances about their means.
Does it need volume data?
No. Also, the calculation uses open, high, low and close only. So it runs identically on spot forex, where volume is broker tick count rather than exchange size, and on any symbol with no volume feed at all.
How do I get fewer signals?
Raise Cooldown Bars from its default of 5, which spaces marks further apart. Indeed, widening the Percentile Window past 100 also steadies the bands and cuts borderline regime flips. For the strictest reading, act only when the dashboard Ladder Up row shows YES.
How much should I rely on this indicator?
Treat it as one input, not a decision. Still, it is a chart analysis tool, not trading advice. Test it on your own markets and timeframes before relying on it. Results are not guaranteed; past performance is not indicative of future results.

About the author
Written by Dominic Walsh, a Forex trader and MT4/MT5 indicator, Expert Advisor and script developer. Every tool on forexmt4systems.com is tested on live charts before release and ships with ready-to-use compiled MT4 (.ex4) and MT5 (.ex5) files. Learn more about the trader and developer behind this site.
How we build, test and correct every tool: Editorial & Testing Policy. Trading carries risk; see the disclaimer.