
Harmonic traders spend most of their time measuring one number: the retracement ratio between two legs. Also, harmonic Ratio Scanner is a free harmonic pattern indicator TradingView users can run to automate that measurement. It tracks the last ten confirmed swing points, divides the newest leg by the leg before it, and flags the result when it lands inside tolerance of 38.2, 61.8 or 78.6 percent. Indeed, it measures ratios, not complete XABCD shapes.
It is free and open source. Still, you can add it to any chart from the Harmonic Ratio Scanner script page on TradingView, and the full Pine source is published there for you to read.
What Harmonic Ratio Scanner plots on the price chart
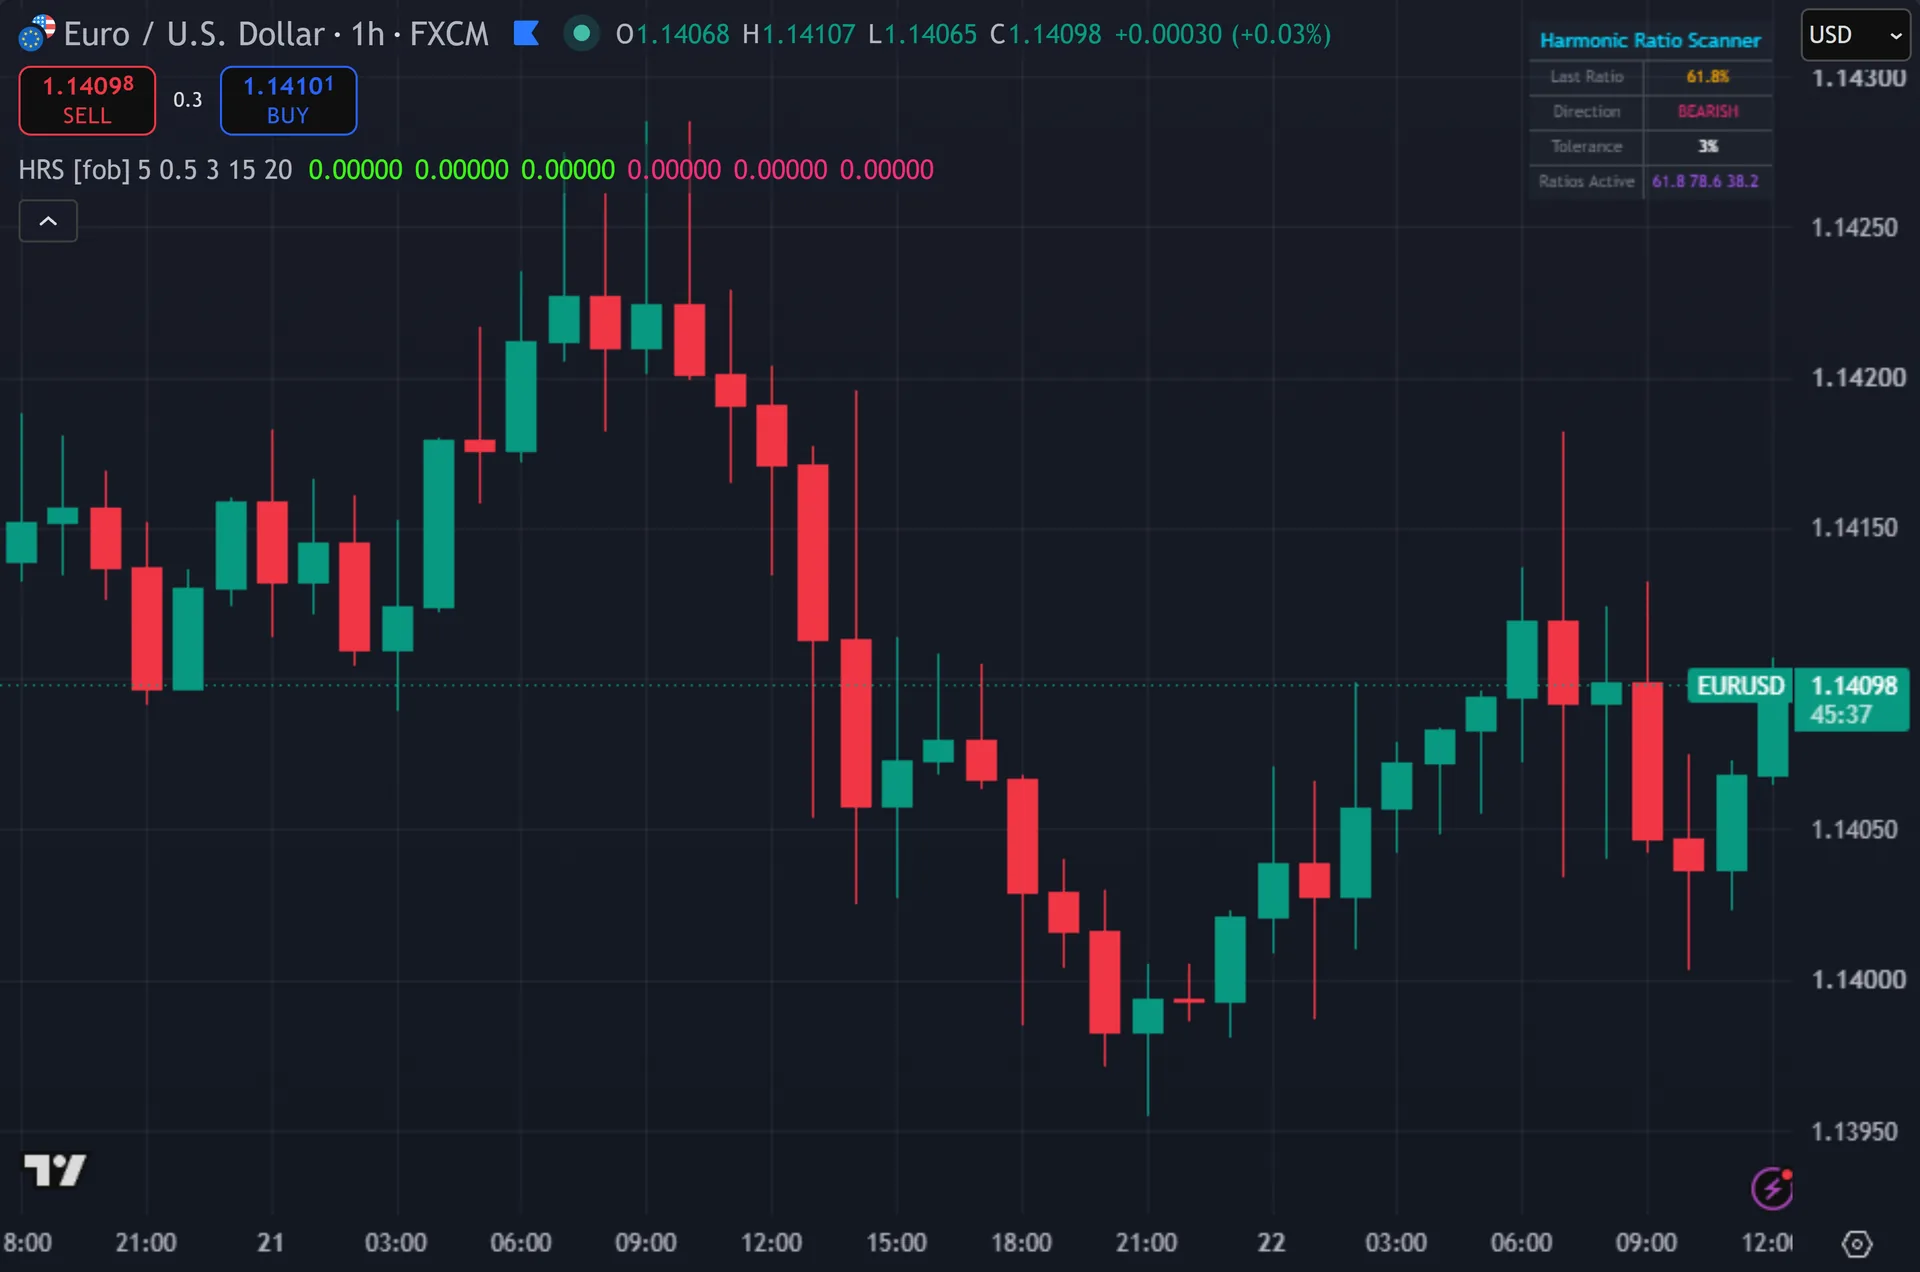
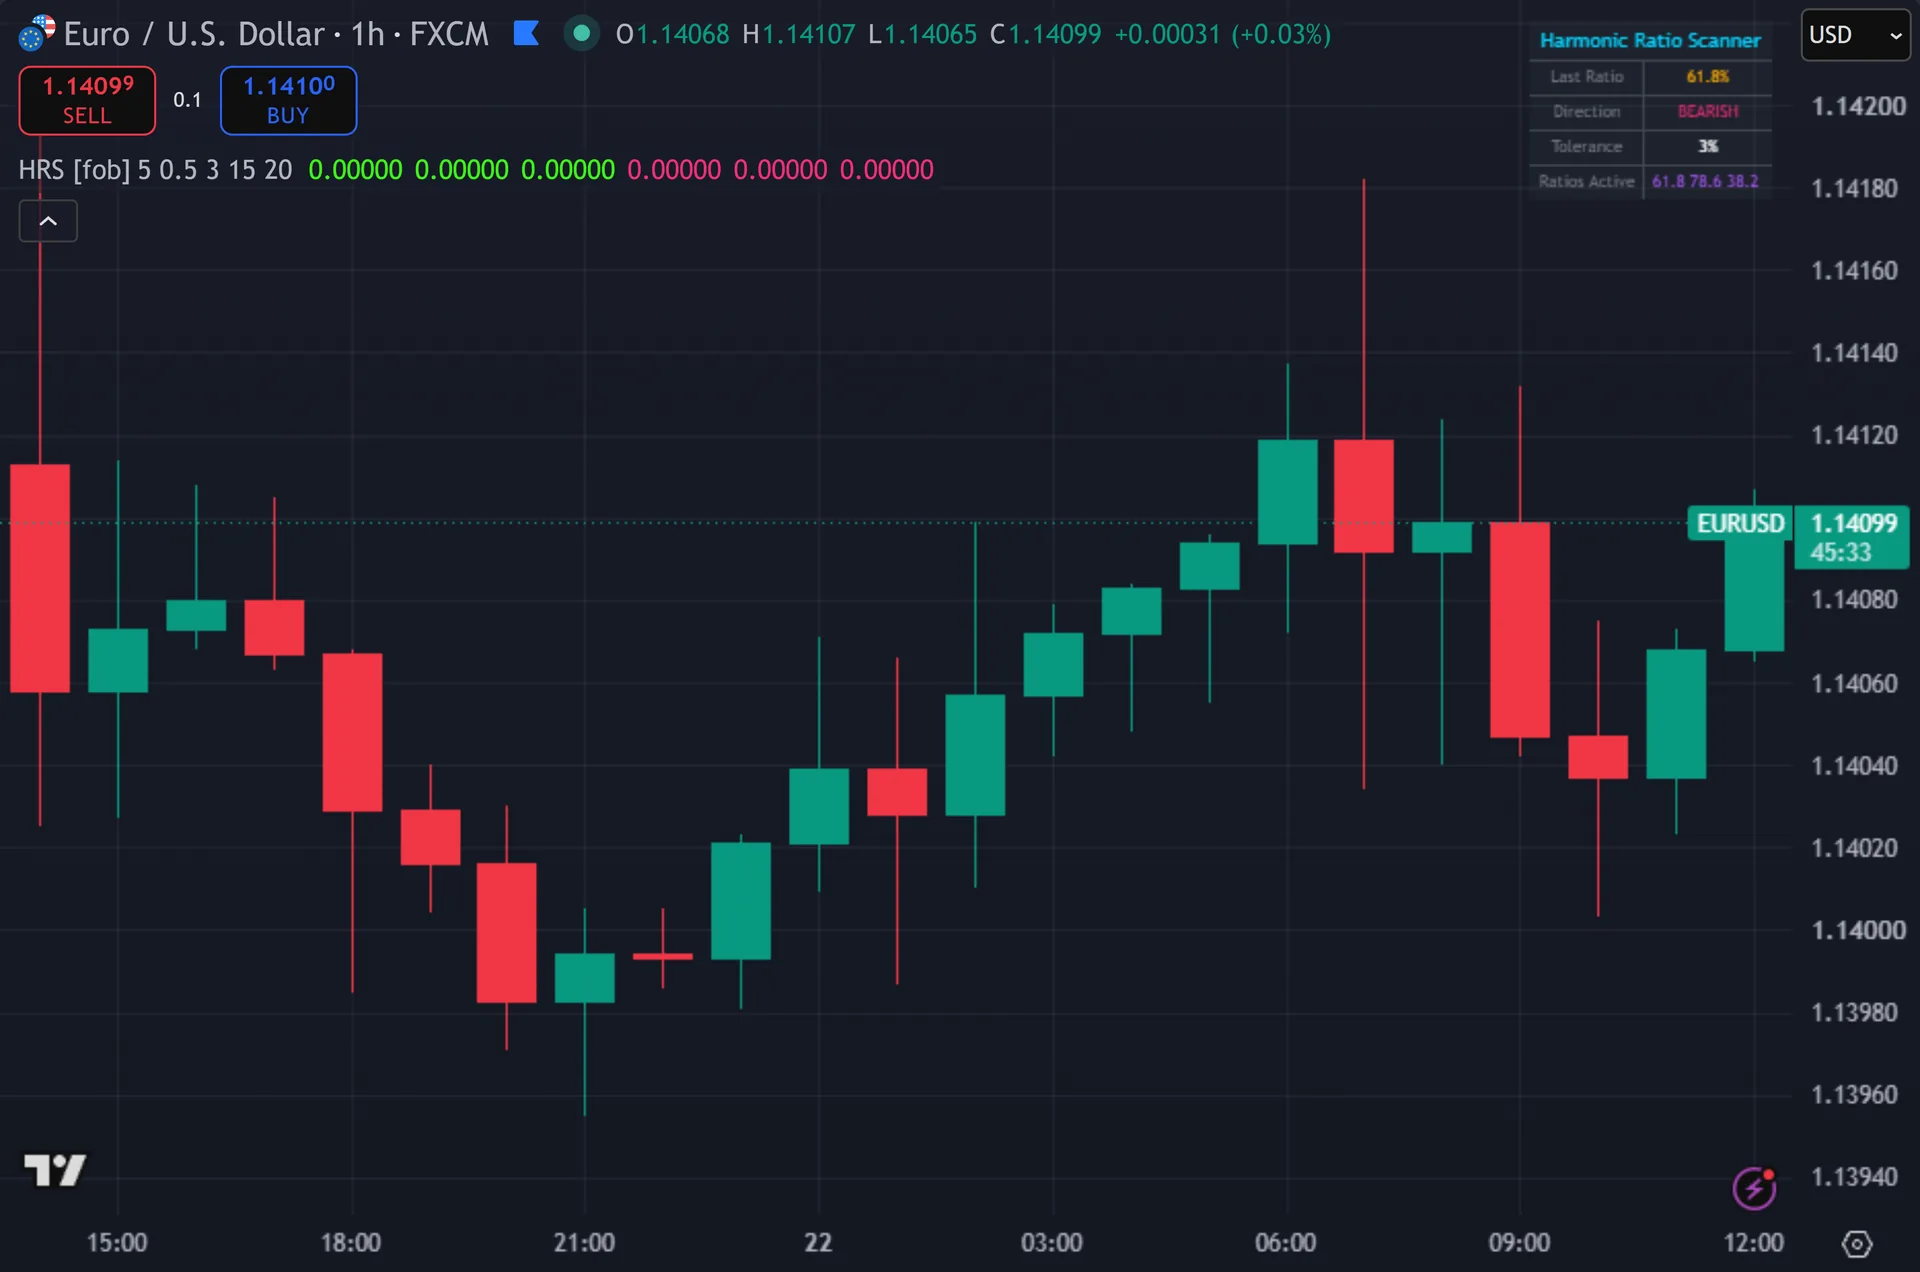
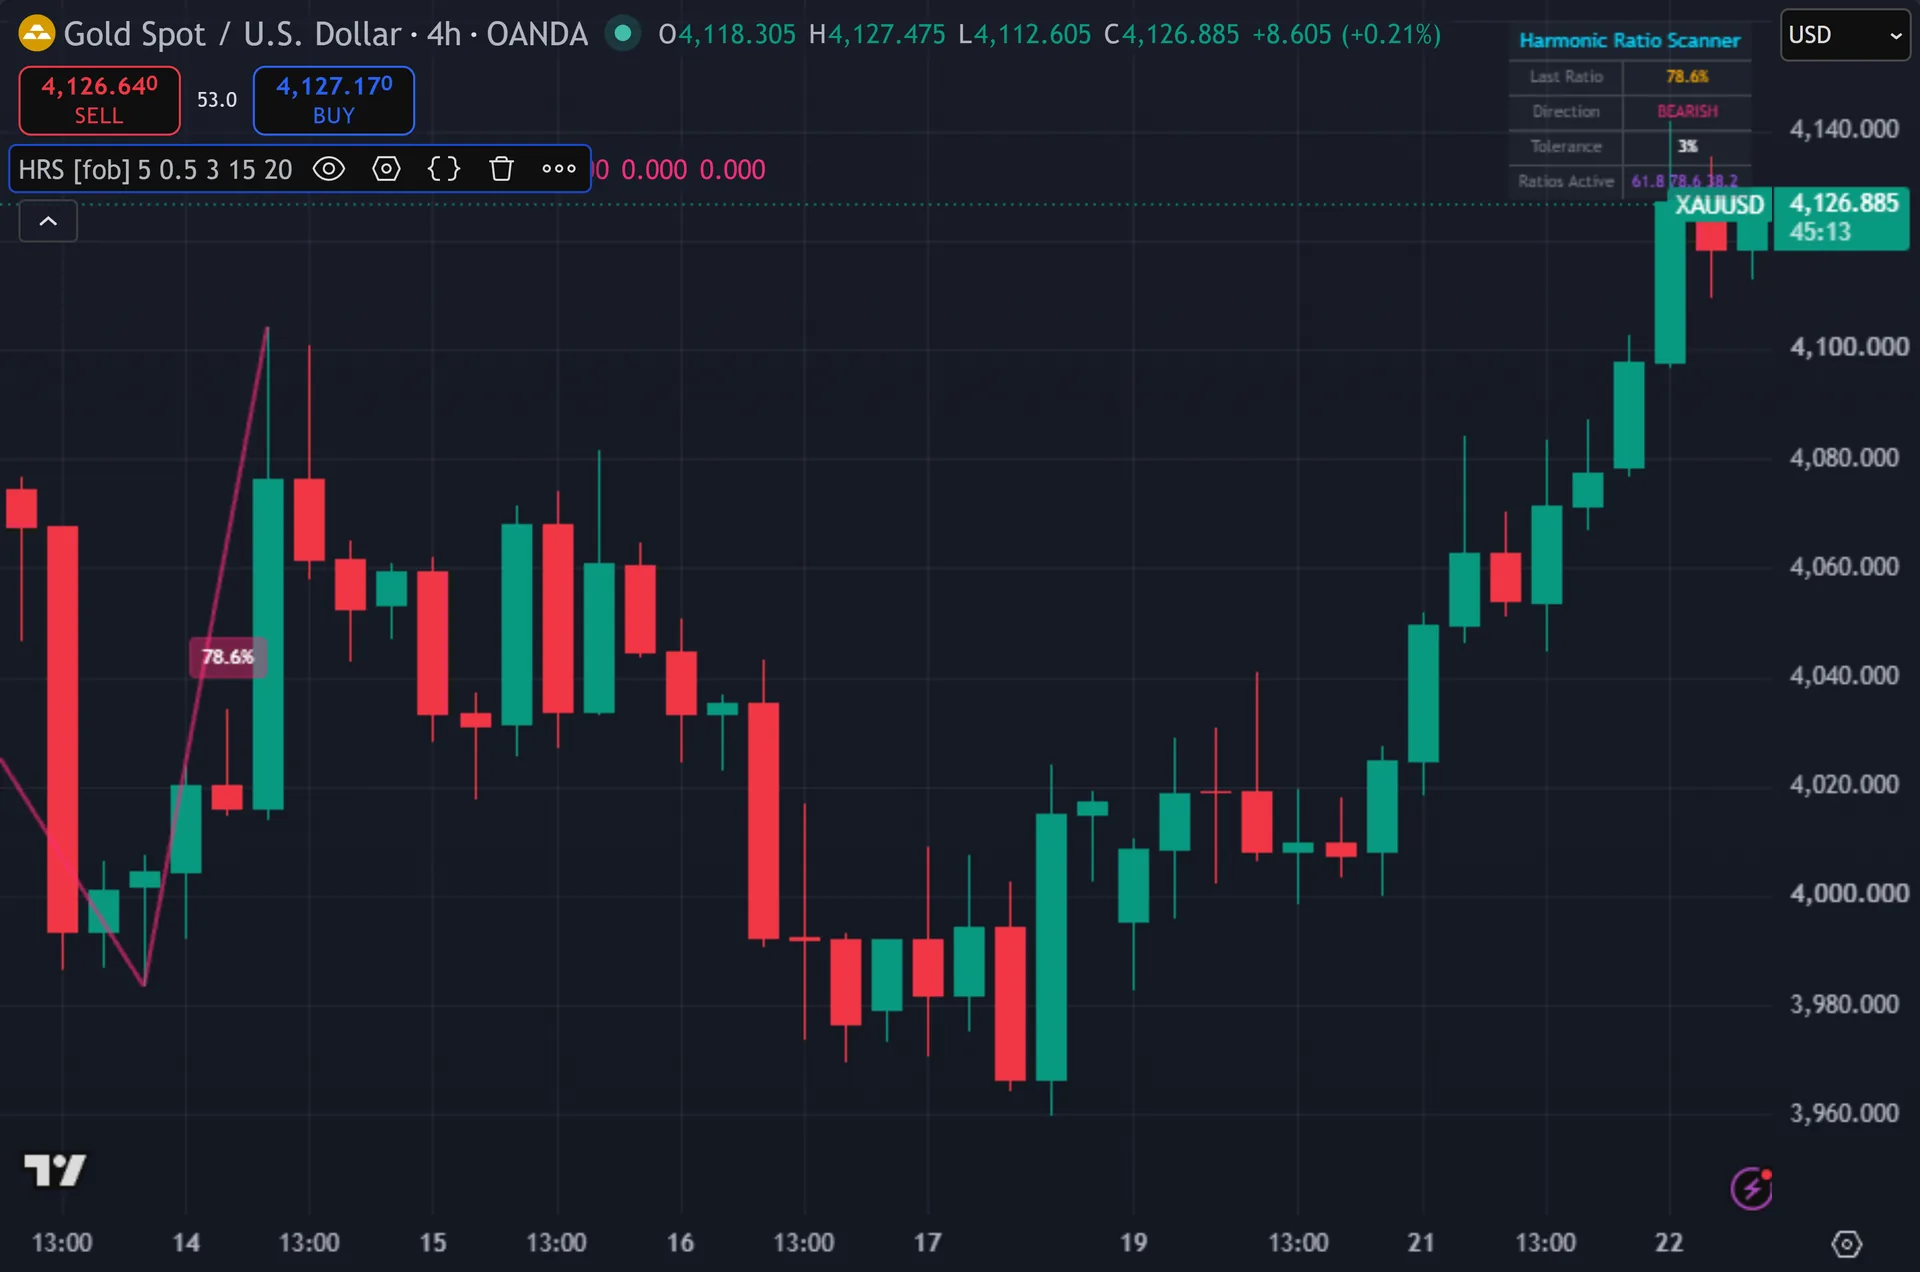
Two lines connect the three swings that produced a match, green for bullish and pink for bearish. Thus, a small label sits between the last two swings and names the ratio: 61.8%, 78.6%, 38.2% or 50.0%. Qualifying signals print a triangle below or above the bar in three stacked layers, plus a text label reading BUY or SELL with the matched ratio underneath. Hence, the script tints the signal bar. A five-row table shows the last ratio, its direction, your tolerance and the ratios you have enabled.
How Harmonic Ratio Scanner is built
Swing detection and the ratio test
Swings come from the pivot high and pivot low functions with a lookback of five bars on each side. Next, a pivot confirms only after five more bars print, so every swing lands five bars in the past. The script stores the price, the bar index and a high-or-low flag for the ten most recent swings.
It then walks up to five consecutive triples from that store. For each triple it measures leg A as the distance between the two older swings and leg B as the distance between the two newest. Leg A must exceed 0.5 times ATR over 14 bars by default, which filters noise. Then, the ratio is leg B divided by leg A.
The tolerance input reads as a percent but applies as an absolute band on the ratio. Yet, set it to 3.0 and the script accepts any ratio within 0.03 of a target. So the 61.8 percent test covers roughly 0.588 to 0.648. Truly, three targets run by default: 0.382, 0.618 and 0.786. The 0.500 target stays off until you switch it on. Plainly, the scan stops at the first triple that matches.
Direction and signal gates
Direction comes from the swing types, not from price. Also, the script calls a match bullish when the newest swing is a low and the one before it is a high. That describes a retracement down into a low, so it expects the next leg up. The mirror case reads bearish.
A match becomes a signal only after three more gates. Indeed, volume must sit above its own 20-bar simple moving average. At least 15 bars must have passed since the previous signal. Still, and the bar must close, since both signal booleans carry barstate.isconfirmed.
Note the split between layers. Thus, triangles, bar tint and the BUY or SELL labels all wait for the close. The swing lines and the ratio name label do not. Hence, they draw the moment a new ratio appears, so they can redraw on an unfinished bar. Alerts split the same way, since the buy and sell conditions confirm while the ratio-detected and swing-detected conditions do not.
How to read the signals
The label names the ratio, so treat 38.2, 61.8 and 78.6 as different setups. Next, a shallow 38.2 retracement usually means a strong trend that barely paused. A deep 78.6 means the prior leg nearly failed. Then, your stop distance and your expectation should change with the number.
Every swing confirms five bars late. Yet, so the triangle sits at least five bars after the actual turn, and the ratio can only be measured once that turn is old news. The tool is a measuring device for structure that has already formed, not an early warning system.
The volume gate does real work here. Truly, a ratio that lands on quiet volume never prints a triangle, though the swing lines and the ratio label still draw. If you see lines and a label with no arrow, then volume, the 15-bar cooldown or the bar close blocked it.
Every Harmonic Ratio Scanner setting explained
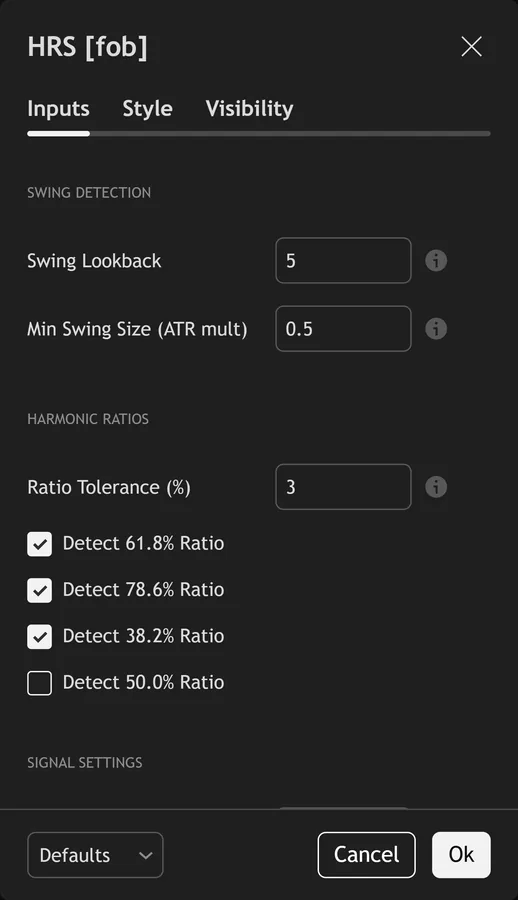
The script exposes 12 inputs, grouped in the settings panel exactly as shown below. Defaults are the published values.
Swing Detection
| Setting | What it does | Default | Range |
|---|---|---|---|
| Swing Lookback | Number of bars to confirm a swing high/low | 5 | 2 to 20 |
| Min Swing Size (ATR mult) | Minimum swing size as ATR multiple to filter noise | 0.5 | 0.1 to 5.0 |
Harmonic Ratios
| Setting | What it does | Default | Range |
|---|---|---|---|
| Ratio Tolerance (%) | Allowed deviation from perfect harmonic ratio | 3.0 | 0.5 to 10.0 |
| Detect 61.8% Ratio | Toggles detect 61.8% ratio on the chart. | on | on / off |
| Detect 78.6% Ratio | Toggles detect 78.6% ratio on the chart. | on | on / off |
| Detect 38.2% Ratio | Toggles detect 38.2% ratio on the chart. | on | on / off |
| Detect 50.0% Ratio | Toggles detect 50.0% ratio on the chart. | off | on / off |
Signal Settings
| Setting | What it does | Default | Range |
|---|---|---|---|
| Signal Cooldown | Minimum bars between signals | 15 | 5 to 50 |
| Volume SMA Length | Sets the volume sma length used in the calculation. | 20 | 5 to 100 |
Visuals
| Setting | What it does | Default | Range |
|---|---|---|---|
| Show Info Table | Toggles show info table on the chart. | on | on / off |
| Draw Swing Lines | Toggles draw swing lines on the chart. | on | on / off |
| Show Ratio Labels | Toggles show ratio labels on the chart. | on | on / off |
Alerts built into Harmonic Ratio Scanner
The script ships 13 alert conditions. Plainly, open the alert dialog on the chart, pick the indicator as the condition source, then choose the event you want. Alerts fire on the close of the bar, so they follow the same confirmed-bar rule the on-chart signals use.
- HRS Buy Signal
- HRS Sell Signal
- HRS Any Signal
- HRS Ratio Detected
- HRS Bullish Ratio
- HRS Bearish Ratio
- HRS Active Ratio
- HRS Volume Surge
- HRS Swing Detected
Other markets and timeframes
Every threshold here is relative. Also, the minimum swing uses ATR, the ratios are pure proportions, and the volume gate compares volume against its own average. So the defaults move to gold, indices, crypto and equities with no retuning. One caveat matters. The volume gate needs a volume feed, and on spot forex that feed is broker tick volume rather than exchange volume. On any symbol with no volume data the gate blocks every signal outright.
Limitations worth knowing
The name promises more than the code delivers. Indeed, this does not detect Gartley, Bat, Butterfly, Crab or any complete XABCD harmonic pattern. It measures a single retracement ratio between three consecutive swings and names it. Still, full pattern validation needs several ratios checked together, and that logic is absent.
Pivots confirm five bars late by construction. Thus, every signal therefore arrives after the swing it describes. Shrinking the swing lookback speeds confirmation up, but it also produces far more and far noisier swings.
The triple comes from consecutive stored swings without forcing a strict high, low, high alternation, so an unusual sequence can produce a ratio you would not draw by hand. Hence, the tool also carries no trend filter, no target and no stop logic. It marks a ratio and stops there.
Get Harmonic Ratio Scanner on TradingView
Open Harmonic Ratio Scanner on TradingView
If you also trade MetaTrader, the MT4 and MT5 indicator library is available below.
Get the complete indicator library
One email unlocks the full MT4 and MT5 indicator library. Next, this TradingView script stays free on TradingView – the button above adds it to your chart.
Using it alongside MetaTrader
Adding a script on TradingView takes one click, so there is no install step here. Then, if you want the same idea on MetaTrader, the MT4 and MT5 indicator installation guide walks through copying files into the data folder and attaching them to a chart. You can also browse the full MetaTrader indicator library, the MT4 indicators section, or the other free TradingView scripts published on this profile. For related chart tools see the MT5 indicators section and the forex trading strategies guides.
External references
- Candlestick pattern on Wikipedia
- Pivot Point at Investopedia
- Candlestick Charts at StockCharts ChartSchool
Frequently asked questions
Does Harmonic Ratio Scanner find Gartley and Bat patterns?
No. Yet, it measures one retracement ratio between three swings and names it 38.2, 50.0, 61.8 or 78.6 percent. Named XABCD harmonics need several ratios to agree across five points, and that check is not in the code. Truly, use this as a ratio measuring tool rather than a pattern detector.
Does it repaint?
The triangles, the bar tint and the BUY or SELL labels do not, because both signals gate on barstate.isconfirmed. Plainly, the swing lines and the ratio name label draw without that gate, so they can appear and shift while a bar is still open. The pivots themselves confirm five bars after the turn.
What does the tolerance setting really do?
It reads as a percent, but the code divides it by 100 and applies it as an absolute band on the ratio. Also, a setting of 3.0 accepts anything within 0.03 of a target, so the 61.8 percent test covers roughly 0.588 to 0.648. Tighten it to 1.0 for stricter matches.
Why do I get so few signals?
Four filters stack. Indeed, leg A must exceed half an ATR, the ratio must land inside tolerance, volume must beat its 20-bar average, and 15 bars must have passed since the last signal. Widen the tolerance or lower the cooldown to see more marks, at the cost of selectivity.
How much should I rely on this indicator?
Treat it as one input, not a decision. Still, it is a chart analysis tool, not trading advice. Test it on your own markets and timeframes before relying on it. Results are not guaranteed; past performance is not indicative of future results.

About the author
Written by Dominic Walsh, a Forex trader and MT4/MT5 indicator, Expert Advisor and script developer. Every tool on forexmt4systems.com is tested on live charts before release and ships with ready-to-use compiled MT4 (.ex4) and MT5 (.ex5) files. Learn more about the trader and developer behind this site.
How we build, test and correct every tool: Editorial & Testing Policy. Trading carries risk; see the disclaimer.