
Volume bursts arrive in clusters. Also, one large print tends to pull more behind it. Hawkes Flow Ignite, a free order flow indicator TradingView traders can load on any chart, models that habit directly. Indeed, each burst adds 1.0 to a running intensity, and that intensity decays with a 15-bar half-life. Once intensity clears its own rolling threshold, the script waits for a decisive bar and flags the side.
It is free and open source. Still, you can add it to any chart from the Hawkes Flow Ignite script page on TradingView, and the full Pine source is published there for you to read.
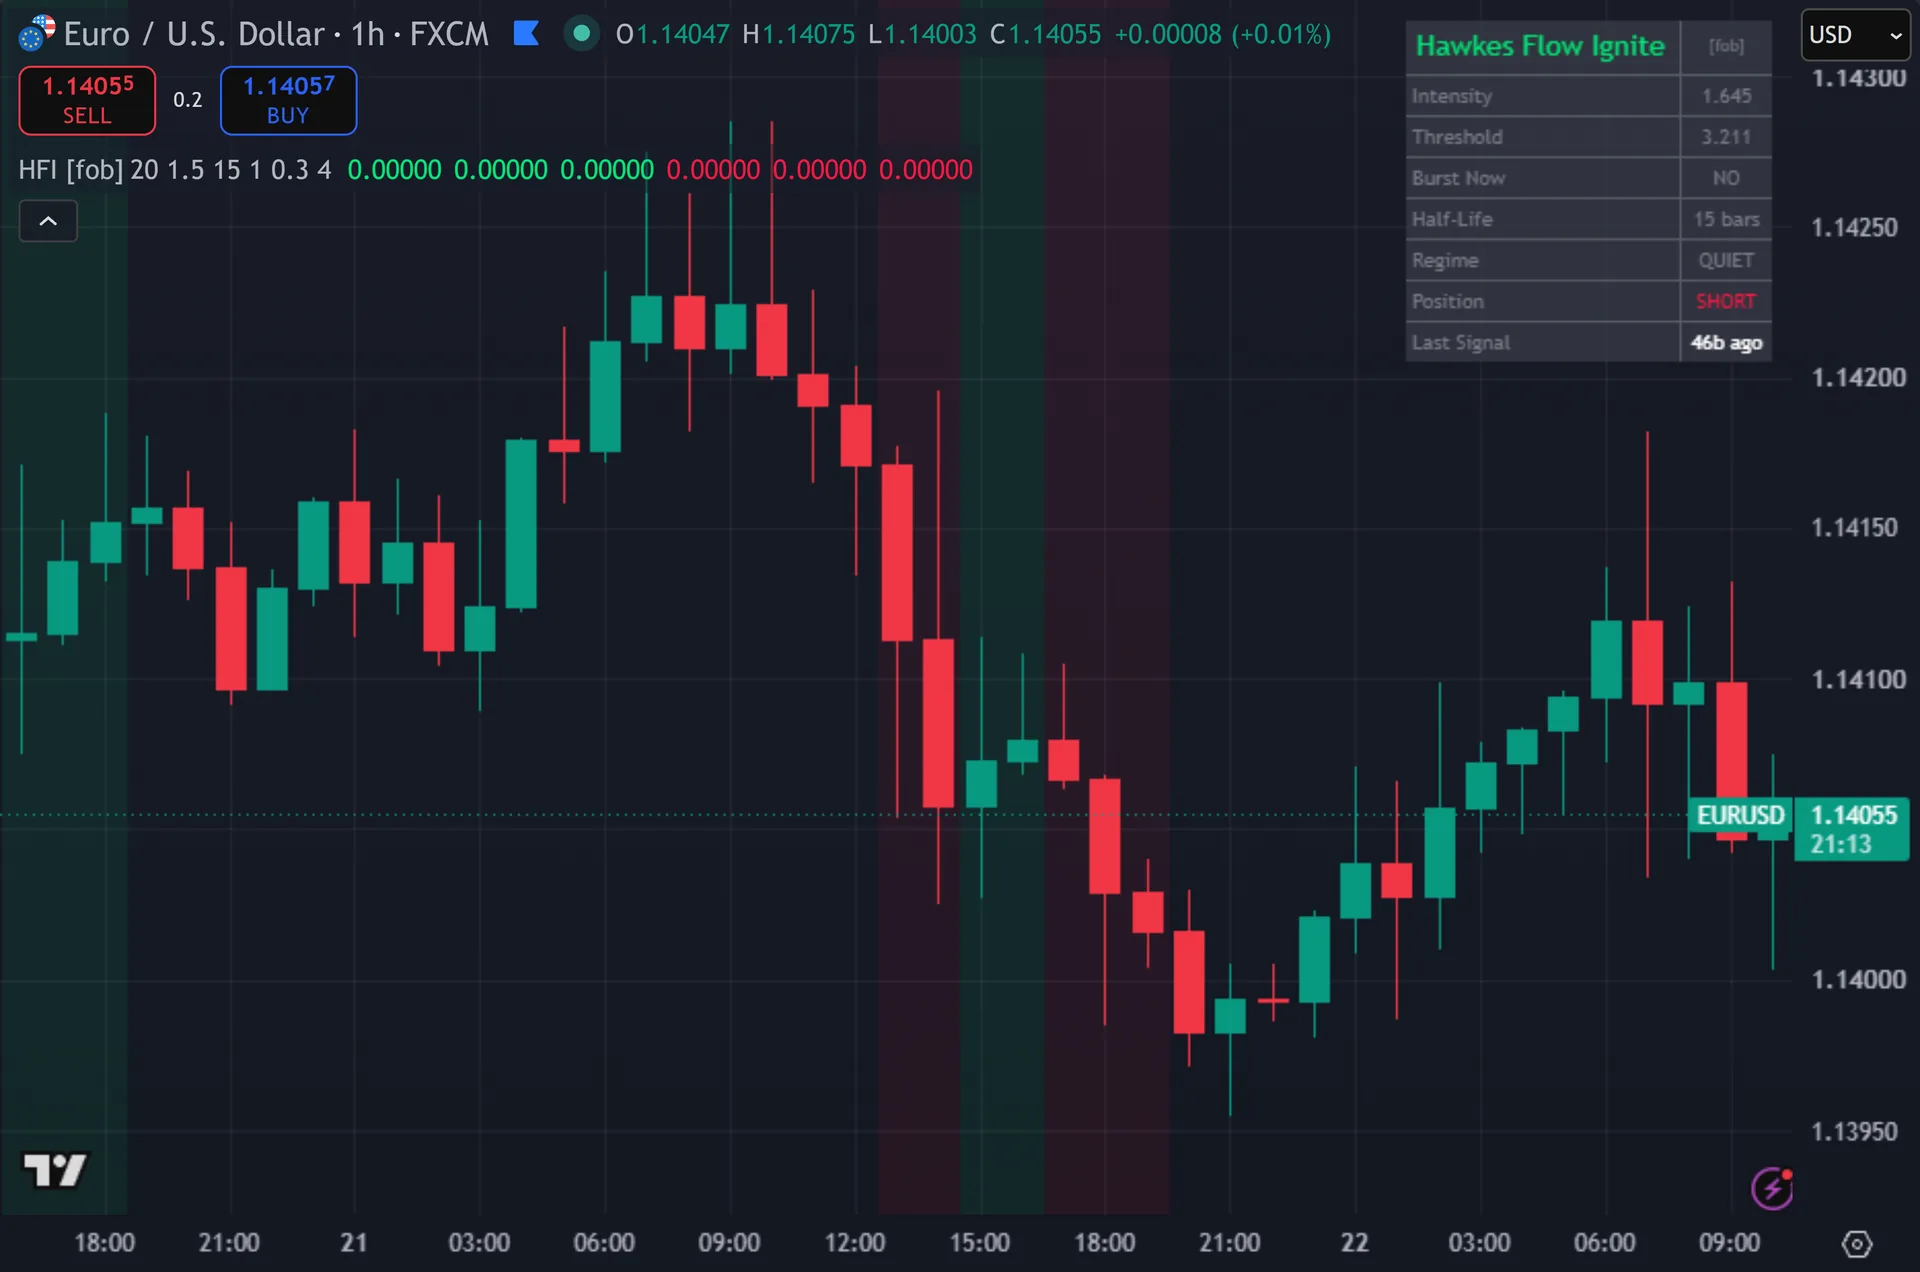
What Hawkes Flow Ignite plots on the price chart
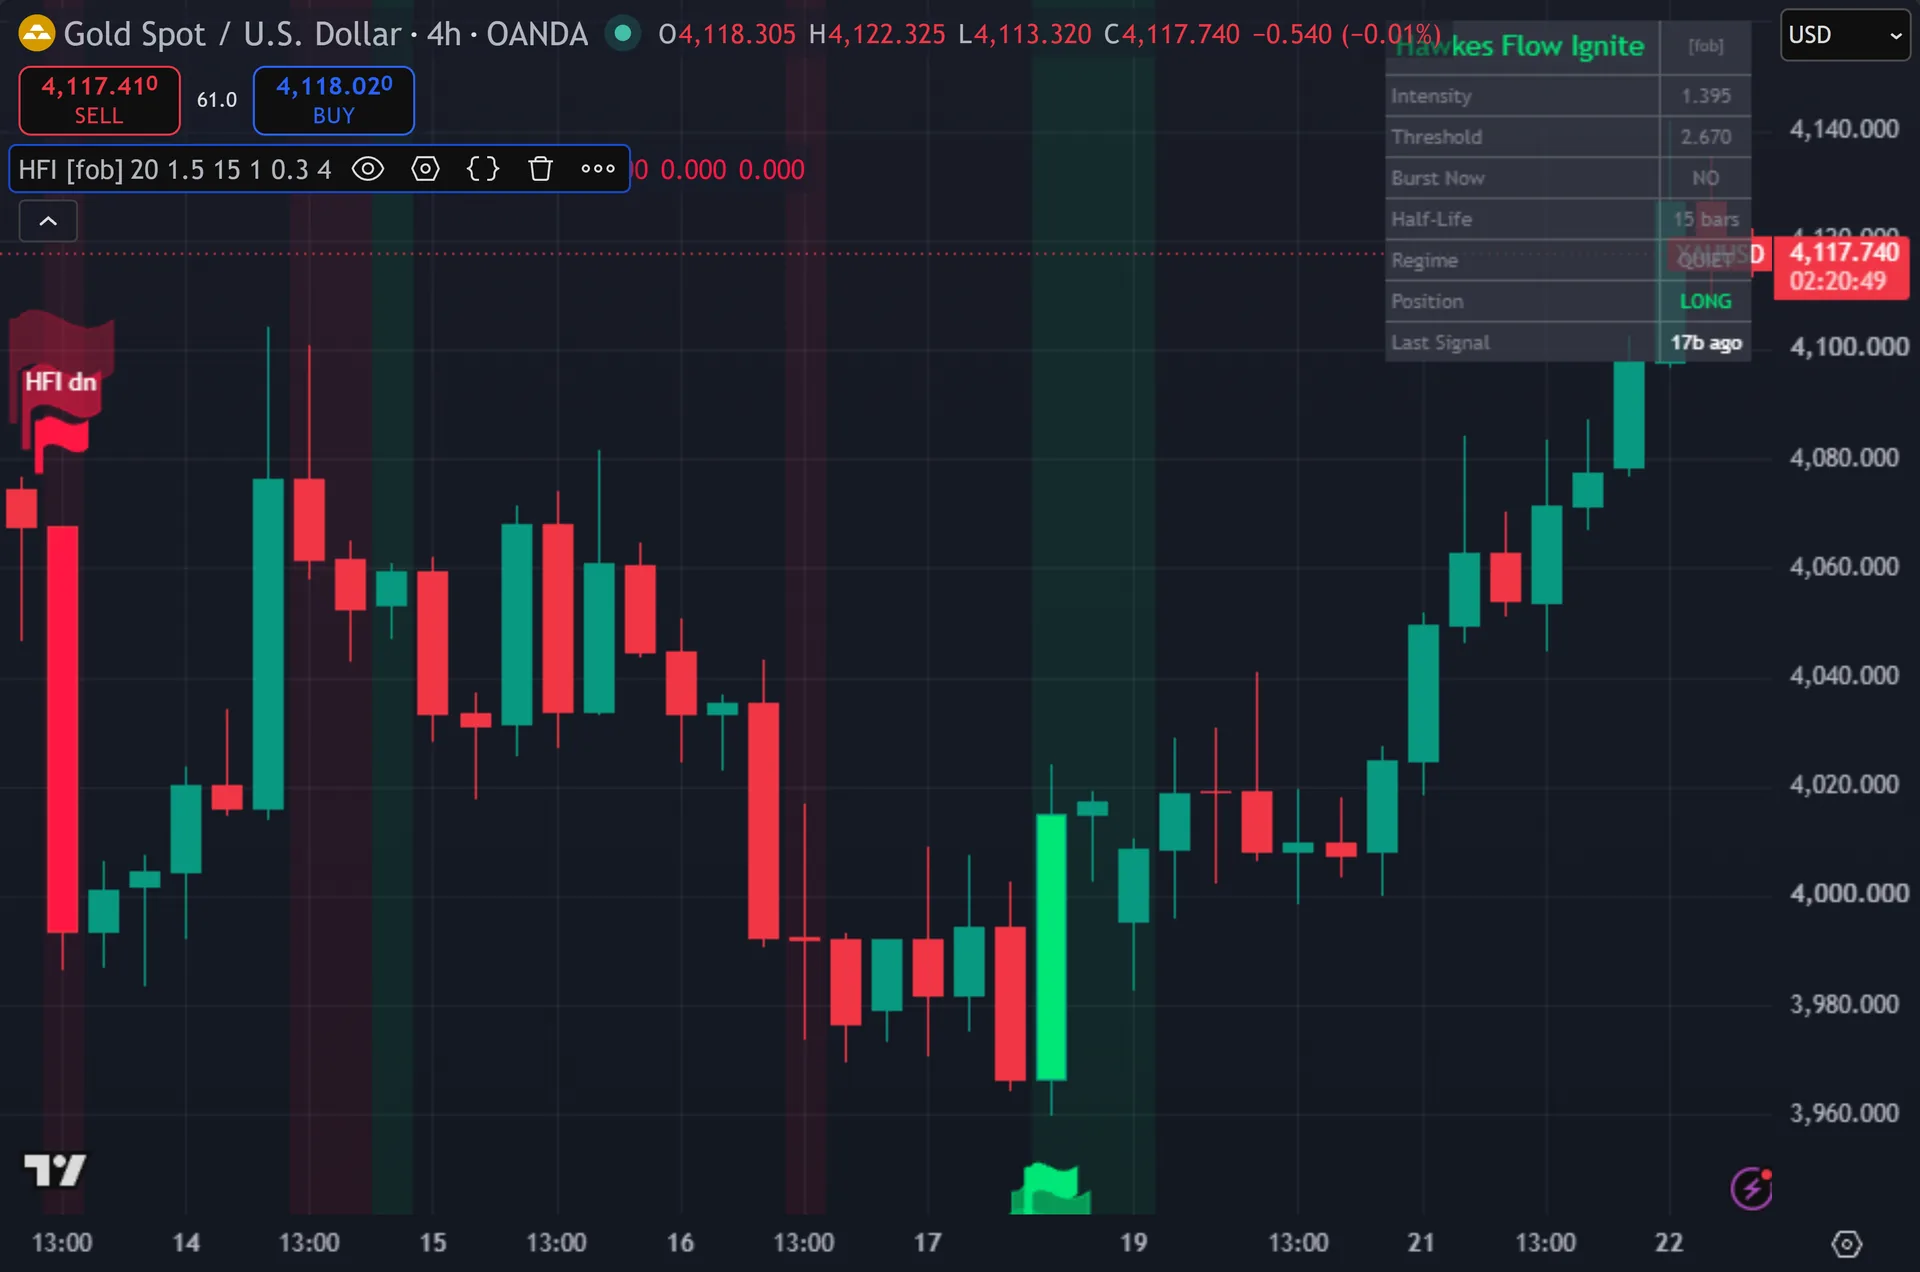
Signals print as flags, three layers deep. Thus, a huge translucent flag sits under a buy bar, a large one over it, then a solid flag carries the text HFI up. Sell signals mirror that above the bar with HFI dn. Hence, the script also paints the signal bar and tints the chart background while the cluster regime holds. A dashboard sits in the top right corner. Next, eight rows report intensity, the live threshold, whether this bar counts as a burst, the half-life, the regime, position state and bars since the last signal.
How Hawkes Flow Ignite is built
Step one: build the intensity
The script first defines a burst. Then, it takes a 20-bar simple average of volume and a 20-bar standard deviation. A bar counts as a burst when volume clears mean plus 1.5 standard deviations. Yet, that is a z-score gate, so it adapts to the instrument and the session. Quiet hours trigger nothing. A genuine surge registers.
Then comes the Hawkes step. Truly, the script computes a decay factor of exp(-ln2 / 15) from the default 15-bar half-life. That lands near 0.955 per bar. Plainly, each new bar multiplies the previous intensity by that factor, then adds 1.0 if this bar bursts. So one burst leaves a mark that fades to half strength after 15 bars. Also, three bursts close together stack into a much taller reading. The intensity therefore measures clustering, not a lone spike.
Step two: gate the signal
Raw intensity means little on its own. Indeed, the script compares it against its own history: a 100-bar average and a 100-bar standard deviation. A cluster regime starts when intensity rises above that mean plus 1.0 standard deviations. Still, the threshold moves with the chart, so a busy crypto pair and a slow currency cross both get a fair test.
A cluster alone triggers nothing. Thus, the script also demands a decisive bar. It measures close minus open against ATR over 14 bars. Hence, a buy needs close minus open above 0.30 ATR. A sell needs it below minus 0.30 ATR. Next, both conditions must hold on the same bar.
Two more gates finish the job. Then, a position lock stores the last signal direction, so the script will not fire two buys in a row inside one cluster. A four-bar cooldown spaces signals further apart. Yet, every signal also waits for barstate.isconfirmed, so nothing prints until the bar closes.
How to read the signals
Start with the dashboard, not the flags. Truly, the Intensity row against the Threshold row tells you the regime. When intensity sits well above threshold, flow is clustering and the background tint switches on. Plainly, low, flat intensity means the tape has gone quiet, so expect no signals at all.
Treat the flag as a timing mark inside an active cluster. Also, the maths says bursts arrived together and a decisive bar then printed in one direction. It says nothing about where price sits in the wider structure. Indeed, pair it with your own levels.
Watch the Position row for context. Still, it reads LONG, SHORT or FLAT and reflects the internal lock, not a real trade. A LONG state blocks further buy flags until a sell fires. Thus, so a quiet stretch after one signal may mean the lock still holds, not that flow stopped.
Every Hawkes Flow Ignite setting explained
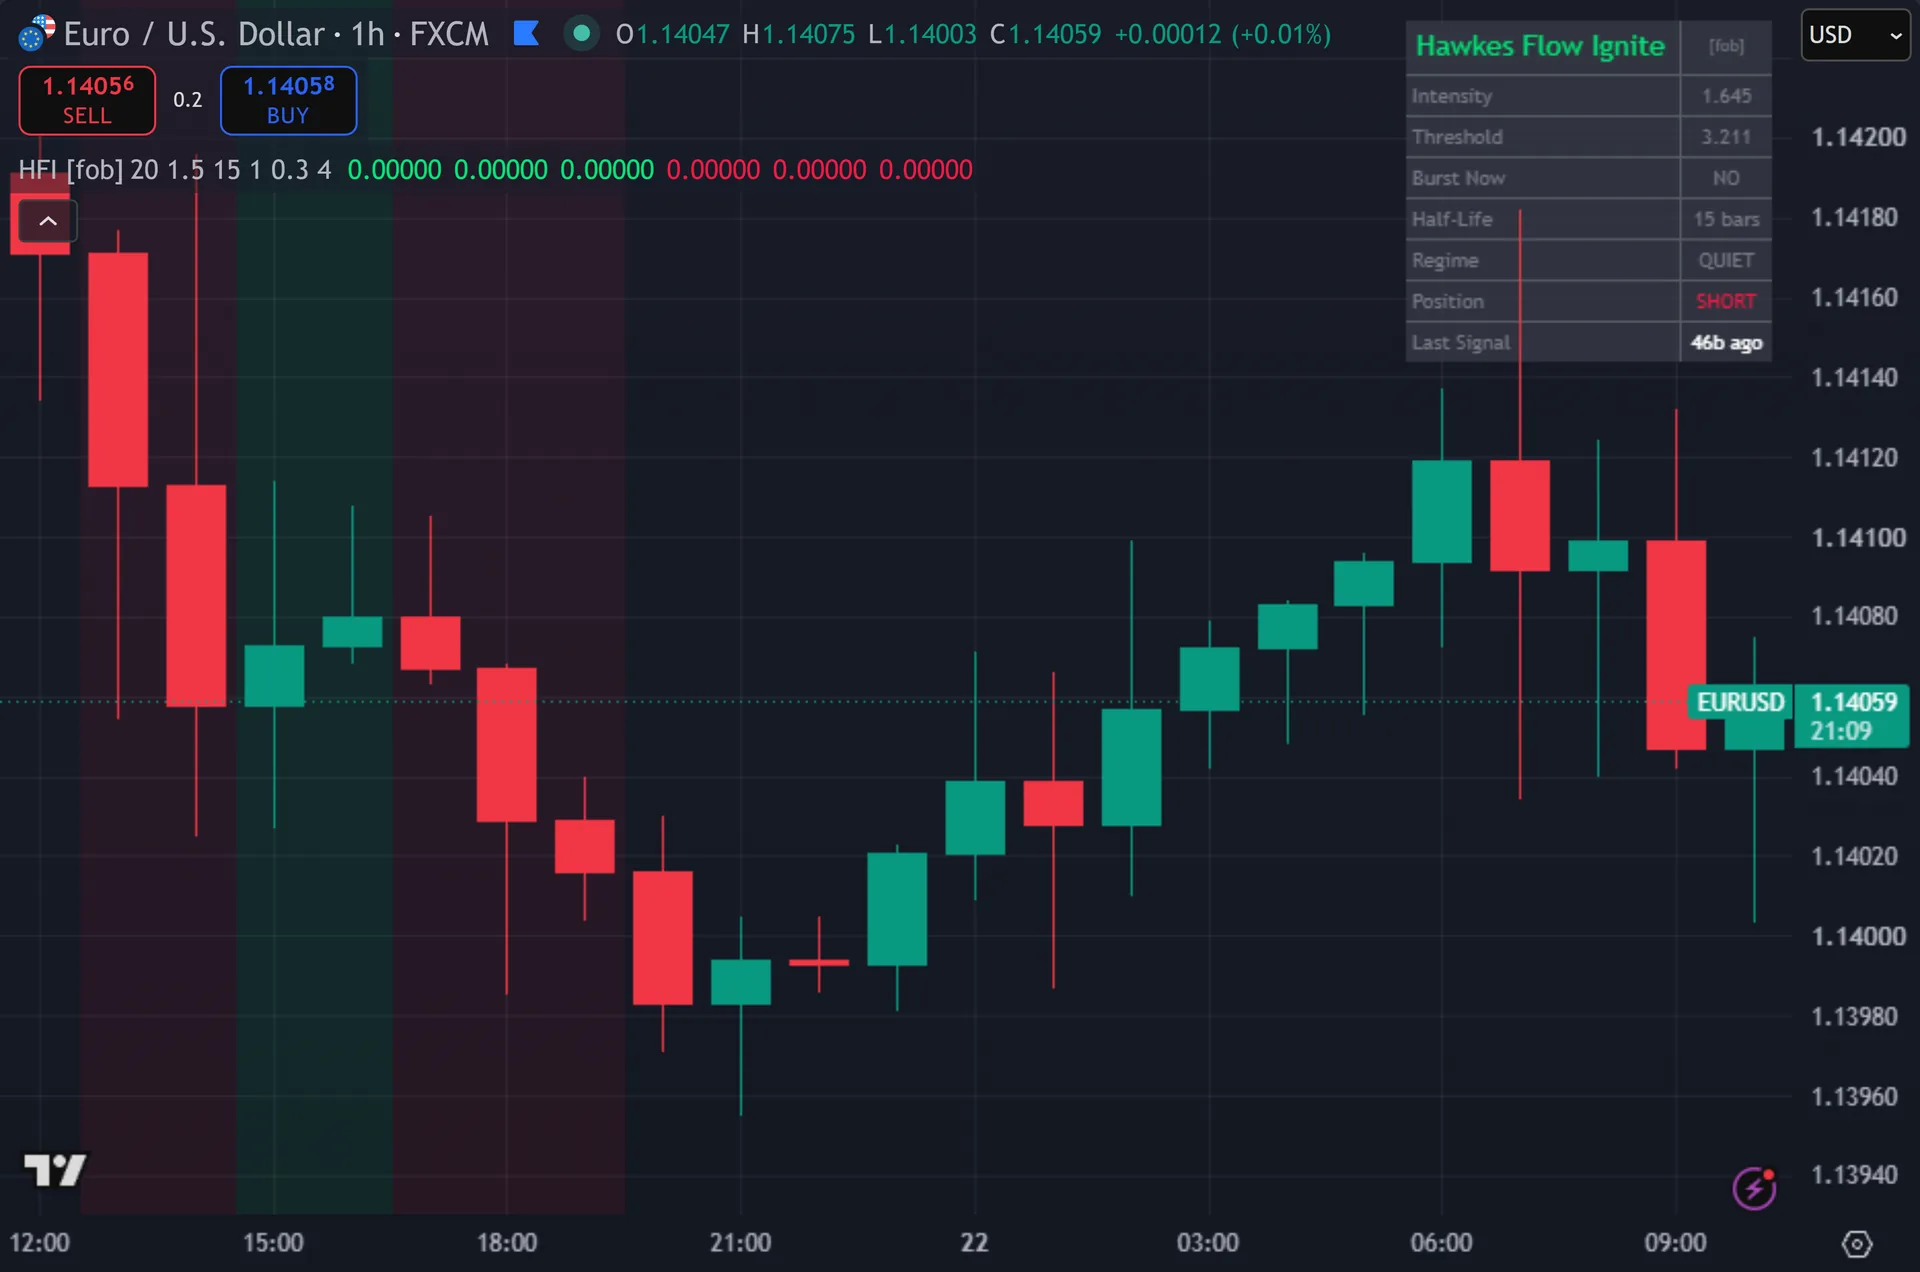
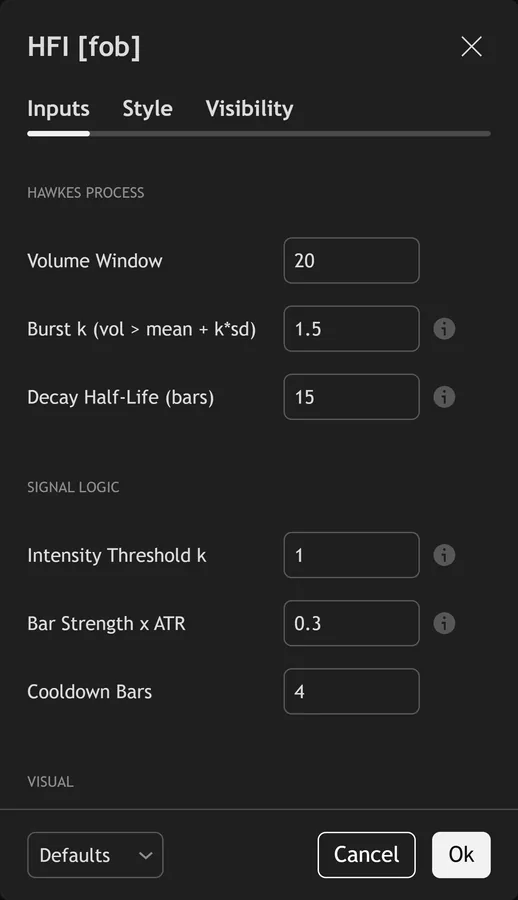
The script exposes 10 inputs, grouped in the settings panel exactly as shown below. Defaults are the published values.
Hawkes Process
| Setting | What it does | Default | Range |
|---|---|---|---|
| Volume Window | Sets the volume window used in the calculation. | 20 | 10 to 100 |
| Burst k (vol > mean + k*sd) | Z-score threshold for a volume bar to count as a burst event. | 1.5 | 0.5 to 4.0 |
| Decay Half-Life (bars) | Bars over which an excitation decays to half. Smaller = faster reset. | 15 | 3 to 50 |
Signal Logic
| Setting | What it does | Default | Range |
|---|---|---|---|
| Intensity Threshold k | Cluster regime when intensity > mean + k*sd. | 1.0 | 0.2 to 4.0 |
| Bar Strength x ATR | Entry only on bars where |close-open| >= k*ATR. | 0.30 | 0.05 to 2.0 |
| Cooldown Bars | Sets the cooldown bars used in the calculation. | 4 | 1 to 20 |
Visual
| Setting | What it does | Default | Range |
|---|---|---|---|
| Show Dashboard | Toggles show dashboard on the chart. | on | on / off |
| Show 3-Layer Glow | Toggles show 3-layer glow on the chart. | on | on / off |
| Buy Color | Colour used for buy color. | #00e676 | |
| Sell Color | Colour used for sell color. | #ff1744 |
Alerts built into Hawkes Flow Ignite
The script ships 11 alert conditions. Hence, open the alert dialog on the chart, pick the indicator as the condition source, then choose the event you want. Alerts fire on the close of the bar, so they follow the same confirmed-bar rule the on-chart signals use.
- HFI Buy
- HFI Sell
- HFI Any Signal
- HFI Cluster Start
- HFI Cluster End
- HFI Burst
- HFI Strong Up Bar
- HFI Strong Dn Bar
- HFI Webhook JSON
Other markets and timeframes
Every threshold here stays relative. Next, bursts use a z-score on volume, the cluster gate uses standard deviations of intensity, and bar strength scales with ATR. No input hard-codes a pip or dollar value. Then, so the defaults carry over to indices, gold, crypto and equities without retuning. The one real dependency is volume. Yet, spot forex reports broker tick volume rather than exchange volume, so the burst test runs on a proxy. Instruments with no volume feed produce no bursts at all.
Limitations worth knowing
This is a flow-clustering detector, not a trading system. Truly, it carries no target, no stop and no position sizing. The dashboard Position row tracks its own lock state and nothing more.
Intensity needs history. Plainly, the rolling threshold reads 100 bars of intensity, and the script declares a max_bars_back of 500. On a freshly loaded chart with thin history, give the threshold time to settle before you lean on it.
Clusters and decisive bars do not fix direction. Also, a burst cluster can mark a violent reversal just as easily as a continuation. The 0.30 ATR test only picks the side that moved on that one bar. Indeed, raise the bar strength input if you want fewer, blunter marks.
Get Hawkes Flow Ignite on TradingView
Open Hawkes Flow Ignite on TradingView
If you also trade MetaTrader, the MT4 and MT5 indicator library is available below.
Get the complete indicator library
One email unlocks the full MT4 and MT5 indicator library. Still, this TradingView script stays free on TradingView – the button above adds it to your chart.
Using it alongside MetaTrader
Adding a script on TradingView takes one click, so there is no install step here. Thus, if you want the same idea on MetaTrader, the MT4 and MT5 indicator installation guide walks through copying files into the data folder and attaching them to a chart. You can also browse the full MetaTrader indicator library, the MT4 indicators section, or the other free TradingView scripts published on this profile. For related chart tools see the MT5 indicators section and the forex trading strategies guides.
External references
Frequently asked questions
Does Hawkes Flow Ignite repaint?
No. Hence, both signals gate on barstate.isconfirmed, so a flag prints only after the bar closes. The intensity value itself updates during the live bar, and the dashboard shows that. Next, historical flags stay exactly where they landed.
What is a Hawkes process, in plain terms?
It is a model where events make further events more likely. Then, each volume burst lifts the intensity by 1.0, and that lift decays with a 15-bar half-life. Bursts arriving close together stack up. Yet, isolated bursts fade out before they matter.
Why do I see the background tint but no flag?
The tint marks the cluster regime alone. Truly, a flag also needs a bar whose body clears 0.30 ATR in one direction, plus the four-bar cooldown, plus a position state that allows that side.
Which half-life should I use?
Shorter half-lives reset faster and suit intraday charts. Plainly, the default of 15 bars keeps one burst relevant for roughly 15 bars. Push it toward 50 on higher timeframes if you want intensity to carry across sessions.
How much should I rely on this indicator?
Treat it as one input, not a decision. Also, it is a chart analysis tool, not trading advice. Test it on your own markets and timeframes before relying on it. Results are not guaranteed; past performance is not indicative of future results.

About the author
Written by Dominic Walsh, a Forex trader and MT4/MT5 indicator, Expert Advisor and script developer. Every tool on forexmt4systems.com is tested on live charts before release and ships with ready-to-use compiled MT4 (.ex4) and MT5 (.ex5) files. Learn more about the trader and developer behind this site.
How we build, test and correct every tool: Editorial & Testing Policy. Trading carries risk; see the disclaimer.