
Higuchi Fractal Dimension asks one question before anything else. Is this market smooth enough to trend? This fractal dimension indicator TradingView traders can add to any chart measures the length of the price curve at two step sizes. Also, it then reads the dimension D from the ratio. A D near 1.0 means a clean path. Indeed, a D near 2.0 means noise. Signals fire only below your smooth threshold, 1.65 by default.
It is free and open source. Still, you can add it to any chart from the Higuchi Fractal Dimension script page on TradingView, and the full Pine source is published there for you to read.
What Higuchi Fractal Dimension plots on the price chart
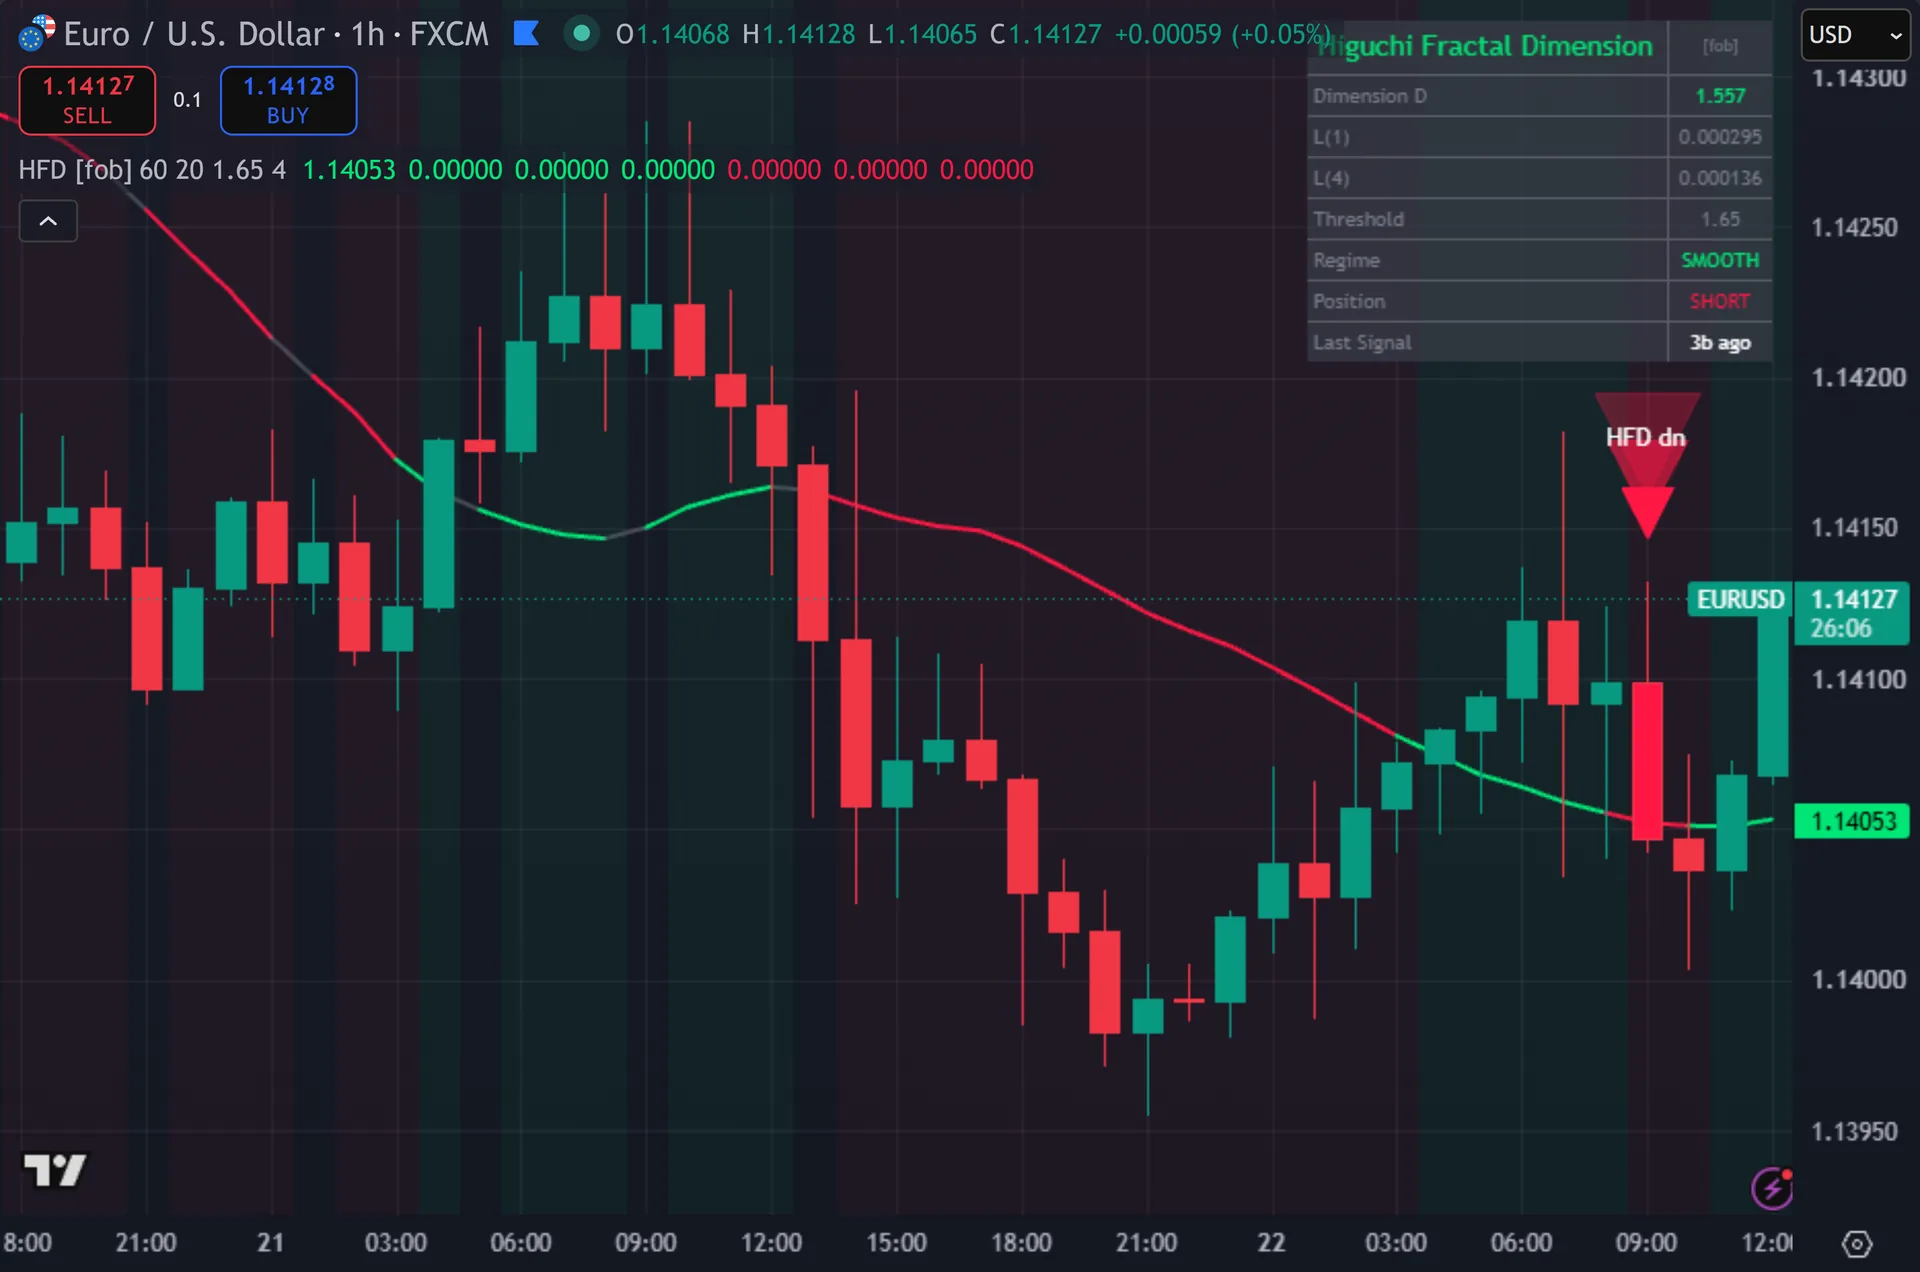
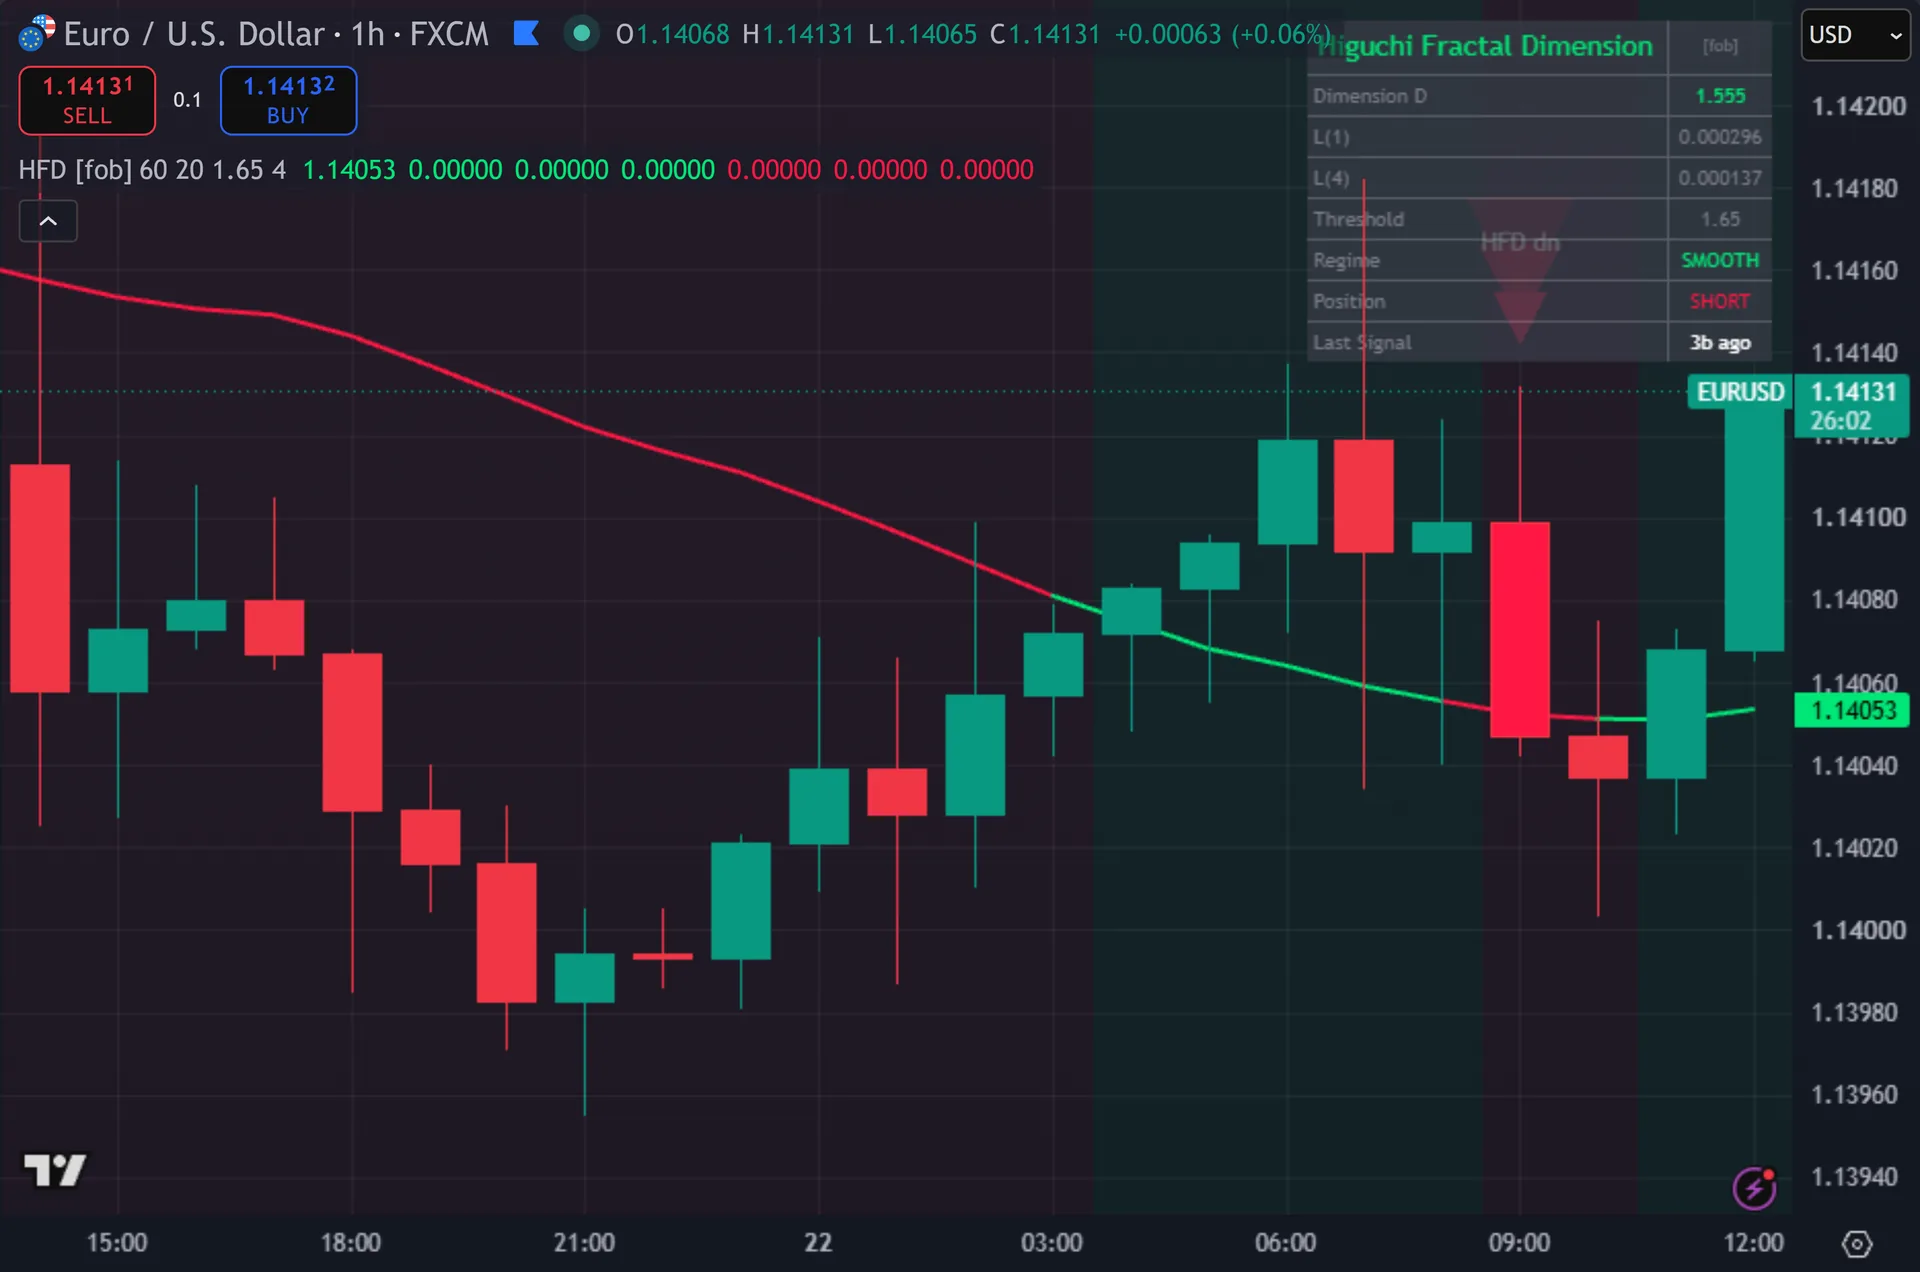
A 20 period SMA carries the whole read. Thus, it turns green when price sits above it in a smooth regime, red when price sits below, and gray whenever D rises past your threshold. A faint background tint marks every smooth bar. Hence, triangles print in three glow layers at entries, carrying an HFD up or HFD dn tag, and the script colours the signal bar. The dashboard holds eight rows: the dimension to three decimals, the raw L(1) and L(4) curve lengths and your threshold. Next, three more rows give the regime word SMOOTH or JAGGED, the position state and bars since the last signal.
How Higuchi Fractal Dimension is built
What the Higuchi method computes
Higuchi published the curve length method in 1988 in Physica D. The idea is simple. Walk a time series with a step of k bars, sum the absolute moves, then normalise the total. Then, repeat for several values of k. Plot log L(k) against log k, and the slope gives the fractal dimension D, bounded between 1 and 2.
The published method runs k from 1 up to a chosen k_max. For each k it also averages across k different starting offsets, then fits a least squares line through every point. This script uses a lighter version. Yet, it measures two scales only, k=1 and k=4, from a single starting offset. It then takes the two point log ratio directly: D = log(L1 / L4) / log(4) + 1.
The calibration still matches the published scale. Truly, a straight line makes a 4 bar move four times the size of a 1 bar move, so D lands at 1.0. A random walk scales with the square root of time, so D lands near 1.5. Plainly, a perfect zigzag returns 2.0. The script clamps the result into that 1 to 2 range.
From dimension to signal
The window sets how much history feeds the estimate. Also, it defaults to 60 bars, which gives 59 single bar steps for L(1) and only 14 four bar steps for L(4). That small second sample is why D jitters from bar to bar. Indeed, raise the window toward its 200 bar maximum for a steadier reading.
A regime flag follows. Still, smooth means D at or below your threshold, and 1.65 is the default. Anything above that reads JAGGED, and the script stops looking for entries. Thus, a pure random walk sits near 1.5, so the default still lets moderately noisy conditions qualify. Lower it toward 1.40 if you want only the cleanest stretches.
Entries need a close cross of the 20 period SMA inside a smooth regime. Hence, the script also tests price against the SMA, which the cross already implies. Three gates then apply. Next, the bar must close through barstate.isconfirmed, four bars must pass after the last signal, and the position state must not already sit on that side.
How to read the signals
Use D as a filter, not as a signal. It says nothing about direction. A reading of 1.2 tells you the last 60 bars traced a fairly straight path. Then, whether that path ran up or down comes from the SMA.
Watch the SMA colour. Yet, gray means the script has stood down, because price keeps folding back on itself. Trend following entries tend to struggle in that texture. Truly, a coloured SMA means the regime test passed.
D always describes the window that just ended. Plainly, when a trend starts, D needs bars to fall. When a trend dies, D needs bars to rise. Also, so expect the smooth flag to arrive after the move began, and to linger a while after it ends.
Every Higuchi Fractal Dimension setting explained
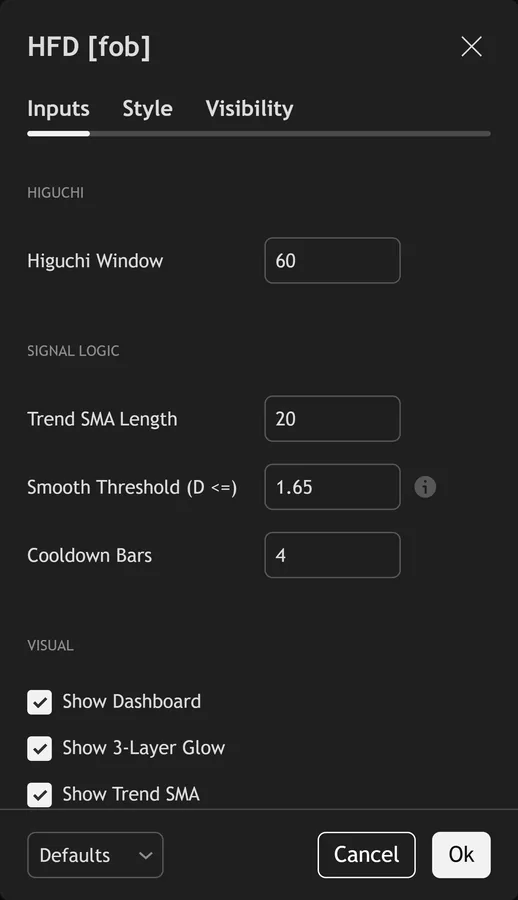
The script exposes 9 inputs, grouped in the settings panel exactly as shown below. Defaults are the published values.
Higuchi
| Setting | What it does | Default | Range |
|---|---|---|---|
| Higuchi Window | Sets the higuchi window used in the calculation. | 60 | 20 to 200 |
Signal Logic
| Setting | What it does | Default | Range |
|---|---|---|---|
| Trend SMA Length | Sets the trend sma length used in the calculation. | 20 | 5 to 100 |
| Smooth Threshold (D <=) | Below this = smooth/trending. Random walk hits ~1.5; pure trend ~1.0; pure noise ~2.0. | 1.65 | 1.05 to 1.95 |
| Cooldown Bars | Sets the cooldown bars used in the calculation. | 4 | 1 to 20 |
Visual
| Setting | What it does | Default | Range |
|---|---|---|---|
| Show Dashboard | Toggles show dashboard on the chart. | on | on / off |
| Show 3-Layer Glow | Toggles show 3-layer glow on the chart. | on | on / off |
| Show Trend SMA | Toggles show trend sma on the chart. | on | on / off |
| Buy Color | Colour used for buy color. | #00e676 | |
| Sell Color | Colour used for sell color. | #ff1744 |
Alerts built into Higuchi Fractal Dimension
The script ships 11 alert conditions. Indeed, open the alert dialog on the chart, pick the indicator as the condition source, then choose the event you want. Alerts fire on the close of the bar, so they follow the same confirmed-bar rule the on-chart signals use.
- HFD Buy
- HFD Sell
- HFD Any Signal
- HFD Smooth On
- HFD Smooth Off
- HFD Strong Trend
- HFD Strong Chop
- HFD SMA Cross Up
- HFD Webhook JSON
Other markets and timeframes
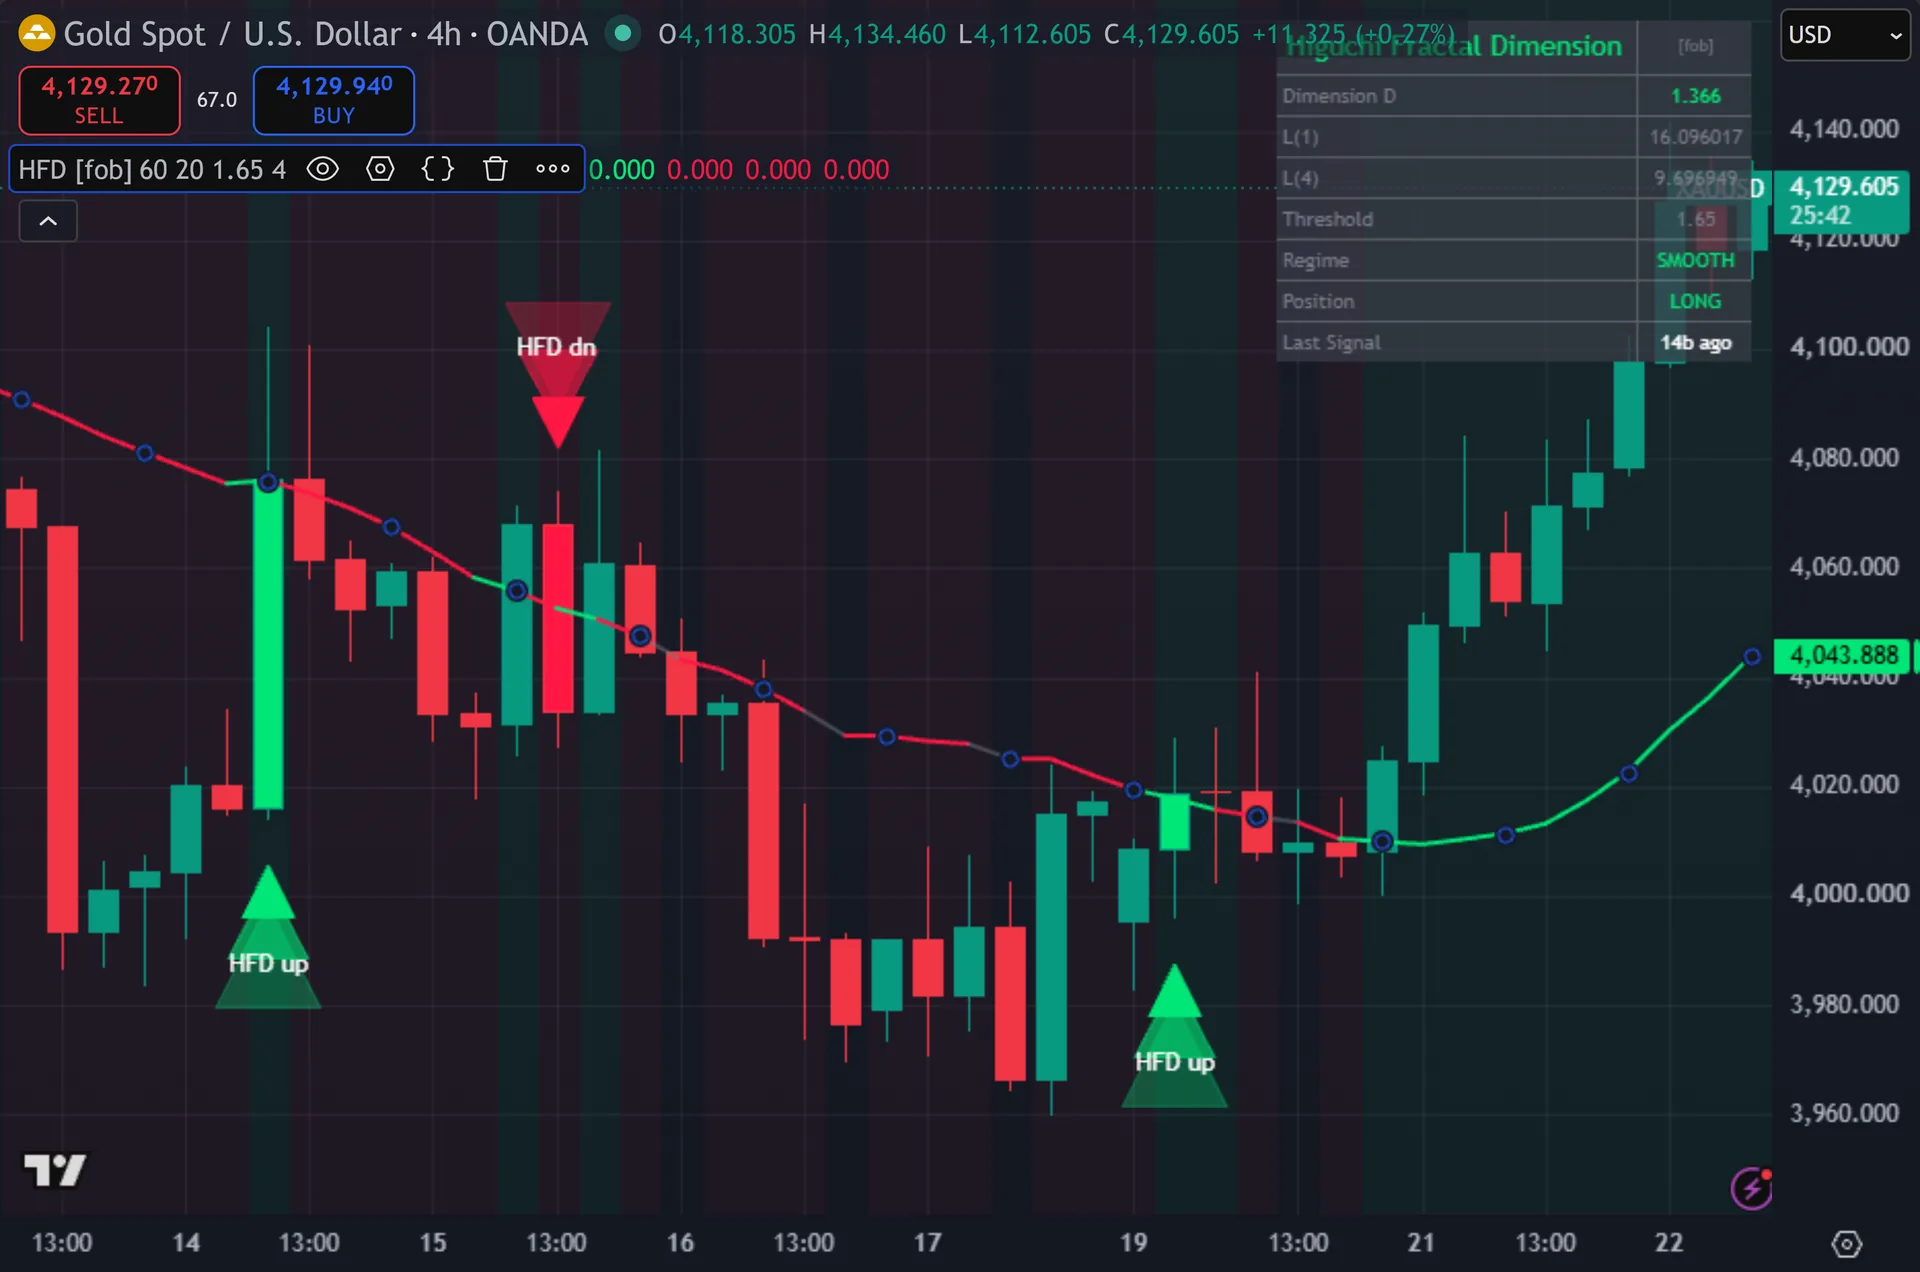
D carries no units, which makes this unusually portable. Still, the estimate divides one curve length by another, so pips, dollars and ticks all cancel out. A threshold of 1.65 means exactly the same thing on EURUSD, gold, Nasdaq and Bitcoin. Thus, volume never enters the calculation either, so symbols with no volume feed still work. Gappy data is the one caveat. Hence, weekend gaps and thin sessions inflate the single bar moves and push D upward.
Limitations worth knowing
The tool measures texture and nothing else. Next, it holds no view on direction, no support levels, no stop, no target and no sizing. The SMA cross that times entries is a plain moving average cross with a regime gate on top.
This is a two point estimate, not the full k_max regression Higuchi described. Then, two scales and one starting offset make it quick to compute and noisier than the published method. Treat any single bar reading as approximate, and watch the trend in D instead.
The clamp between 1.0 and 2.0 hides extremes. Yet, a reading that sits at the 2.0 cap could be mildly or wildly jagged, and the dashboard cannot tell you which. The 4 bar cooldown also suppresses a second cross that follows soon after the first.
Get Higuchi Fractal Dimension on TradingView
Open Higuchi Fractal Dimension on TradingView
If you also trade MetaTrader, the MT4 and MT5 indicator library is available below.
Get the complete indicator library
One email unlocks the full MT4 and MT5 indicator library. Truly, this TradingView script stays free on TradingView – the button above adds it to your chart.
Using it alongside MetaTrader
Adding a script on TradingView takes one click, so there is no install step here. Plainly, if you want the same idea on MetaTrader, the MT4 and MT5 indicator installation guide walks through copying files into the data folder and attaching them to a chart. You can also browse the full MetaTrader indicator library, the MT4 indicators section, or the other free TradingView scripts published on this profile. For related chart tools see the MT5 indicators section and the forex trading strategies guides.
External references
- Stochastic oscillator on Wikipedia
- Stochastic Oscillator at Investopedia
- Raff Regression Channel at StockCharts ChartSchool
Frequently asked questions
Does the Higuchi Fractal Dimension indicator repaint?
No. Also, both signals require barstate.isconfirmed, and the triangles, bar colour and alerts read the same gated variables. The regime background tint does update inside the live bar, because D recalculates on every tick. Indeed, treat that tint as context rather than a signal.
Is this the real Higuchi algorithm?
It is the Higuchi curve length idea in a two point form. Still, his 1988 paper runs k from 1 to k_max, averages across k starting offsets, then fits a regression through log L(k) against log k. This script measures k=1 and k=4 from one offset and takes the direct log ratio. Thus, the output still uses the same 1 to 2 scale.
What threshold should I use?
Start at the 1.65 default and watch how often the SMA turns gray. Hence, a random walk sits near 1.5, so 1.65 keeps most conditions in play. Drop toward 1.40 for far fewer and cleaner marks. Next, the input accepts anything from 1.05 to 1.95.
Which timeframe works best?
Any of them, because the calculation counts bars rather than clock time. Then, higher timeframes give a steadier D, since each bar carries more information. On very fast charts, widen the Higuchi Window above 60 so the L(4) sample stops being so small.
How much should I rely on this indicator?
Treat it as one input, not a decision. Yet, it is a chart analysis tool, not trading advice. Test it on your own markets and timeframes before relying on it. Results are not guaranteed; past performance is not indicative of future results.

About the author
Written by Dominic Walsh, a Forex trader and MT4/MT5 indicator, Expert Advisor and script developer. Every tool on forexmt4systems.com is tested on live charts before release and ships with ready-to-use compiled MT4 (.ex4) and MT5 (.ex5) files. Learn more about the trader and developer behind this site.
How we build, test and correct every tool: Editorial & Testing Policy. Trading carries risk; see the disclaimer.