
Five regressions beat one. Also, inverse-Variance Slope Spectrum works as a trend slope indicator TradingView traders can add to any chart, and it never trusts a single length. It fits regressions over 10, 20, 34, 55 and 89 bars at once. Each one reports a slope. Each one also reports how tightly price hugged its own fit line. Indeed, the cleaner fits then carry more weight in the final consensus slope.
It is free and open source. Still, you can add it to any chart from the Inverse-Variance Slope Spectrum script page on TradingView, and the full Pine source is published there for you to read.
What Inverse-Variance Slope Spectrum plots on the price chart
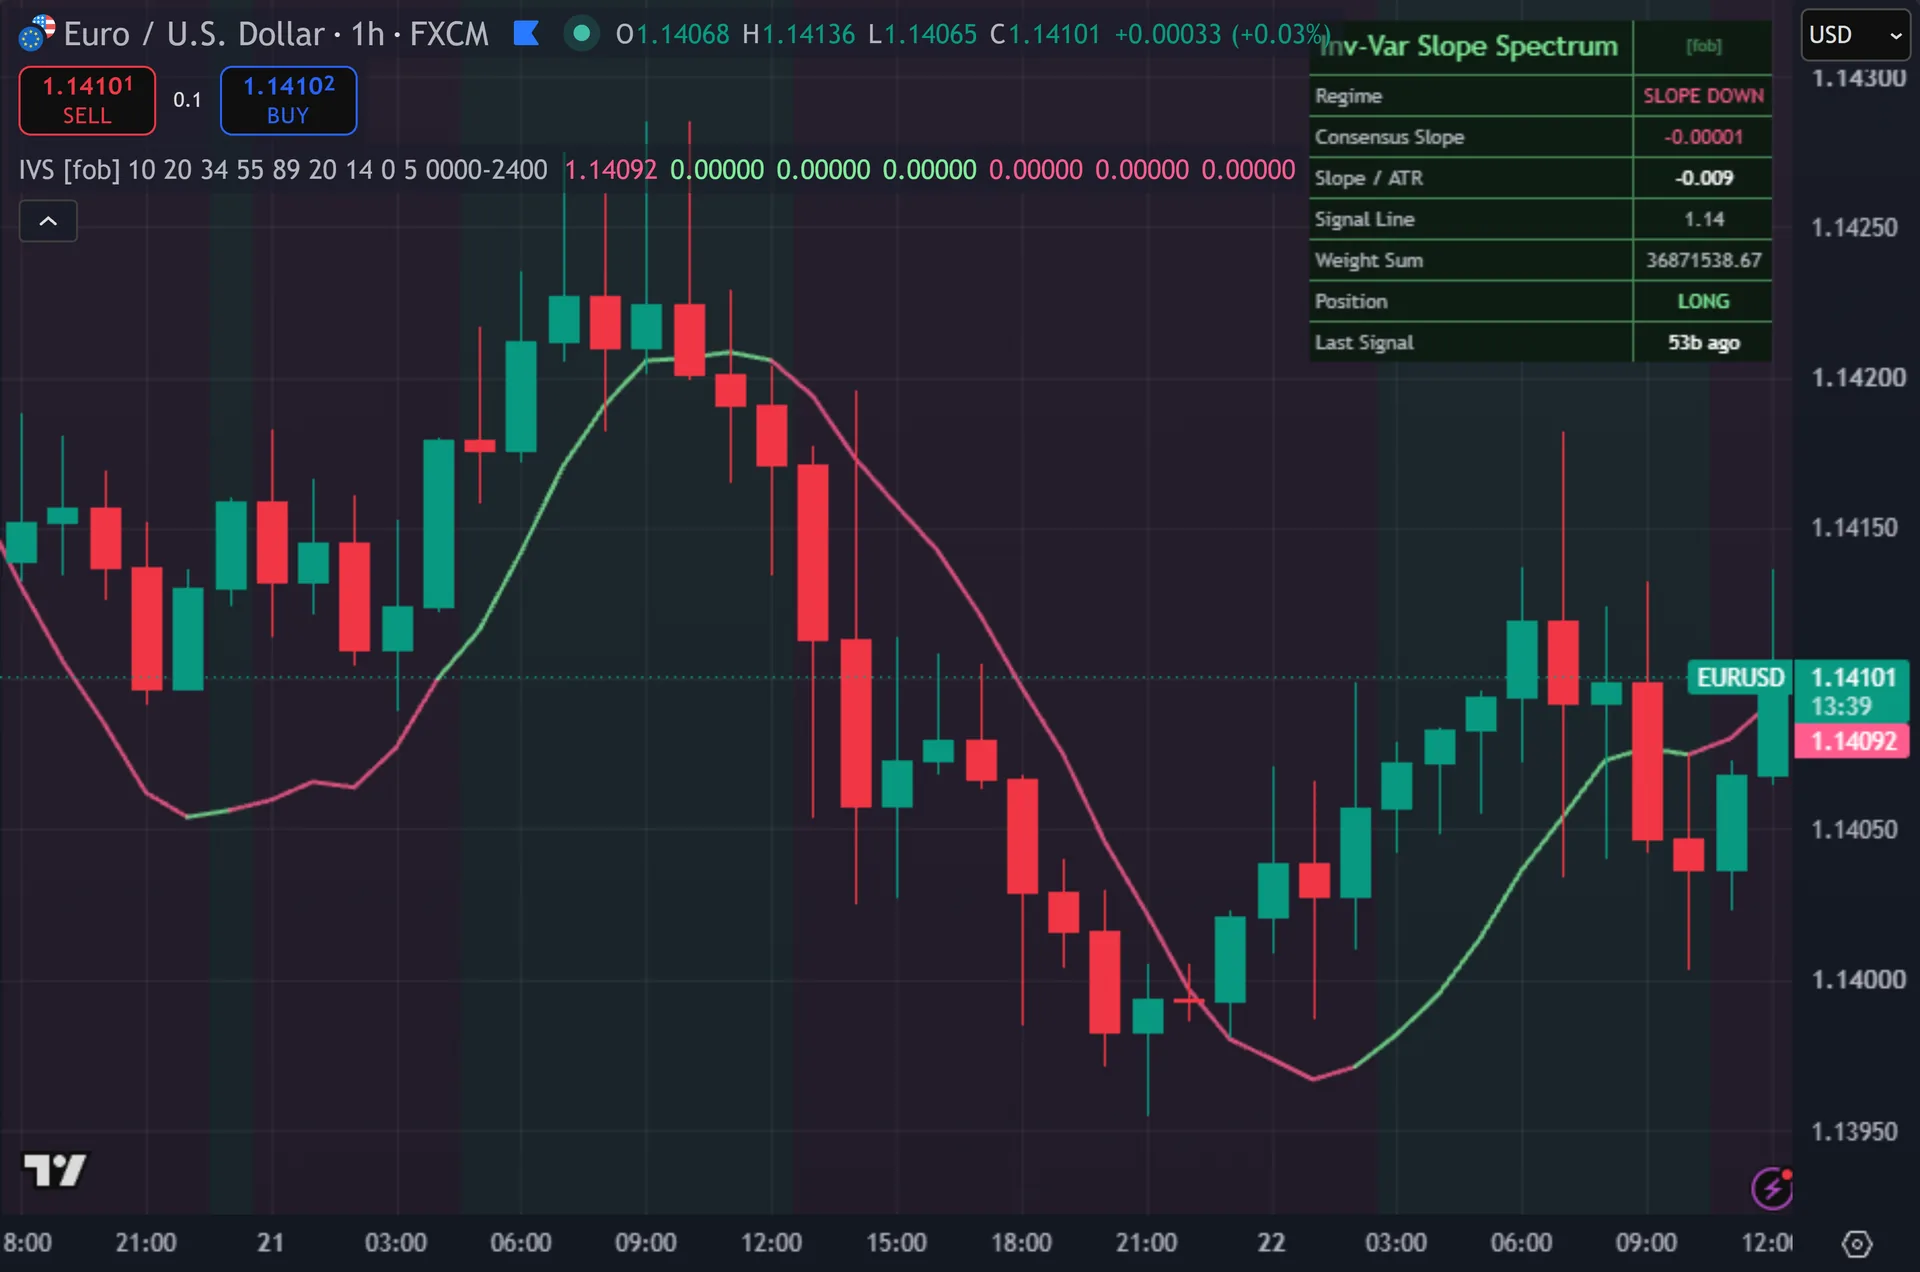
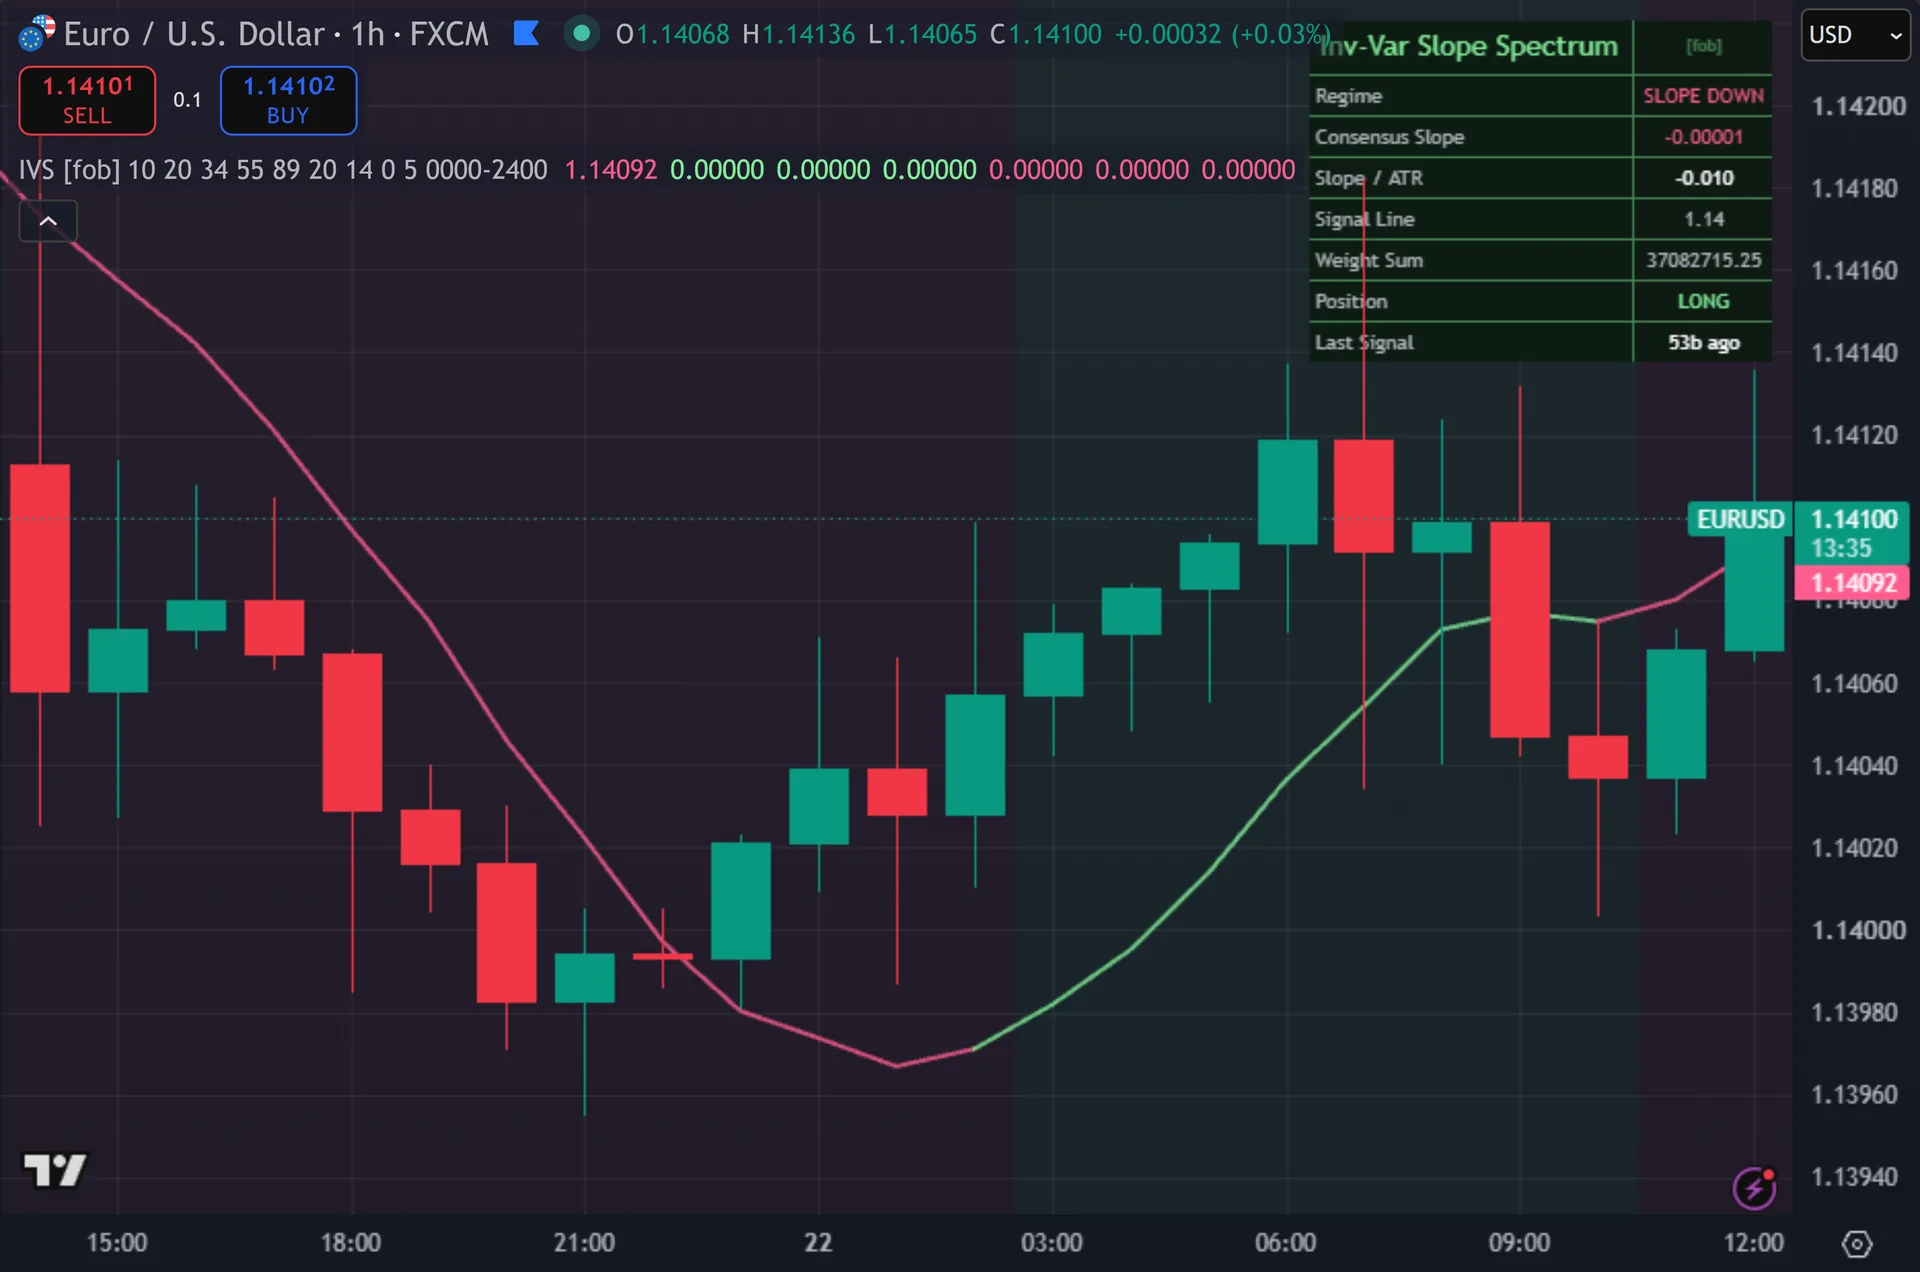
The script plots one line: a 20-bar linear regression of close, tinted green when the consensus slope reads positive and pink when it reads negative. Thus, entry marks print as triangles below or above the bar, each tagged IVS, with two softer copies behind them for the glow. The signal bar takes its own colour, and the chart background carries a faint tint that tracks the current slope regime. Hence, a dashboard in the top right lists regime, consensus slope, slope divided by ATR, the signal line value, summed weights, position state and bars since the last signal.
How Inverse-Variance Slope Spectrum is built
Five regressions, one consensus
The script runs the same routine five times, over 10, 20, 34, 55 and 89 bars. Next, each pass takes the current linear regression value and subtracts the value one bar back. That difference is the slope of the fit line, expressed in price per bar. Then, short lengths react fast and jump around. Long lengths move slowly and stay calm. Neither one wins by default.
Weighting settles the argument. For each length the script measures correlation between close and bar index, squares it, then multiplies price variance by one minus that figure. The result is residual variance, the part of the move the straight line failed to explain. Yet, the weight is one divided by that residual variance. A regression that fits tightly earns a large weight. Truly, a regression that fits poorly nearly drops out. The consensus slope is the weighted average of all five slopes.
The name says spectrum, so be clear on what that means here. Plainly, there is no Fourier transform and no wavelet basis. Spectrum here simply means five regression lengths running side by side, from 10 up to 89.
How a signal clears the gates
The sign of the consensus slope sets the regime. Also, positive means up, negative means down, and exactly zero means flat. A separate 20-bar linear regression acts as the signal line. Indeed, a buy needs price to cross above that line while the regime reads up. A sell needs the mirror image.
Four gates then apply. Still, the bar must close, because the script checks barstate.isconfirmed before it prints anything. The position state must not already sit long for a buy or short for a sell, so marks alternate rather than stack. Thus, at least five bars must have passed since the last signal. An optional session window can also block signals outside your chosen hours, and it ships off at 0000-2400.
One more filter exists but arrives disabled. Hence, min |Slope| x ATR defaults to 0.00, so the strength test passes on every bar. Raise it to 0.20 or 0.30 and the script then demands a consensus slope of at least that many ATR units before it fires.
How to read the signals
Read the background tint first. Next, it tells you which way the weighted consensus points before any triangle appears. Favour marks that agree with a tint which has held for a while, rather than ones that appear the moment the tint flips.
The Slope / ATR row scales the raw slope into something comparable across symbols. Then, a reading of 0.05 means the consensus fit climbs five percent of an ATR per bar. Values near zero mean the five regressions disagree, or price simply drifts sideways.
The Weight Sum row shows how well the fits track price as a group. Yet, it rises when price hugs its regression lines and collapses when price scatters. A signal that lands while weight sum sits far below its recent range came from slopes that fit the data badly.
Every Inverse-Variance Slope Spectrum setting explained
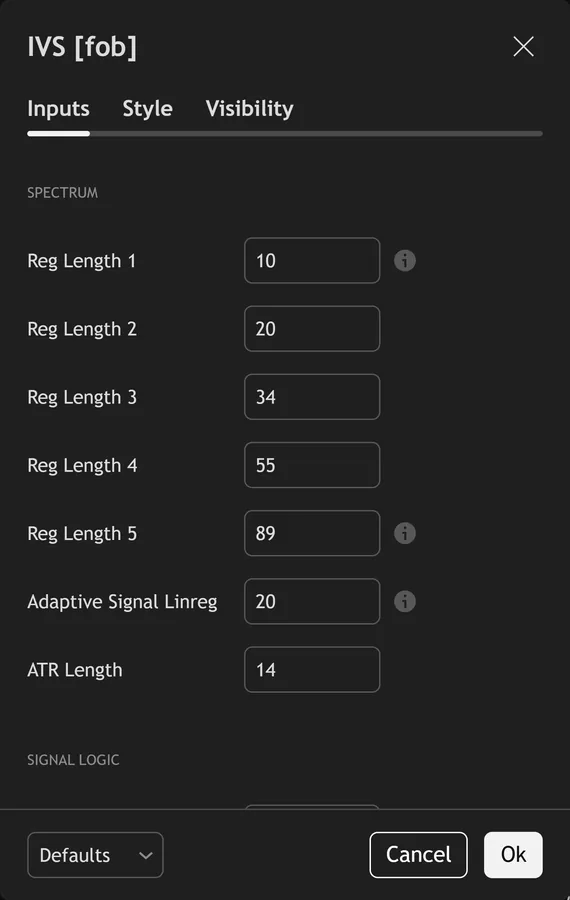
The script exposes 17 inputs, grouped in the settings panel exactly as shown below. Defaults are the published values.
Spectrum
| Setting | What it does | Default | Range |
|---|---|---|---|
| Reg Length 1 | Shortest regression in the spectrum. | 10 | 4 to 200 |
| Reg Length 2 | Sets the reg length 2 used in the calculation. | 20 | 4 to 200 |
| Reg Length 3 | Sets the reg length 3 used in the calculation. | 34 | 4 to 200 |
| Reg Length 4 | Sets the reg length 4 used in the calculation. | 55 | 4 to 200 |
| Reg Length 5 | Longest regression in the spectrum. | 89 | 4 to 200 |
| Adaptive Signal Linreg | Linreg length used as the entry signal line. | 20 | 4 to 100 |
| ATR Length | Sets the atr length used in the calculation. | 14 | 5 to 50 |
Signal Logic
| Setting | What it does | Default | Range |
|---|---|---|---|
| Min |Slope| x ATR | Optional minimum |consensus slope| (ATR units). | 0.0 | 0.0 to 2.0 |
| Cooldown Bars | Sets the cooldown bars used in the calculation. | 5 | 1 to 40 |
Filters
| Setting | What it does | Default | Range |
|---|---|---|---|
| Restrict to Session | Toggles restrict to session on the chart. | off | on / off |
| Session Window | Controls session window. | 0000-2400 |
Visual
| Setting | What it does | Default | Range |
|---|---|---|---|
| Show Signal Line | Toggles show signal line on the chart. | on | on / off |
| Show Dashboard | Toggles show dashboard on the chart. | on | on / off |
| Show 3-Layer Glow | Toggles show 3-layer glow on the chart. | on | on / off |
| Buy Color | Colour used for buy color. | #80ed99 | |
| Sell Color | Colour used for sell color. | #ff5d8f | |
| Dashboard BG | Colour used for dashboard bg. | color.new(#0a1a0e, 14) |
Alerts built into Inverse-Variance Slope Spectrum
The script ships 14 alert conditions. Truly, open the alert dialog on the chart, pick the indicator as the condition source, then choose the event you want. Alerts fire on the close of the bar, so they follow the same confirmed-bar rule the on-chart signals use.
- IVS Buy
- IVS Sell
- IVS Any Signal
- IVS Slope Bull
- IVS Slope Bear
- IVS Signal Up
- IVS Signal Down
- IVS Slope Zero
- IVS Strong Slope
- IVS Regime Flip
- IVS Any Signal Cross
- IVS Webhook JSON
Other markets and timeframes
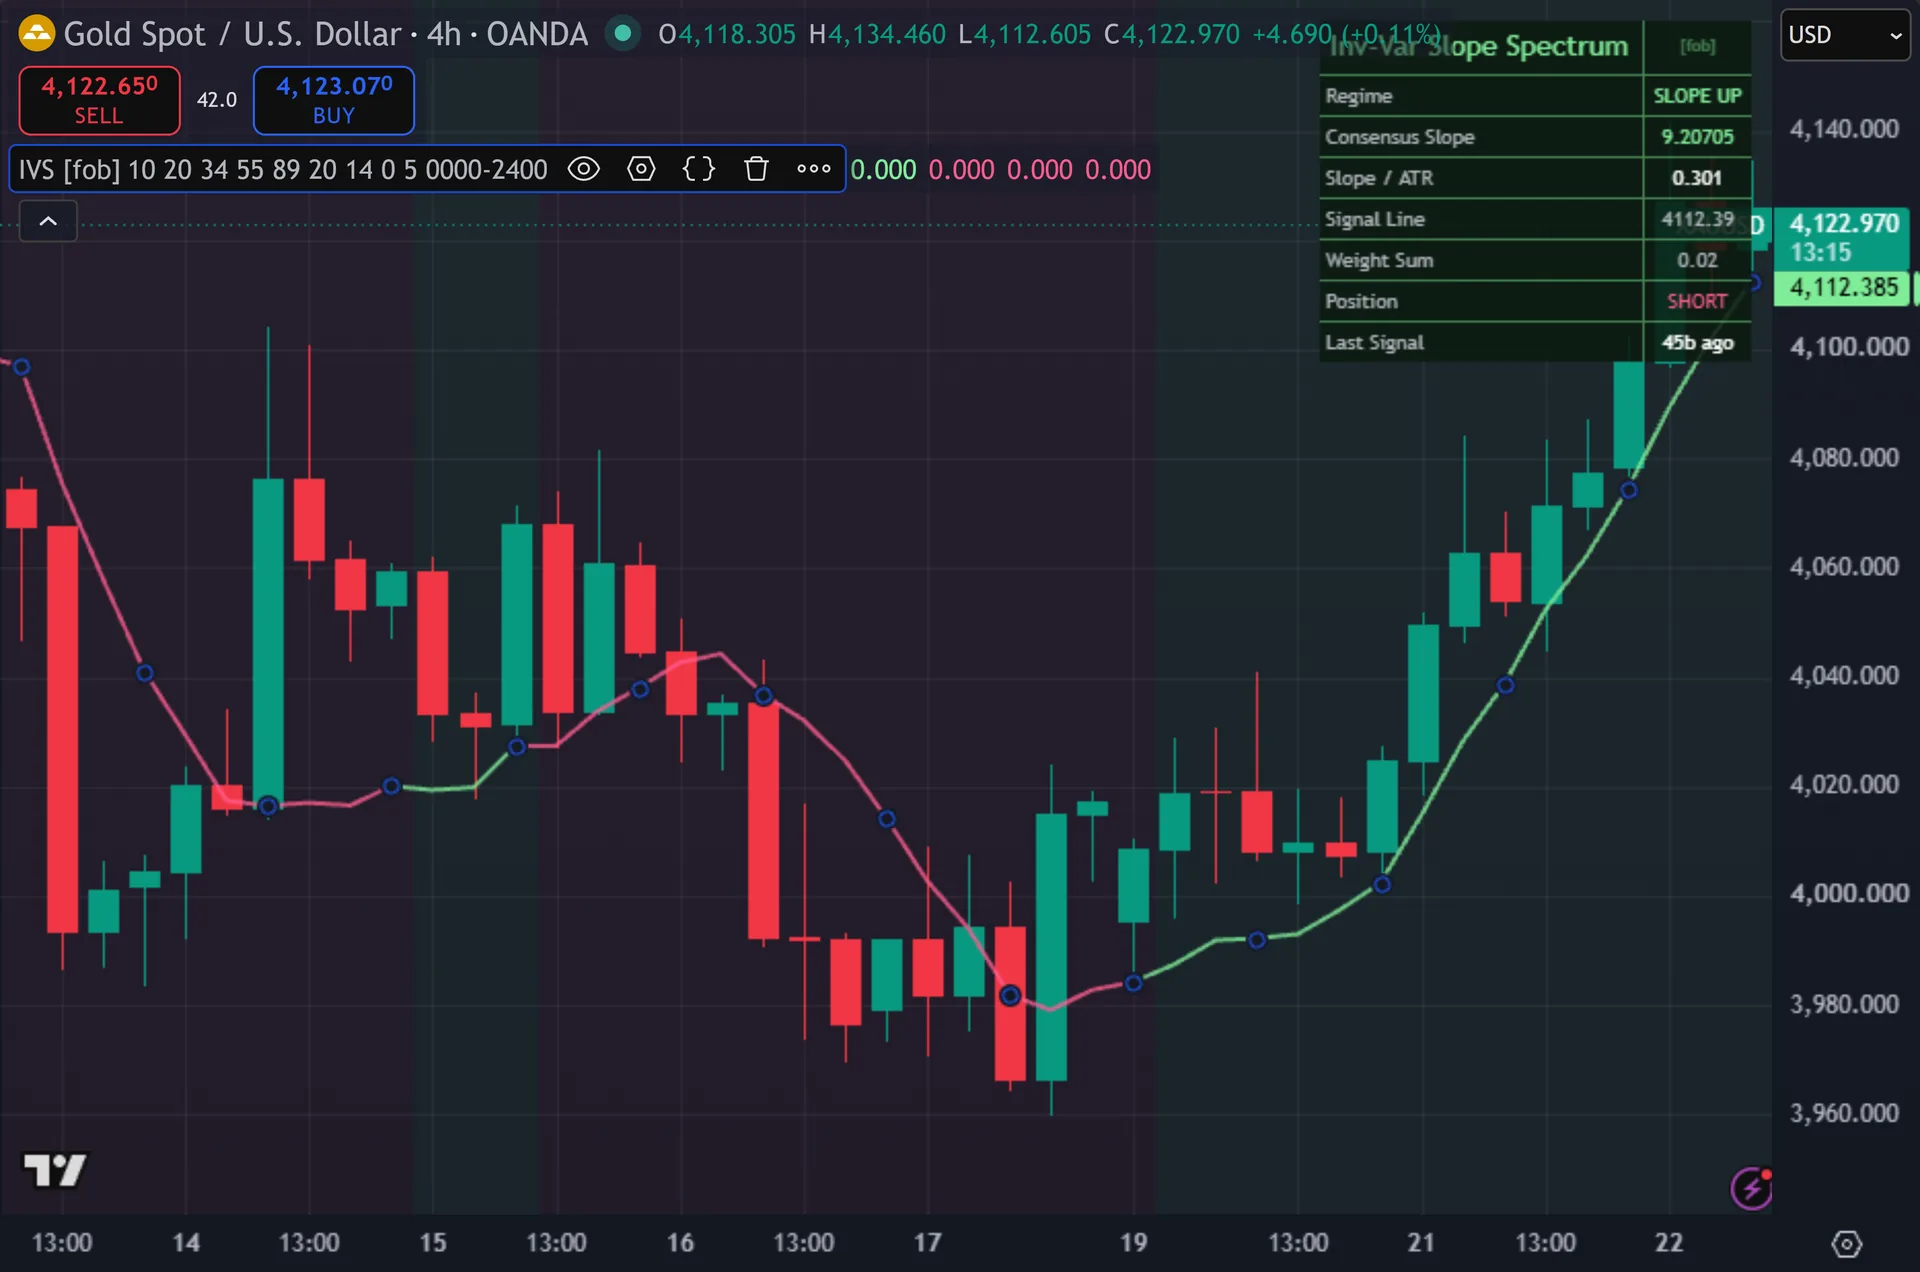
Every threshold in the script stays relative. Plainly, slopes get compared against ATR, weights come from each symbol’s own variance, and the signal line rides its own price. So gold, indices, crypto and equities need no rescaling of the defaults. Also, the regression lengths do change the character though. On a daily chart the 89-bar leg covers over four months, while on a 5-minute chart it covers one session. Indeed, shorten the spectrum on fast charts if the consensus feels sluggish.
Limitations worth knowing
This estimates trend direction. Still, it does not manage a trade. There is no stop, no target, no sizing and no exit beyond an opposite signal flipping the position state. Thus, the dashboard reports a position because the script tracks alternation, not because it tracks your account.
Inverse-variance weighting rewards a tight fit, not a useful one. Hence, a quiet range where price crawls along a flat regression produces low residual variance, and therefore a heavy weight, even though that slope carries almost no information. Read the Slope / ATR row rather than the weights alone.
The IVS Strong Slope alert compares slope magnitude against Min |Slope| x ATR, which ships at 0.00. Next, leave that input alone and the alert fires on every bar. Set a real threshold before you build an alert on it.
Get Inverse-Variance Slope Spectrum on TradingView
Open Inverse-Variance Slope Spectrum on TradingView
If you also trade MetaTrader, the MT4 and MT5 indicator library is available below.
Get the complete indicator library
One email unlocks the full MT4 and MT5 indicator library. Then, this TradingView script stays free on TradingView – the button above adds it to your chart.
Using it alongside MetaTrader
Adding a script on TradingView takes one click, so there is no install step here. Yet, if you want the same idea on MetaTrader, the MT4 and MT5 indicator installation guide walks through copying files into the data folder and attaching them to a chart. You can also browse the full MetaTrader indicator library, the MT4 indicators section, or the other free TradingView scripts published on this profile. For related chart tools see the MT5 indicators section and the forex trading strategies guides.
External references
Frequently asked questions
Does the Inverse-Variance Slope Spectrum repaint?
No. Truly, both signal plotshape calls read buySignal and sellSignal, and each of those requires barstate.isconfirmed. The script marks a bar only after it closes, so the triangle lands at the open of the next candle. Plainly, historical marks match what you would have seen live.
Why five regression lengths instead of one?
A single length forces a fixed compromise between speed and noise. Also, five lengths let the data choose. The 10-bar fit dominates when short swings run clean. Indeed, the 89-bar fit dominates when the longer structure is the tidy one. Weights shift bar by bar.
Is it multi-timeframe?
No. Still, the script contains no request.security call. Every calculation reads the chart timeframe you have open. Thus, open a second chart if you want a higher-timeframe view of the same consensus slope.
What does Weight Sum mean on the dashboard?
It sums the five inverse-variance weights. Hence, the number has no fixed scale, because it depends on the symbol’s price variance. Read it against its own recent behaviour. Next, a rising sum means the regressions fit better. A falling sum means price has turned noisy.
How much should I rely on this indicator?
Treat it as one input, not a decision. Then, it is a chart analysis tool, not trading advice. Test it on your own markets and timeframes before relying on it. Results are not guaranteed; past performance is not indicative of future results.

About the author
Written by Dominic Walsh, a Forex trader and MT4/MT5 indicator, Expert Advisor and script developer. Every tool on forexmt4systems.com is tested on live charts before release and ships with ready-to-use compiled MT4 (.ex4) and MT5 (.ex5) files. Learn more about the trader and developer behind this site.
How we build, test and correct every tool: Editorial & Testing Policy. Trading carries risk; see the disclaimer.