
Trend tools struggle in chop, so filter the chop first. Also, lempel Ziv Trend Coder acts as a choppy market indicator TradingView traders can layer under any strategy. It ignores price levels completely. Instead it reads the last 40 bars as a string of up and down signs, counts how often each three-bar pattern repeats, and calls the market trending only when one pattern dominates the rest.
It is free and open source. Indeed, you can add it to any chart from the Lempel Ziv Trend Coder script page on TradingView, and the full Pine source is published there for you to read.
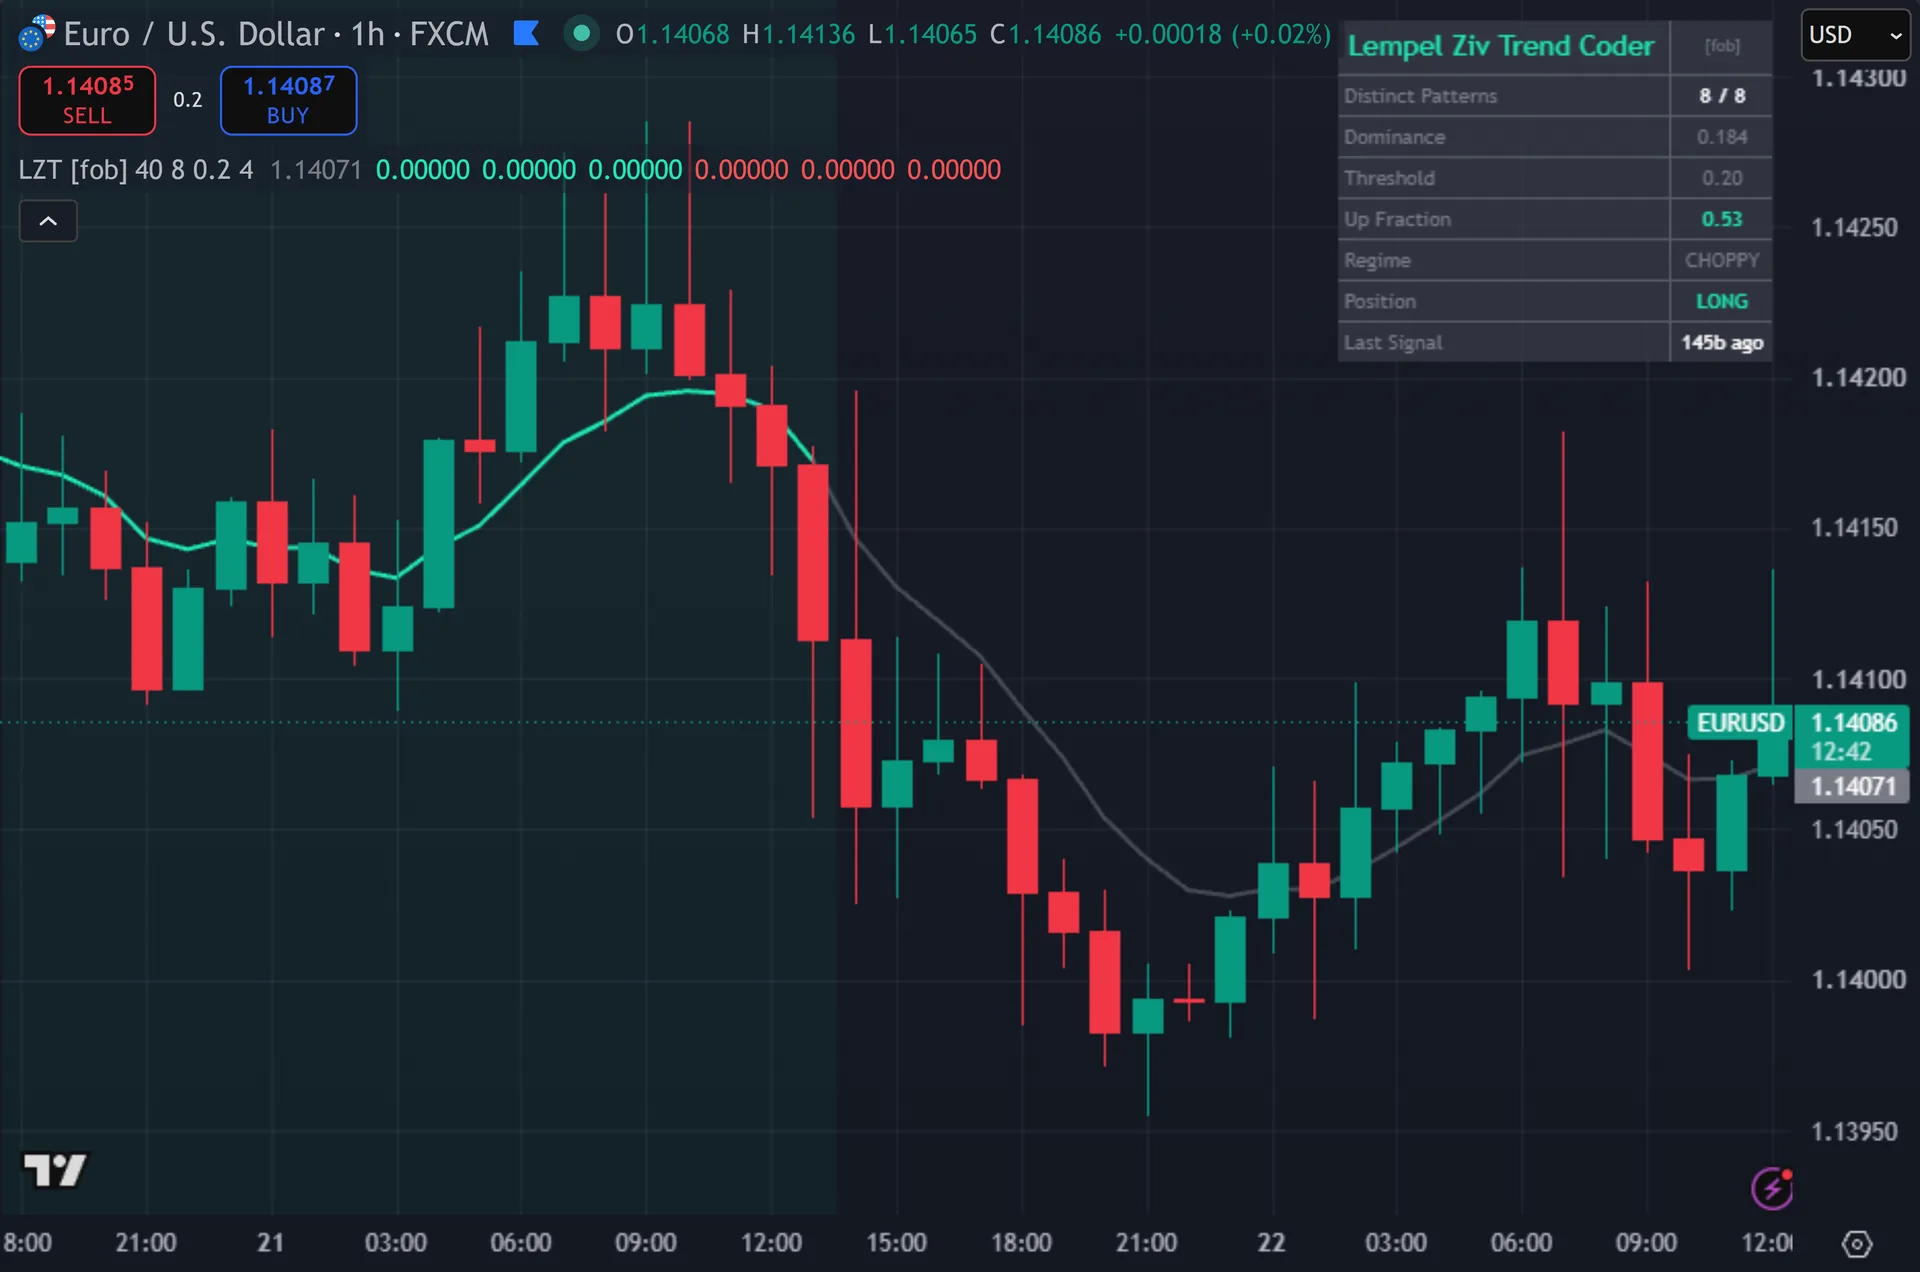
What Lempel Ziv Trend Coder plots on the price chart
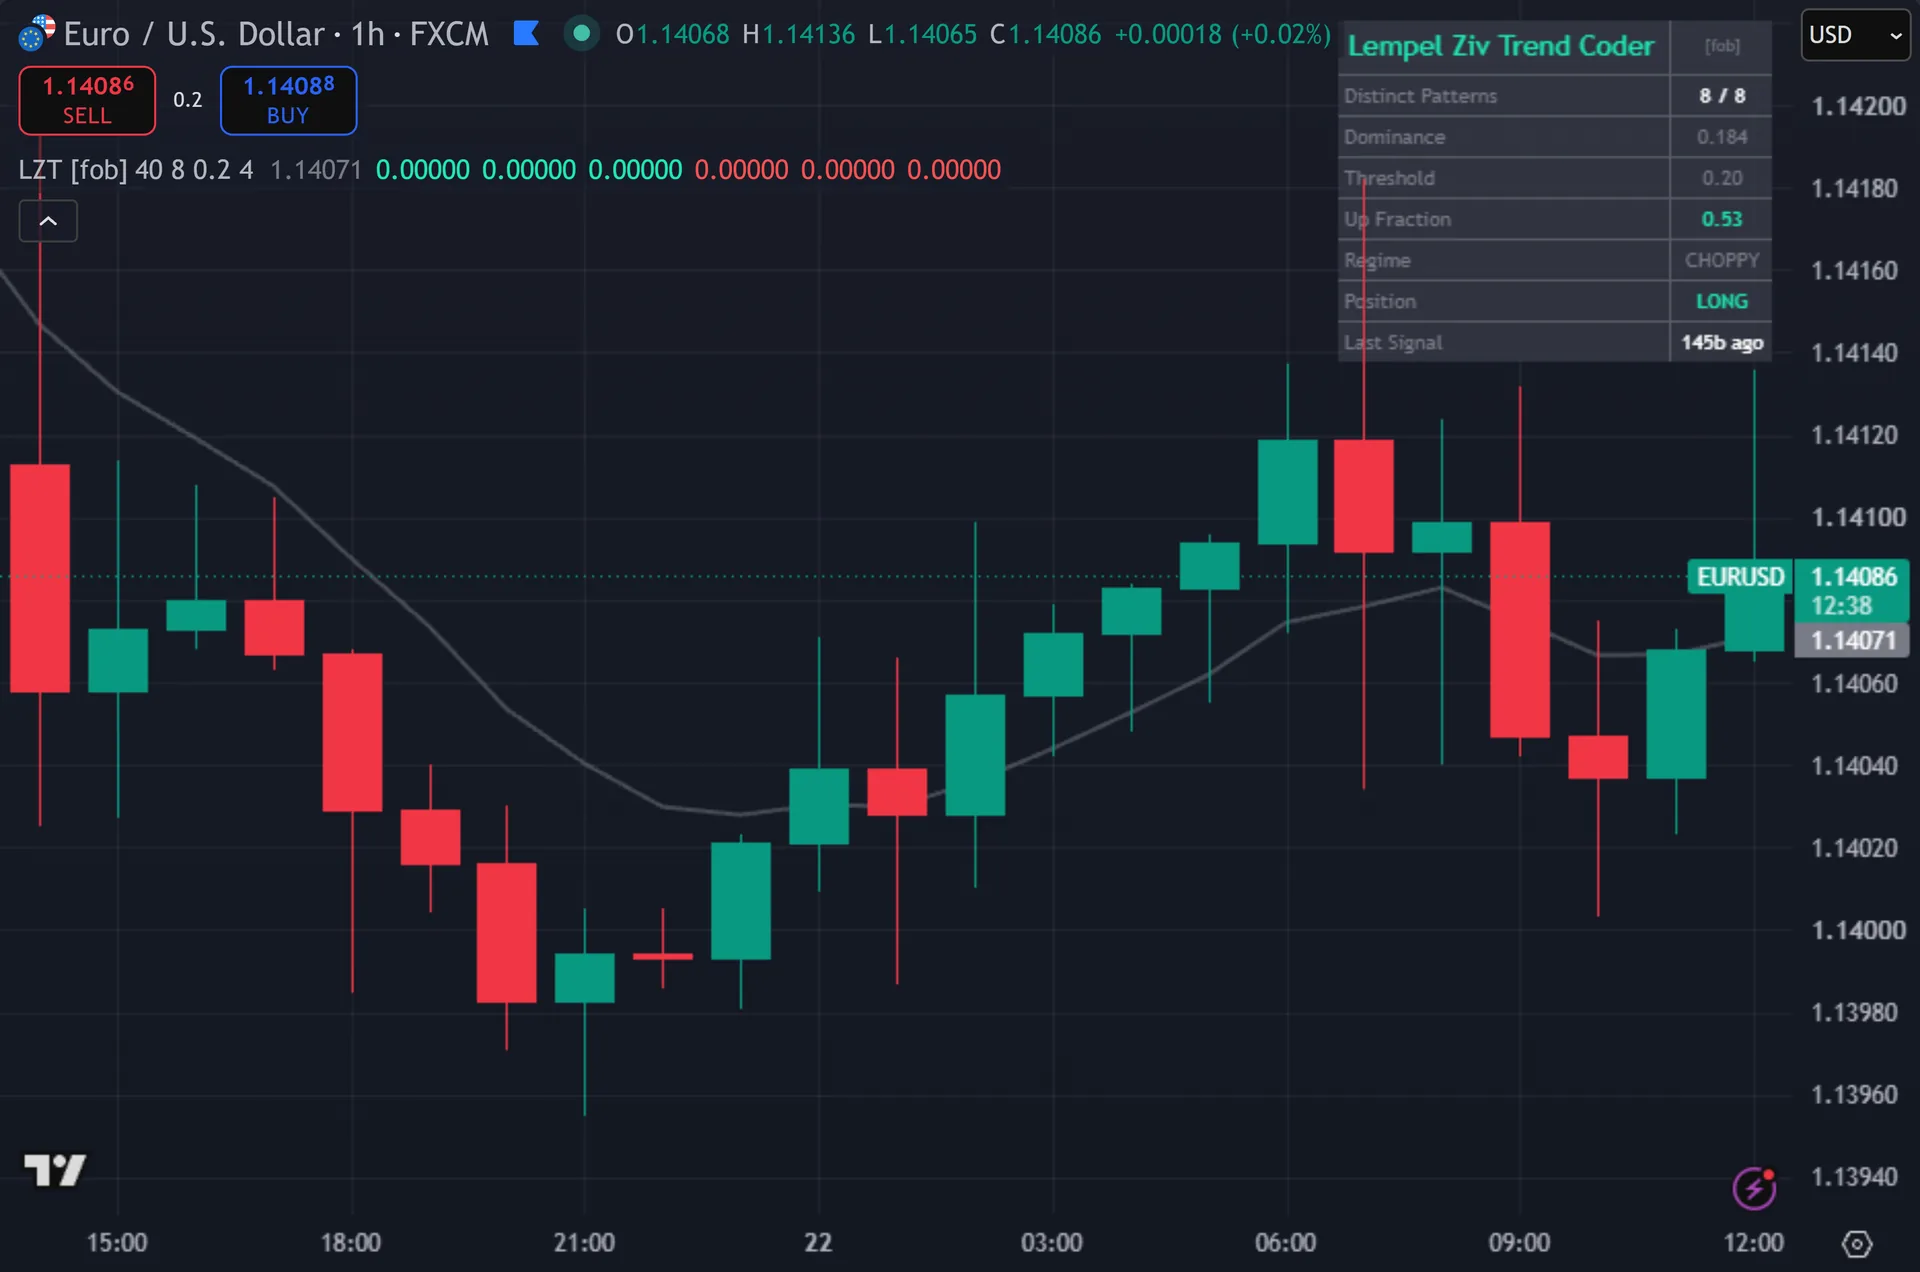
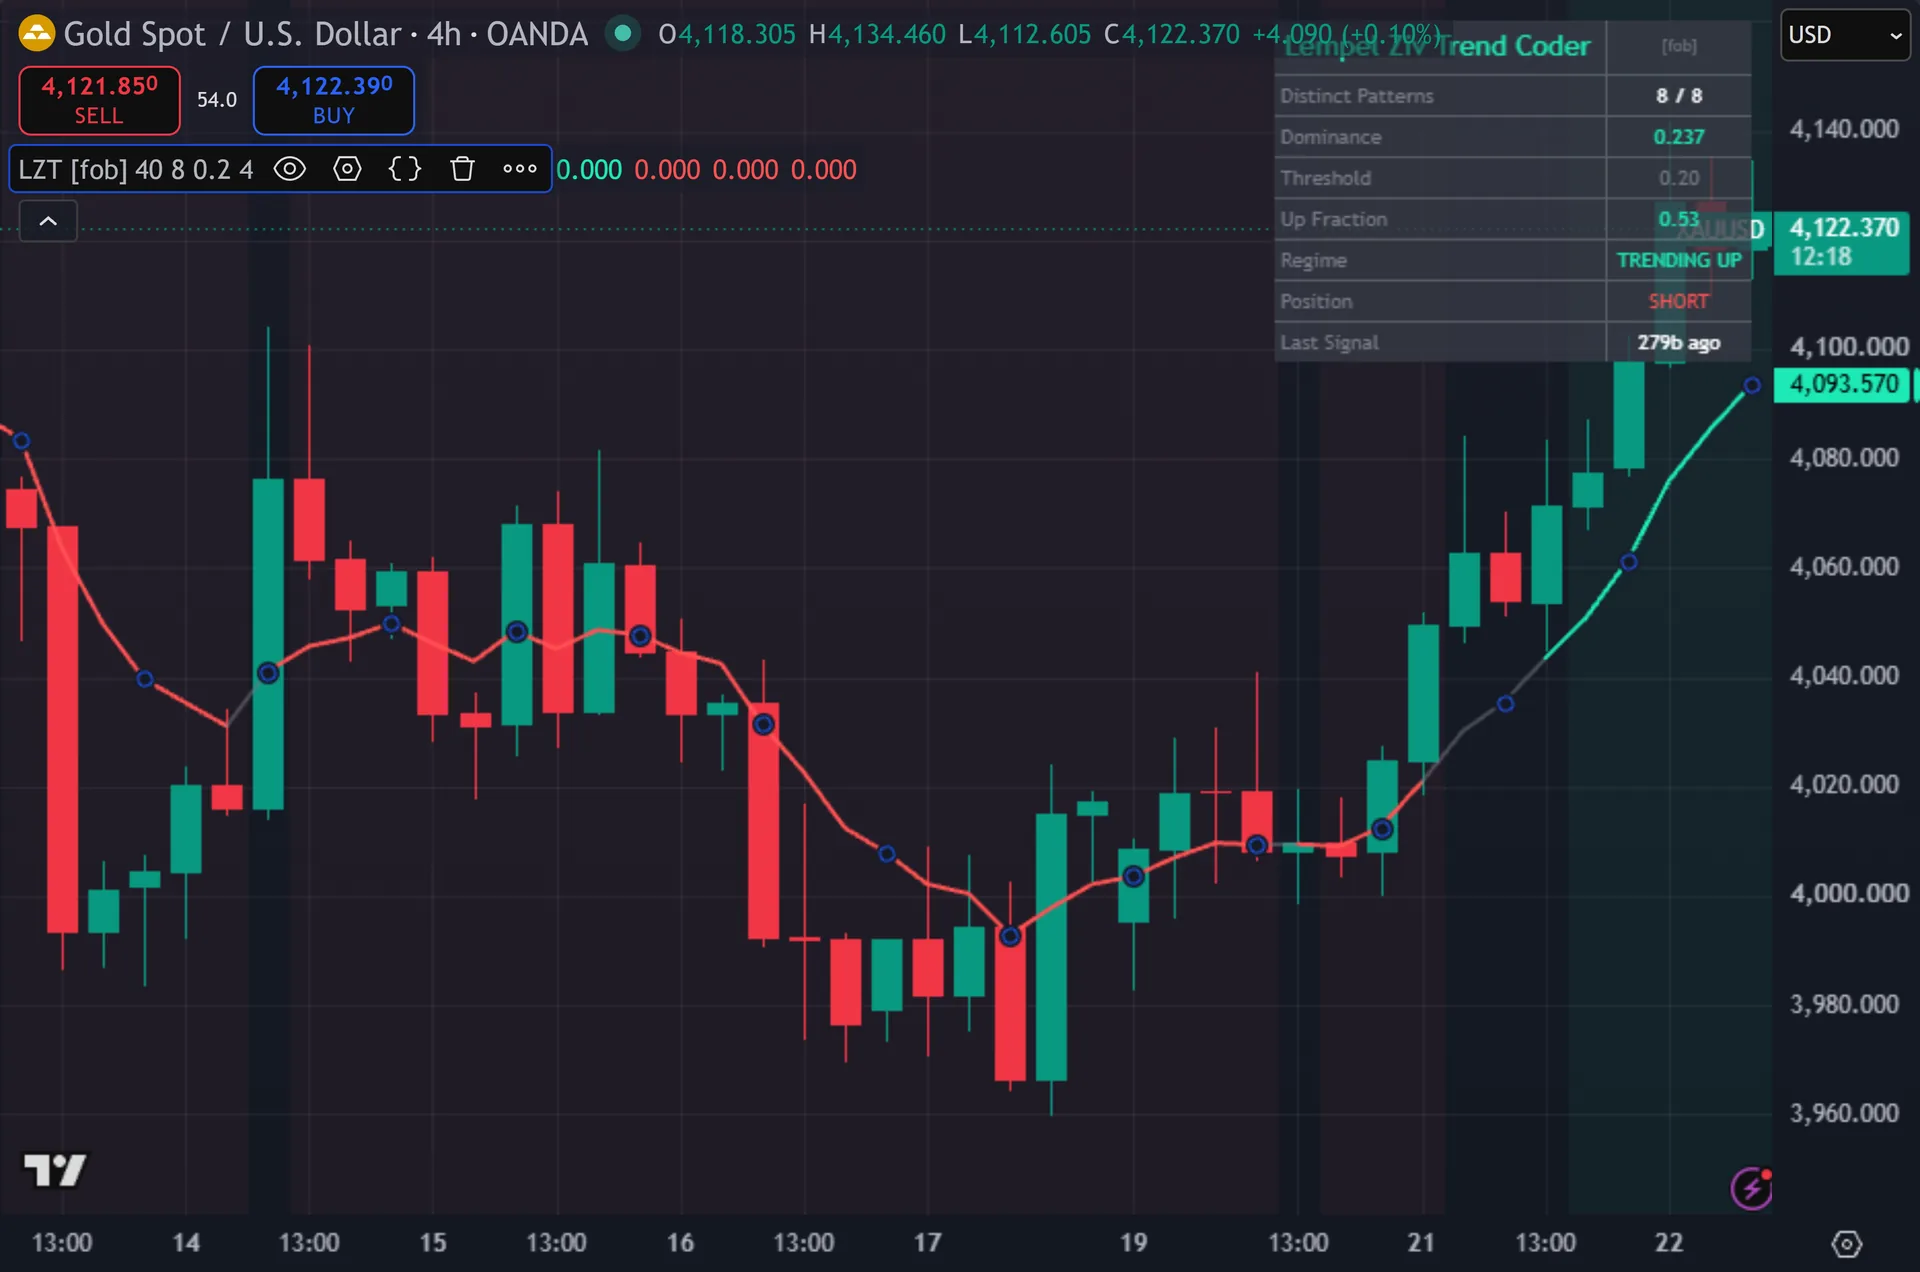
The script plots one line: an 8-bar EMA that turns teal in a bullish trending regime, red in a bearish one and grey in chop. Still, diamonds mark entries, tagged LZT up below the bar or LZT dn above it, each backed by two larger translucent copies. Signal bars get recoloured, and the background carries a very faint tint while a bias holds. Thus, the top-right dashboard prints distinct patterns out of eight, current dominance, your threshold, the up fraction, the regime word, position state and bars since the last signal.
How Lempel Ziv Trend Coder is built
Turning price into a sign string
The script walks back through the window, 40 bars by default. Hence, at each step it compares three consecutive closes and writes three bits. Bit one records whether the newest close beat the one before it. Next, bits two and three do the same for the next two pairs back. Three bits give a number from 0 to 7, so every position in the window maps to one of eight patterns.
A 40-bar window produces 38 patterns. Then, the script tallies them into eight buckets. It then reads two numbers off those buckets: how many buckets hold at least one count, and what share of the total the biggest bucket holds. Yet, that share is the dominance figure on the dashboard.
Pure coin flips would spread the counts evenly, giving each pattern a share near 0.125. Real trends repeat themselves. A steady advance keeps printing the all-up pattern, which pushes one bucket well above the rest. Truly, the default threshold sits at 0.20, comfortably above the random baseline. Cross it and the script calls the regime trending.
From regime to entry
Direction comes from a separate count. Plainly, the script tracks how many bars in the window closed above the prior bar, then divides by 38. Above 0.5 and the bias reads bullish. Also, below 0.5 and it reads bearish. Both need the trending flag first, so a strong up fraction inside a choppy window arms nothing.
The trigger is a plain 8-bar EMA cross. Indeed, a buy needs close to cross above the EMA while the bullish bias holds. A sell needs the reverse. Three more gates follow. The bar must close, the position state must not already sit in that direction, and four bars must have passed since the last signal.
Note what the signal does not use. Still, distinct pattern count appears on the dashboard and drives two alerts, one at three or fewer patterns and one at seven or more. It plays no part in the entry logic. Thus, dominance alone decides whether a regime counts as trending.
How to read the signals
Watch dominance against the threshold, not in isolation. Hence, a window sitting at 0.19 with the threshold at 0.20 sits one bar away from arming. The distinct-pattern row gives you the same idea from the other side. Next, two or three patterns means a repetitive tape. Seven or eight means noise.
The EMA colour is the fastest read on the chart. Then, grey means the script sees no usable structure and will not fire at all, whatever price does around the line.
Signals land one bar after the cross completes, because the script requires a closed bar. On fast charts the EMA cross itself is common, so most of the filtering work happens at the dominance gate. Raise the threshold toward 0.30 if you want far fewer, stricter marks.
Every Lempel Ziv Trend Coder setting explained
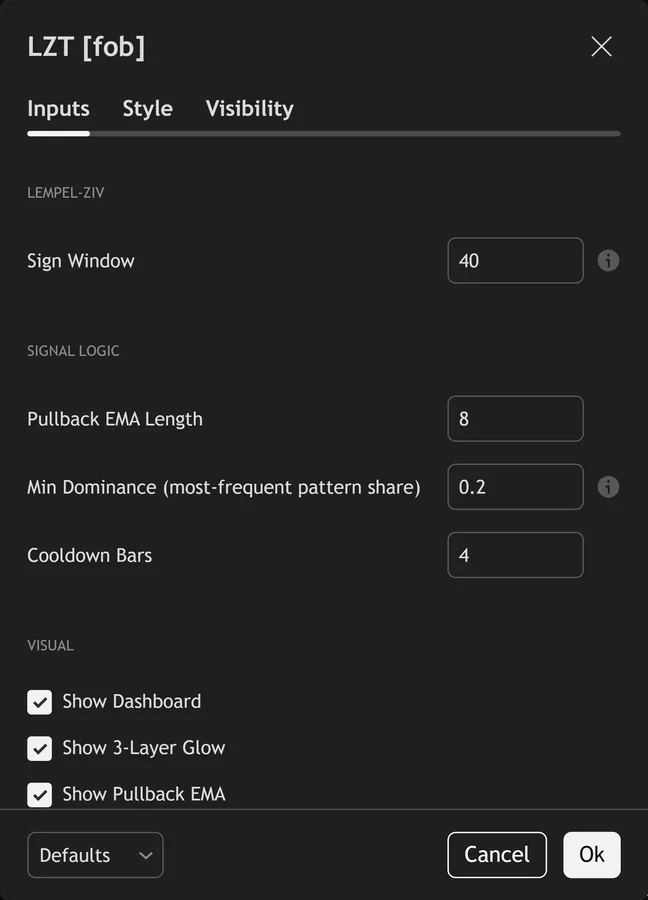
The script exposes 9 inputs, grouped in the settings panel exactly as shown below. Defaults are the published values.
Lempel-Ziv
| Setting | What it does | Default | Range |
|---|---|---|---|
| Sign Window | Bars whose sign sequence is encoded into 3-grams. | 40 | 15 to 120 |
Signal Logic
| Setting | What it does | Default | Range |
|---|---|---|---|
| Pullback EMA Length | Sets the pullback ema length used in the calculation. | 8 | 3 to 50 |
| Min Dominance (most-frequent pattern share) | Most-frequent 3-gram share. Uniform random = 0.125. Threshold above = trending regime. | 0.20 | 0.13 to 0.50 |
| Cooldown Bars | Sets the cooldown bars used in the calculation. | 4 | 1 to 20 |
Visual
| Setting | What it does | Default | Range |
|---|---|---|---|
| Show Dashboard | Toggles show dashboard on the chart. | on | on / off |
| Show 3-Layer Glow | Toggles show 3-layer glow on the chart. | on | on / off |
| Show Pullback EMA | Toggles show pullback ema on the chart. | on | on / off |
| Buy Color | Colour used for buy color. | #1de9b6 | |
| Sell Color | Colour used for sell color. | #ff5252 |
Alerts built into Lempel Ziv Trend Coder
The script ships 11 alert conditions. Yet, open the alert dialog on the chart, pick the indicator as the condition source, then choose the event you want. Alerts fire on the close of the bar, so they follow the same confirmed-bar rule the on-chart signals use.
- LZT Buy
- LZT Sell
- LZT Any Signal
- LZT Trend Start
- LZT Chop Start
- LZT Very Trendy
- LZT Very Choppy
- LZT EMA Up
- LZT Webhook JSON
Other markets and timeframes
Nothing here touches price scale. Truly, the script only compares each close with the one before it, so the whole calculation runs on signs. That makes it fully market-agnostic. Plainly, gold, indices, crypto and equities all share the same 0.125 random baseline and the same 0.20 default threshold. Volume plays no part, so instruments without a volume feed lose nothing. Also, the one input worth tuning per chart is the window. Forty bars covers two months on a daily chart and roughly three hours on M5.
Limitations worth knowing
This measures repetition in the sign sequence. Indeed, it carries no view on price level, support, structure or news. It cannot tell you where a trend might end. Still, it only tells you the recent tape looks repetitive rather than random.
The measure is a Lempel-Ziv style proxy, not the compression algorithm itself. Thus, real LZ builds a growing dictionary of novel substrings and reads complexity off dictionary growth. This script counts three-bar sign patterns over a fixed window and takes the most frequent share. Hence, same family of idea, much simpler implementation.
A 40-bar window means the regime lags. Next, roughly half the window must fill with new behaviour before dominance shifts, so the tool confirms trends rather than predicting them. No stop, target or sizing logic exists anywhere in the script.
Get Lempel Ziv Trend Coder on TradingView
Open Lempel Ziv Trend Coder on TradingView
If you also trade MetaTrader, the MT4 and MT5 indicator library is available below.
Get the complete indicator library
One email unlocks the full MT4 and MT5 indicator library. Then, this TradingView script stays free on TradingView – the button above adds it to your chart.
Using it alongside MetaTrader
Adding a script on TradingView takes one click, so there is no install step here. Yet, if you want the same idea on MetaTrader, the MT4 and MT5 indicator installation guide walks through copying files into the data folder and attaching them to a chart. You can also browse the full MetaTrader indicator library, the MT4 indicators section, or the other free TradingView scripts published on this profile. For related chart tools see the MT5 indicators section and the forex trading strategies guides.
External references
- Breadth of market on Wikipedia
- Stochastic Oscillator at Investopedia
- Stock Market Cycles at StockCharts ChartSchool
Frequently asked questions
Does the Lempel Ziv Trend Coder repaint?
No. Truly, both diamond plotshapes read buySignal and sellSignal, and each requires barstate.isconfirmed. Marks appear only after the bar closes, so the historical chart matches live behaviour.
Is this the real Lempel-Ziv compression algorithm?
No, and the code does not pretend otherwise. Plainly, LZ77 and LZ78 build a dictionary of previously unseen substrings and measure complexity by how fast it grows. This script encodes 3-bar sign patterns into eight buckets and reports the most frequent share. Also, it borrows the idea that repetitive strings compress well.
What dominance value counts as trending?
The default gate is 0.20. Indeed, uniform random data lands near 0.125, so 0.20 sits meaningfully above noise without demanding a perfect run. Readings above 0.30 usually mean one pattern repeats hard, which happens during strong directional moves.
Why did a clean EMA cross produce no diamond?
Three gates can block it. Still, dominance sat under your threshold, so the regime read choppy. The position state already pointed that way. Thus, or fewer than four bars had passed since the previous signal. The dashboard shows dominance and position, so you can see which one applied.
How much should I rely on this indicator?
Treat it as one input, not a decision. Hence, it is a chart analysis tool, not trading advice. Test it on your own markets and timeframes before relying on it. Results are not guaranteed; past performance is not indicative of future results.

About the author
Written by Dominic Walsh, a Forex trader and MT4/MT5 indicator, Expert Advisor and script developer. Every tool on forexmt4systems.com is tested on live charts before release and ships with ready-to-use compiled MT4 (.ex4) and MT5 (.ex5) files. Learn more about the trader and developer behind this site.
How we build, test and correct every tool: Editorial & Testing Policy. Trading carries risk; see the disclaimer.