
Stops cluster above swing highs and below swing lows. Also, price tends to reach for them. Liquidity Magnet Compass is a free liquidity pools indicator TradingView traders can use to map those pools, watch which ones price takes, and score which side pulls harder right now. Indeed, it tracks up to 14 live pools, marks every sweep, and fires an arrow only when volume and a rejection close both agree.
It is free and open source. Still, you can add it to any chart from the Liquidity Magnet Compass script page on TradingView, and the full Pine source is published there for you to read.
What Liquidity Magnet Compass plots on the price chart
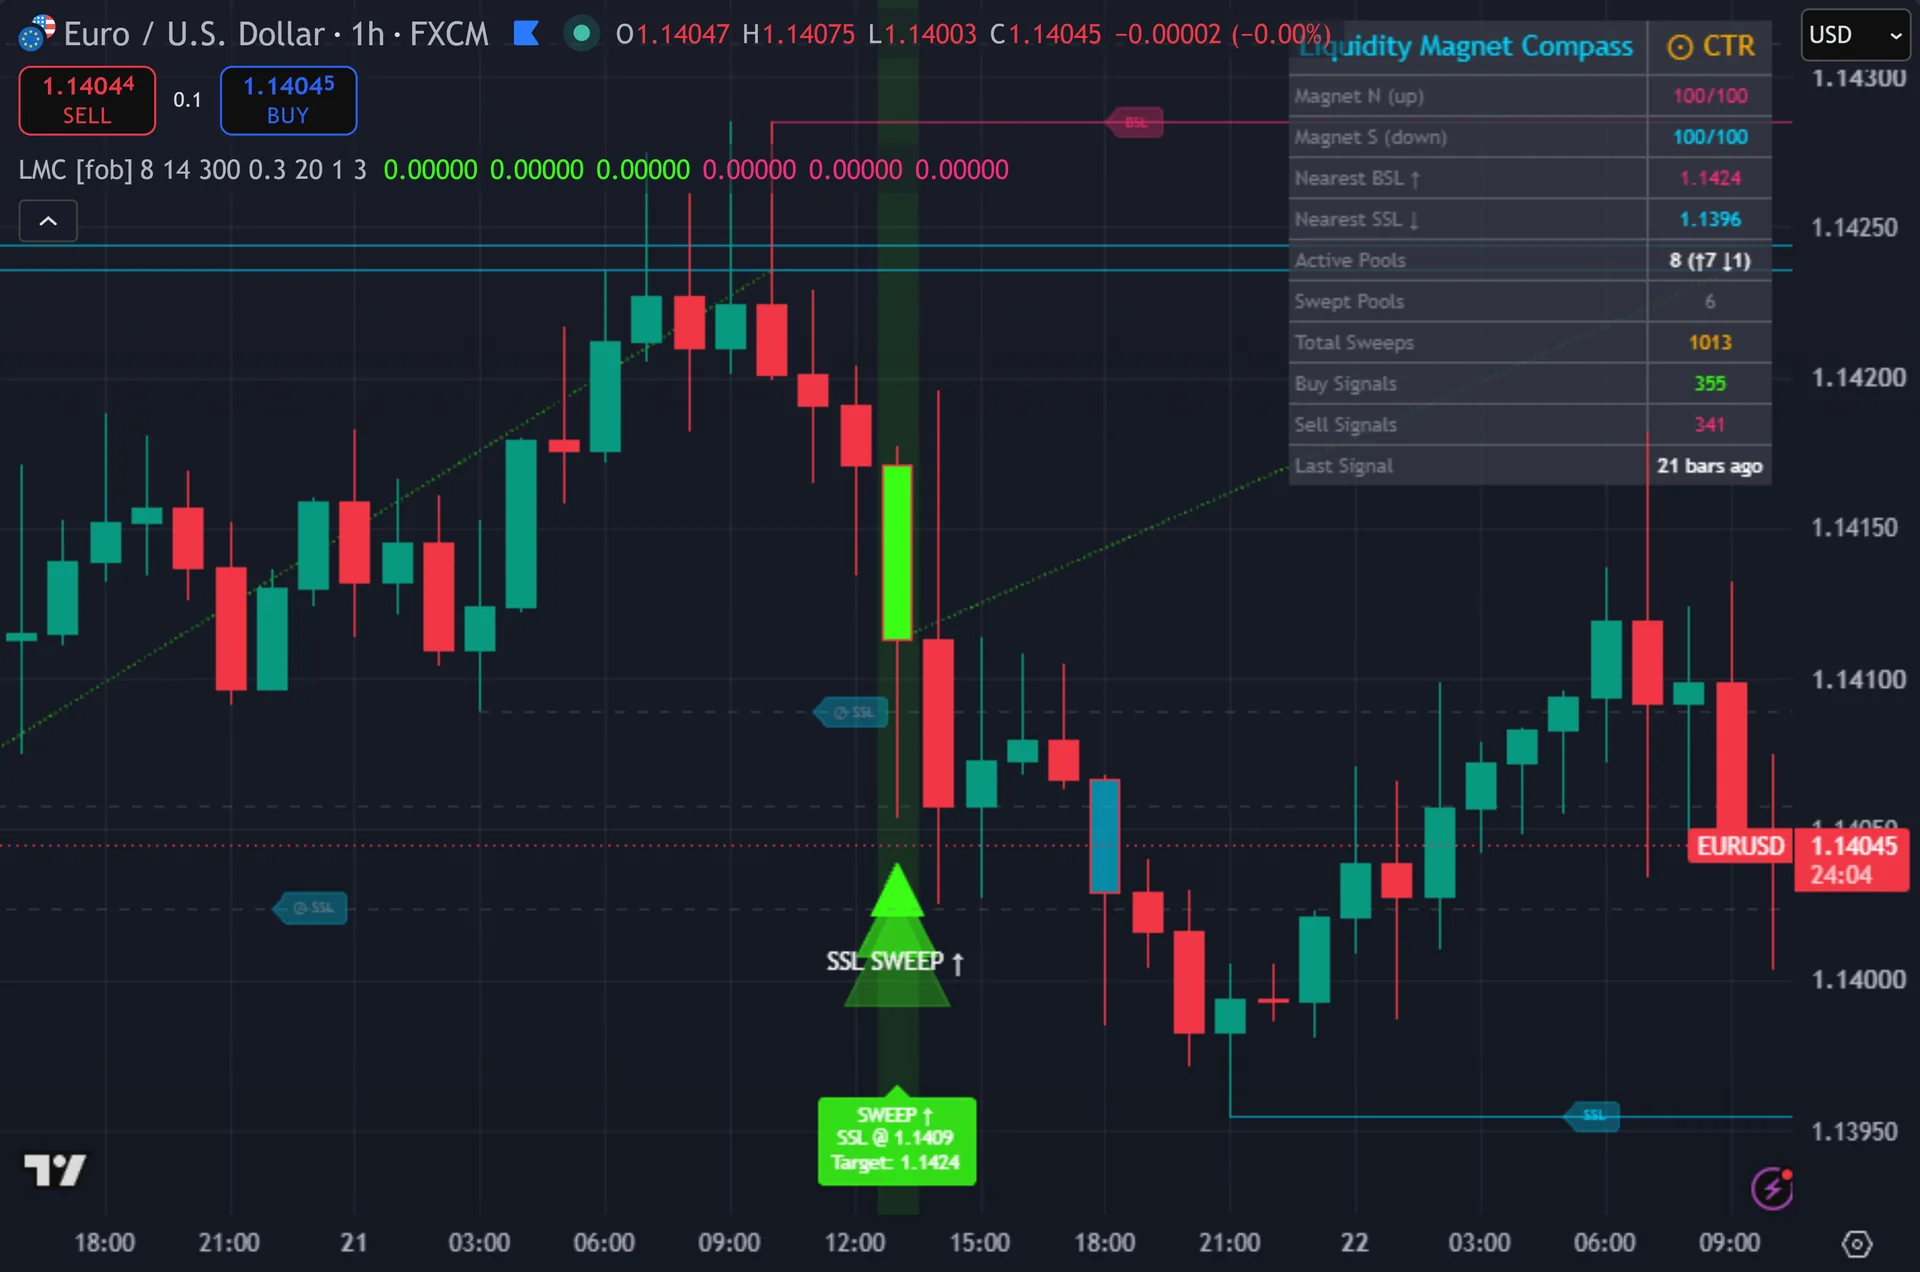
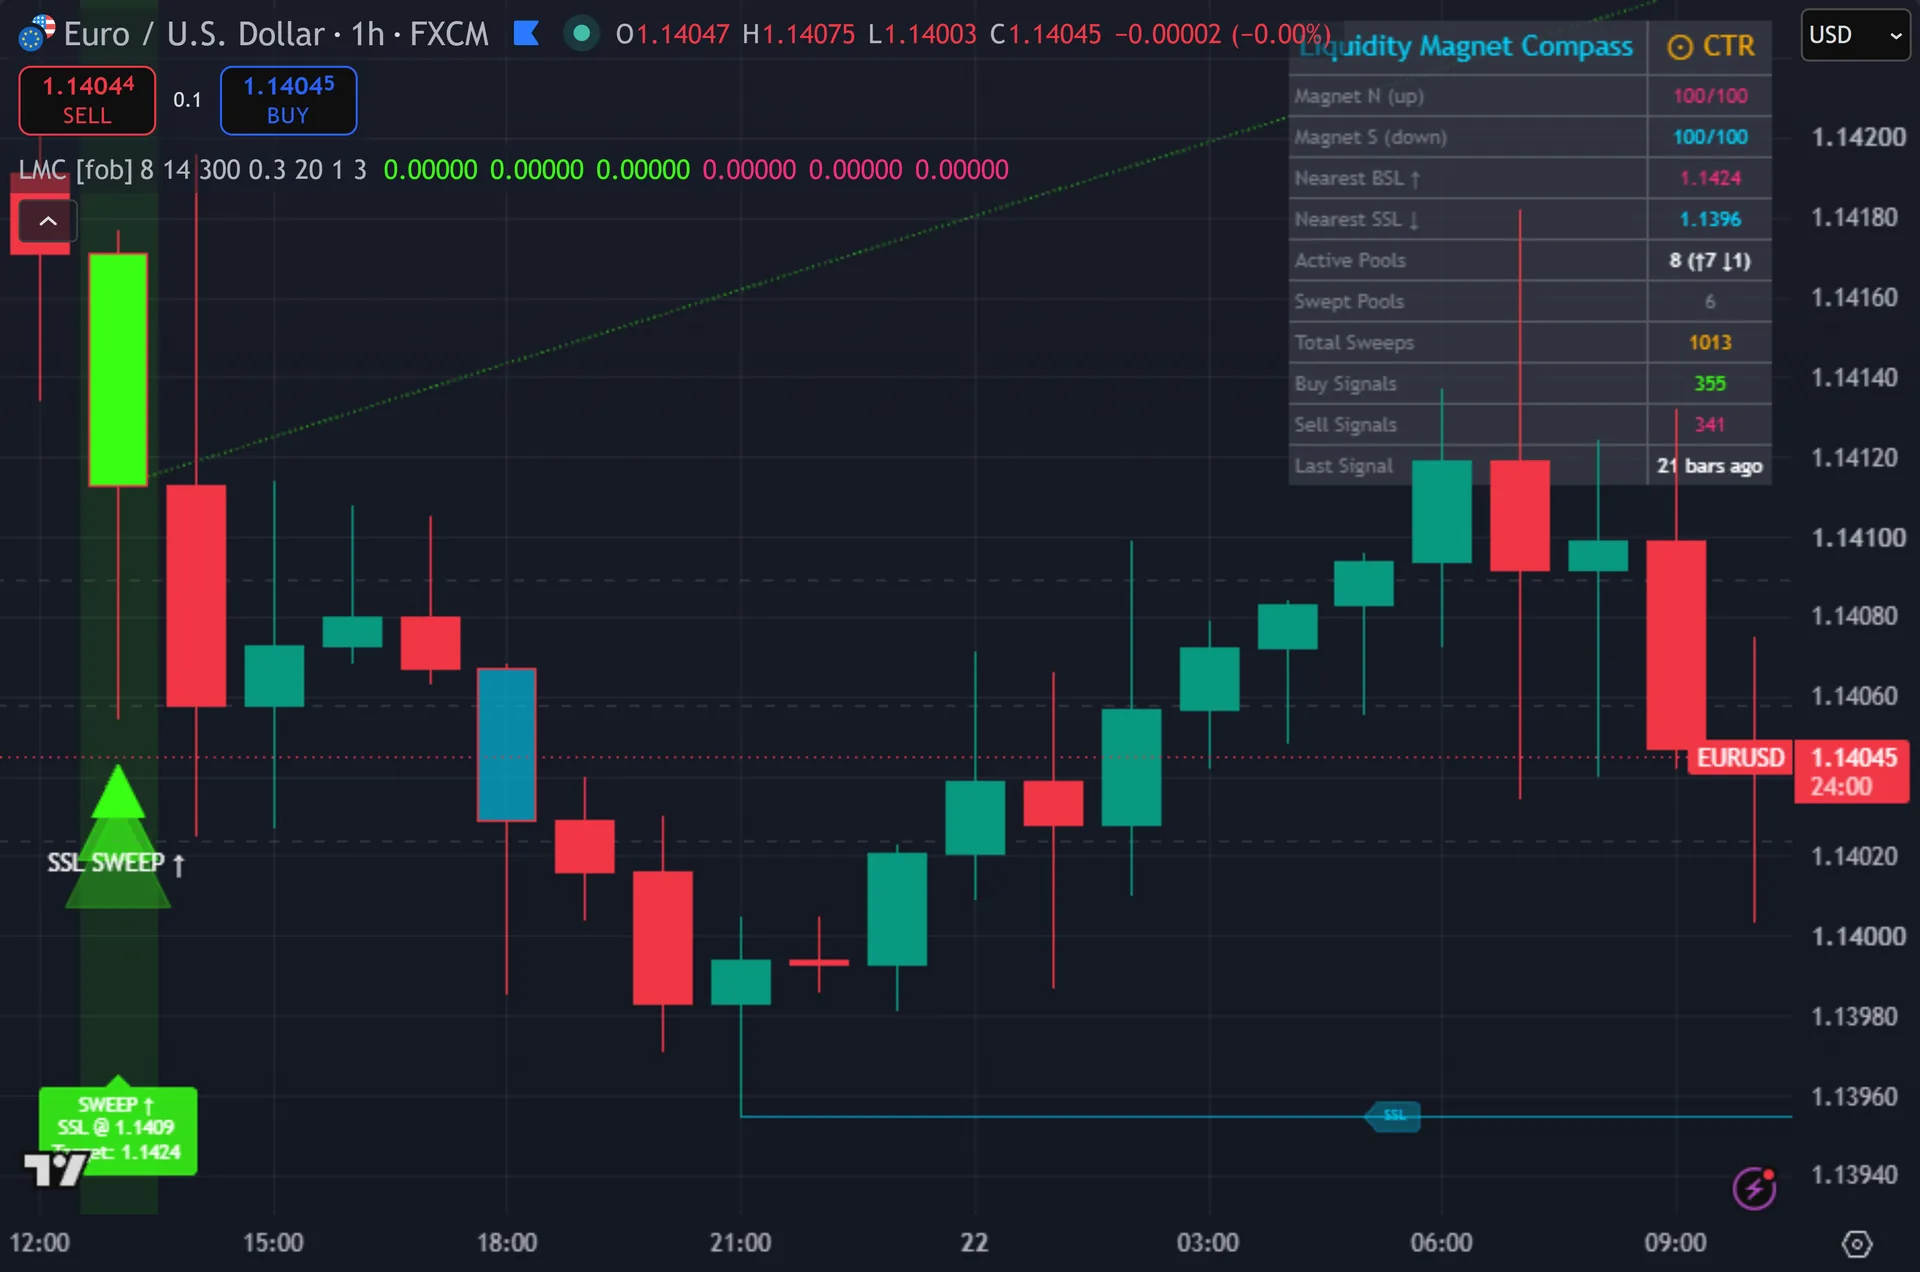
Pink lines mark buy-side pools at swing highs and carry a BSL tag. Thus, cyan lines mark sell-side pools at swing lows and carry an SSL tag. Each line extends right until price takes it, then turns gray and dashed with a crossed-out tag. Hence, signals print as three-layer triangles reading SSL SWEEP up or BSL SWEEP down, plus a label holding the swept price and the next pool as a target. A dotted line runs toward that target. Next, the compass dashboard sits top right, and a needle label floats beside the last bar.
How Liquidity Magnet Compass is built
Step one: build the liquidity map
Pools come from pivots. Then, the script calls ta.pivothigh and ta.pivotlow with a length of 8 on both sides. A swing therefore needs 8 bars either side before it confirms. Yet, every confirmed pivot high becomes a buy-side pool, because resting stop orders from short traders sit above it. Every pivot low becomes a sell-side pool for the mirror reason.
The script stores each pool in a custom type holding its price, birth bar, side, swept flag, line and label. Truly, it keeps 14 pools at most and drops the oldest when a new one arrives. It also prunes any pool older than 300 bars and deletes that drawing at the same time. Long histories therefore stay readable.
Step two: sweep test and compass score
A sweep needs size. For a buy-side pool, the high must exceed the pool price by at least 0.3 times ATR 14. For a sell-side pool, the low must undercut it by the same amount. Plainly, with Require Rejection Close on by default, the bar must also close back through the level. That is the classic stop run, and it filters out clean breaks.
Two more gates apply before an arrow. Also, volume must reach its 20-bar average times the Volume Confirm Multiplier, which starts at 1.0. At least 3 bars must have passed since the last signal. Indeed, the bar must close as well, so nothing flickers mid-candle. If both sides trigger on one bar, the script keeps the one matching the close direction.
The compass runs separately from the signals. Still, it counts unswept pools above and below price, then measures the distance to the nearest one in ATR units. Each side scores 15 points per pool plus a proximity term, capped at 100. Thus, the needle reads N when the upside score leads by more than 10, S when the downside leads, and CTR when neither side dominates.
How to read the signals
Read the dashboard first. Hence, magnet N and Magnet S each run 0 to 100. A high score means several untouched pools sit close by in ATR terms. Next, that is where resting orders live, and price often travels toward them.
The arrows mark a completed stop run, not a breakout. Then, an SSL SWEEP up says price dipped under a swing low by at least 0.3 ATR, then closed back above it on decent volume. The label prints the level price just took, plus the nearest opposite pool as a natural target.
Watch how pools die. Yet, when several BSL lines above price turn gray in quick succession, the upside fuel is gone and the compass starts leaning south. The Swept Pools and Total Sweeps counters make that shift easy to track.
Every Liquidity Magnet Compass setting explained
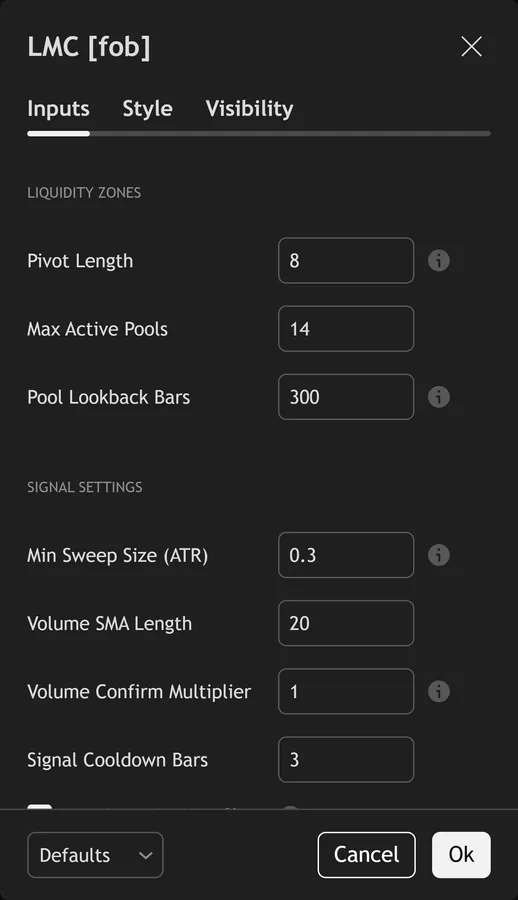
The script exposes 14 inputs, grouped in the settings panel exactly as shown below. Defaults are the published values.
Liquidity Zones
| Setting | What it does | Default | Range |
|---|---|---|---|
| Pivot Length | Lookback for swing high/low that defines a liquidity pool | 8 | 3 to 25 |
| Max Active Pools | Sets the max active pools used in the calculation. | 14 | 4 to 30 |
| Pool Lookback Bars | Prune pools older than this | 300 | 50 to 1000 |
Signal Settings
| Setting | What it does | Default | Range |
|---|---|---|---|
| Min Sweep Size (ATR) | Sweep wick must exceed this ATR fraction | 0.3 | 0.1 to 2.0 |
| Volume SMA Length | Sets the volume sma length used in the calculation. | 20 | 5 to 100 |
| Volume Confirm Multiplier | Sweep bar volume vs SMA | 1.0 | 0.5 to 3.0 |
| Signal Cooldown Bars | Sets the signal cooldown bars used in the calculation. | 3 | 1 to 30 |
| Require Rejection Close | Require close back through swept level (classic sweep) | on | on / off |
Visual Settings
| Setting | What it does | Default | Range |
|---|---|---|---|
| Show Compass Dashboard | Toggles show compass dashboard on the chart. | on | on / off |
| Show Liquidity Zones | Toggles show liquidity zones on the chart. | on | on / off |
| Show Compass Needle Label | Toggles show compass needle label on the chart. | on | on / off |
| Show 3-Layer Signal Glow | Toggles show 3-layer signal glow on the chart. | on | on / off |
| Buy Color | Colour used for buy color. | #39ff14 | |
| Sell Color | Colour used for sell color. | #ff2d78 |
Alerts built into Liquidity Magnet Compass
The script ships 11 alert conditions. Truly, open the alert dialog on the chart, pick the indicator as the condition source, then choose the event you want. Alerts fire on the close of the bar, so they follow the same confirmed-bar rule the on-chart signals use.
- LMC Buy SSL Sweep
- LMC Sell BSL Sweep
- LMC Any Signal
- LMC Sell-Side Swept
- LMC Buy-Side Swept
- LMC Strong North
- LMC Strong South
- LMC New Pool
- LMC Webhook JSON
Other markets and timeframes
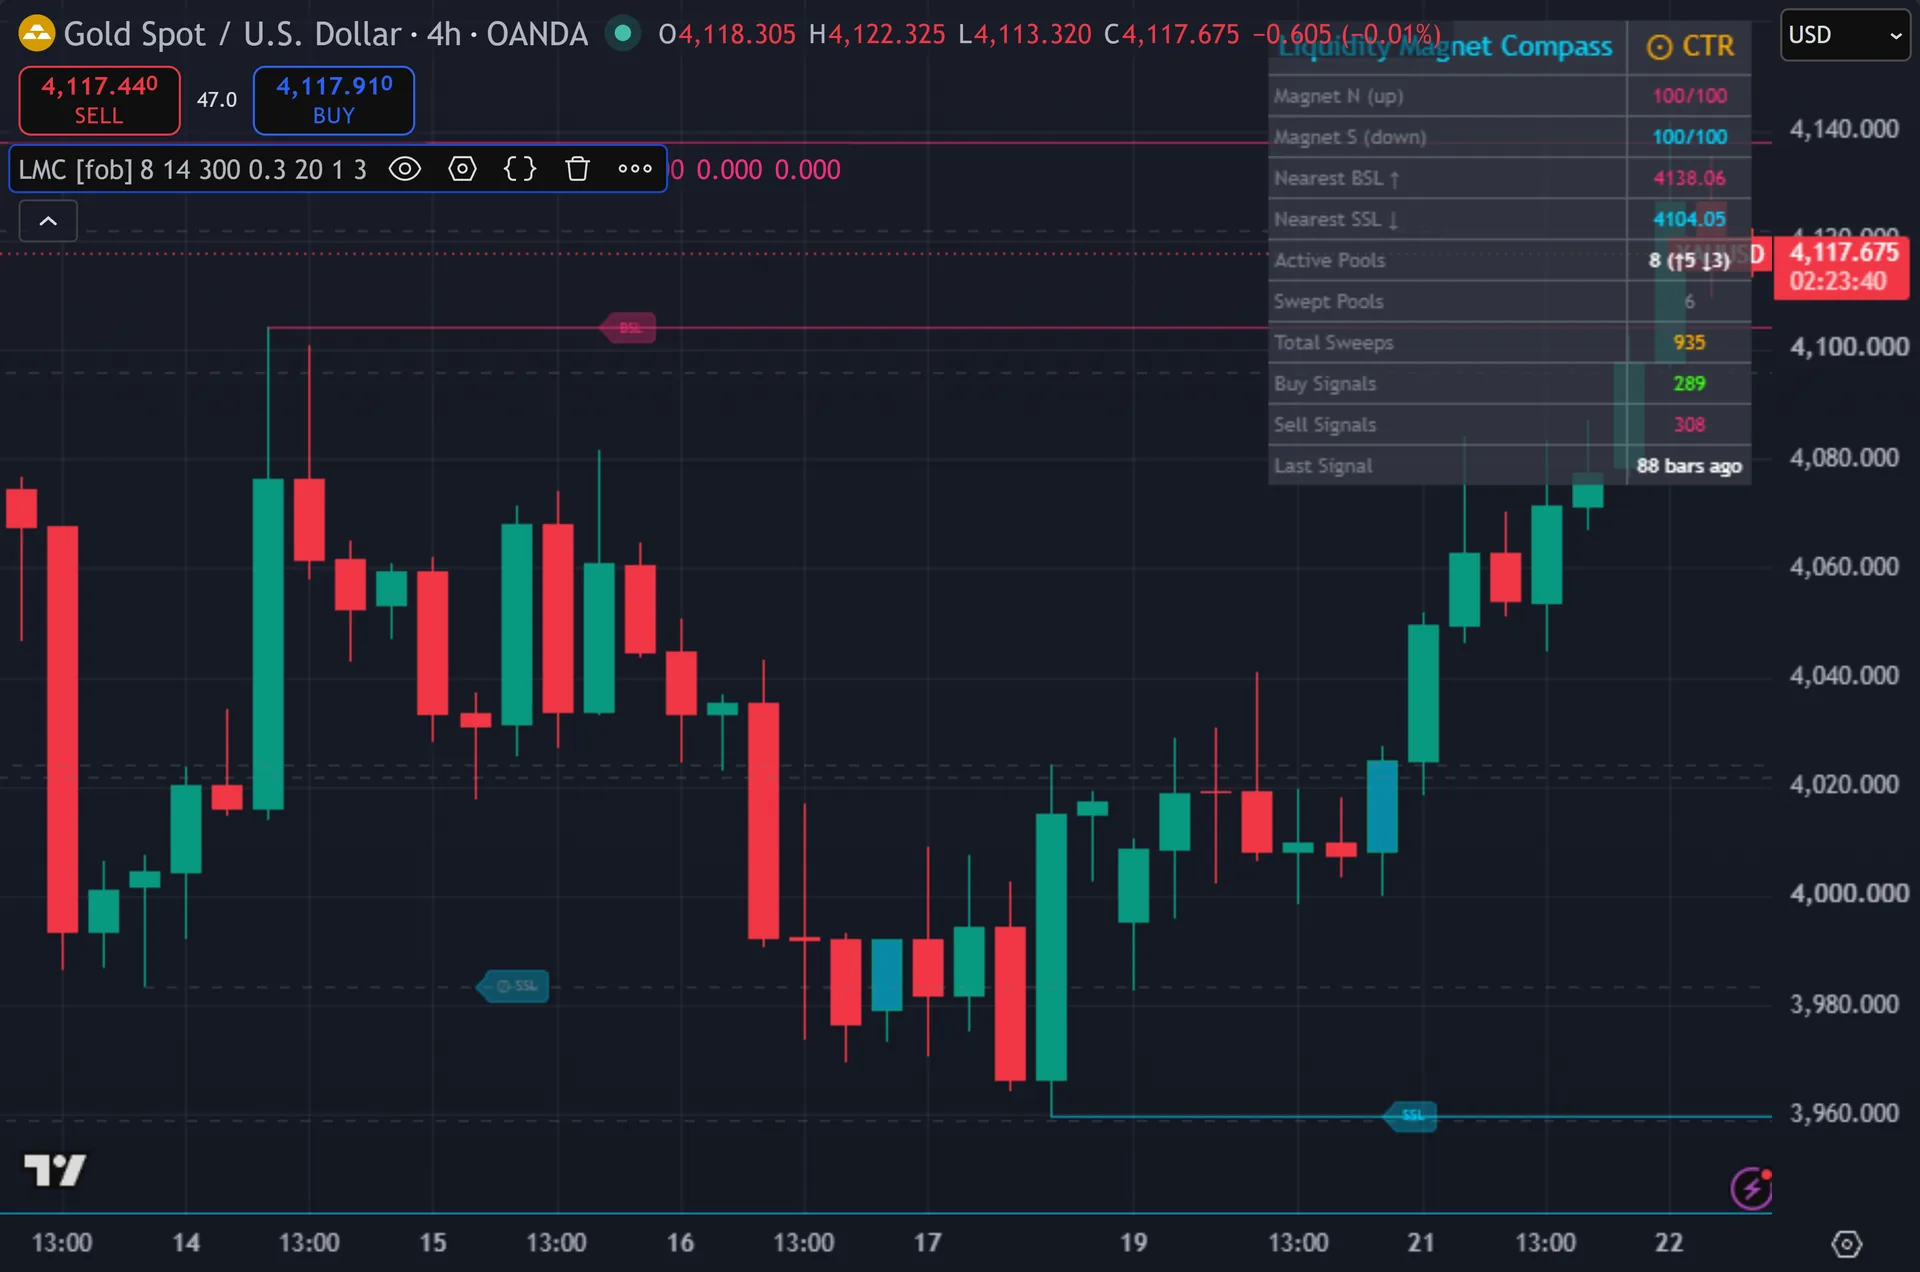
The sweep test scales with ATR and the compass measures distance in ATR units, so both travel to indices, gold, crypto and stocks without new numbers. Plainly, only the volume gate needs thought. Spot forex volume is your broker’s tick count, not exchange volume, so it works as an activity proxy rather than real traded size. Also, drop the Volume Confirm Multiplier to its 0.5 floor on thin feeds, or leave it at 1.0 on exchange-traded symbols.
Limitations worth knowing
Pivots confirm late. Indeed, with Pivot Length at 8, a pool only appears 8 bars after its swing formed. Signals themselves do not repaint, yet the map behind them fills in with that delay. Still, price can sweep a level before the script has drawn it.
The script marks a pool swept once, then retires it. Thus, real levels often get revisited and taken again. The script will not re-flag them, so a second run at the same price prints nothing.
This is a location tool. Hence, it carries no trend filter, no stop logic and no position sizing. The target line simply points at the next pool, which acts as a magnet rather than a forecast. Next, sweeps also fail often in strong one-way trends, where price runs through levels instead of rejecting them.
Get Liquidity Magnet Compass on TradingView
Open Liquidity Magnet Compass on TradingView
If you also trade MetaTrader, the MT4 and MT5 indicator library is available below.
Get the complete indicator library
One email unlocks the full MT4 and MT5 indicator library. Then, this TradingView script stays free on TradingView – the button above adds it to your chart.
Using it alongside MetaTrader
Adding a script on TradingView takes one click, so there is no install step here. Yet, if you want the same idea on MetaTrader, the MT4 and MT5 indicator installation guide walks through copying files into the data folder and attaching them to a chart. You can also browse the full MetaTrader indicator library, the MT4 indicators section, or the other free TradingView scripts published on this profile. For related chart tools see the MT5 indicators section and the forex trading strategies guides.
External references
- Flight-to-liquidity on Wikipedia
- Pivot Point at Investopedia
- Support and Resistance at StockCharts ChartSchool
Frequently asked questions
Does Liquidity Magnet Compass repaint?
Signals do not. Truly, every buy and sell arrow gates on barstate.isconfirmed, so it prints after the bar closes and stays put. The pool lines behind them rely on pivots, so each one appears 8 bars after its swing formed.
What do BSL and SSL mean?
BSL is buy-side liquidity, the resting buy stops above a swing high. Plainly, SSL is sell-side liquidity, the sell stops below a swing low. The script draws BSL in pink above price and SSL in cyan below it.
How does the compass score work?
Each side collects 15 points per unswept pool, plus a proximity term worth 40 divided by the distance in ATR, times 20. The total caps at 100. The needle points north or south only when one side leads by more than 10 points.
Why did an obvious sweep print no arrow?
Check three gates. Also, the wick may have missed the 0.3 ATR minimum, the bar may have failed to close back through the level, or volume may have sat under its 20-bar average. A 3-bar cooldown can also block a second signal.
How much should I rely on this indicator?
Treat it as one input, not a decision. Indeed, it is a chart analysis tool, not trading advice. Test it on your own markets and timeframes before relying on it. Results are not guaranteed; past performance is not indicative of future results.

About the author
Written by Dominic Walsh, a Forex trader and MT4/MT5 indicator, Expert Advisor and script developer. Every tool on forexmt4systems.com is tested on live charts before release and ships with ready-to-use compiled MT4 (.ex4) and MT5 (.ex5) files. Learn more about the trader and developer behind this site.
How we build, test and correct every tool: Editorial & Testing Policy. Trading carries risk; see the disclaimer.