
MAD Z Robust Burst is a z score indicator TradingView traders can reach for when outliers wreck a normal z-score. Also, a single spike inflates a standard deviation and hides the next one. This script uses the median and the median absolute deviation instead. Indeed, it waits for price to stretch past 2.0 robust deviations, then marks the bar where price comes back inside 1.0. It marks the return, not the extreme.
It is free and open source. Still, you can add it to any chart from the MAD Z Robust Burst script page on TradingView, and the full Pine source is published there for you to read.
What MAD Z Robust Burst plots on the price chart
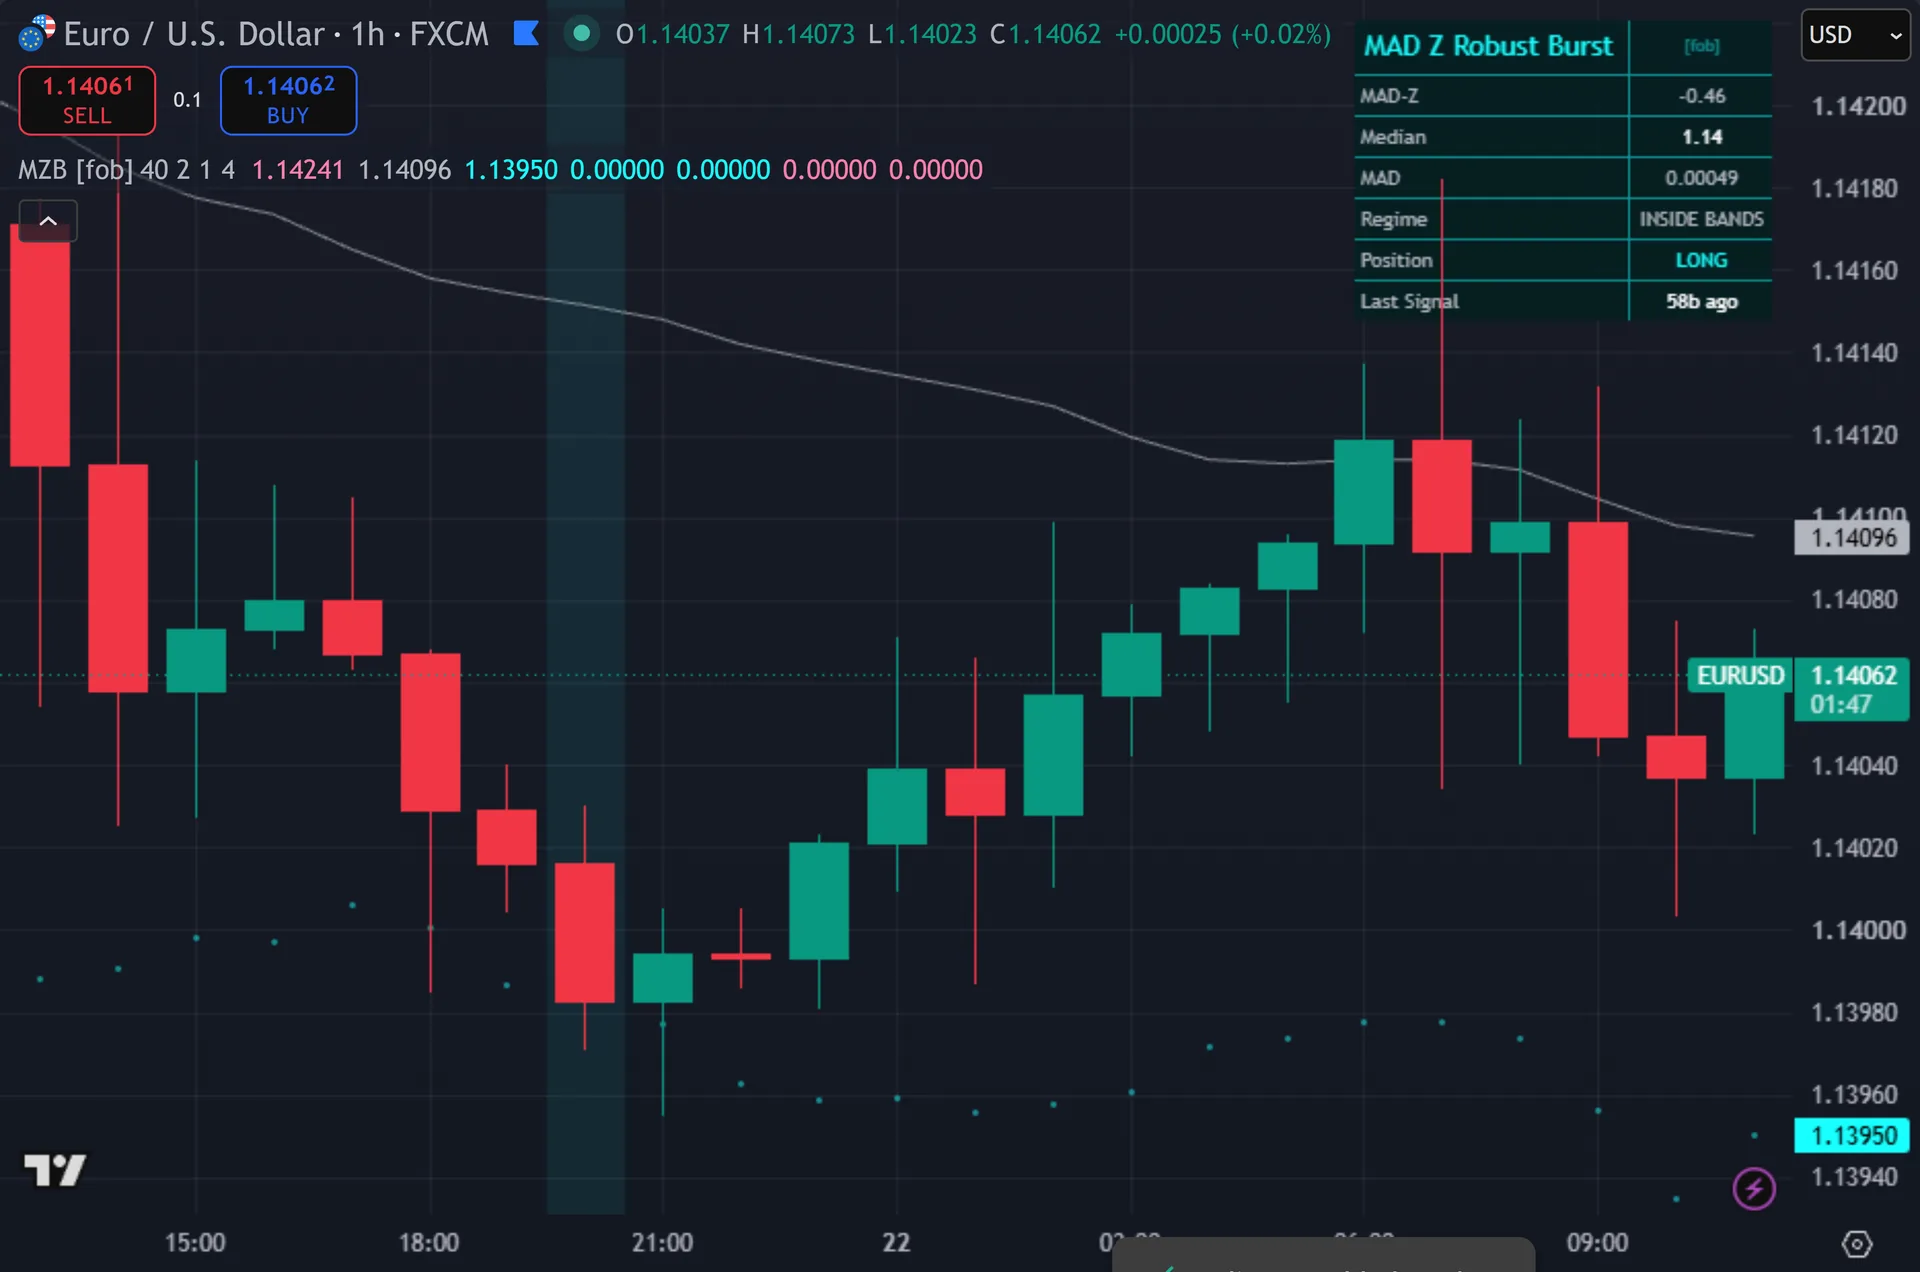
Three lines sit on the price chart. Thus, a silver line tracks the rolling median. Two circle plots mark the burst bands above and below it, pink on top and cyan below. Hence, the background tints faintly while price sits outside a band. Signals print as outlined squares: cyan below the bar with the text MZB up, pink above the bar with MZB dn. Next, a wider halo square sits behind each one. The signal bar itself gets recoloured. Then, a seven-row dashboard reports MAD-Z, median, MAD, regime, position and bars since the last signal.
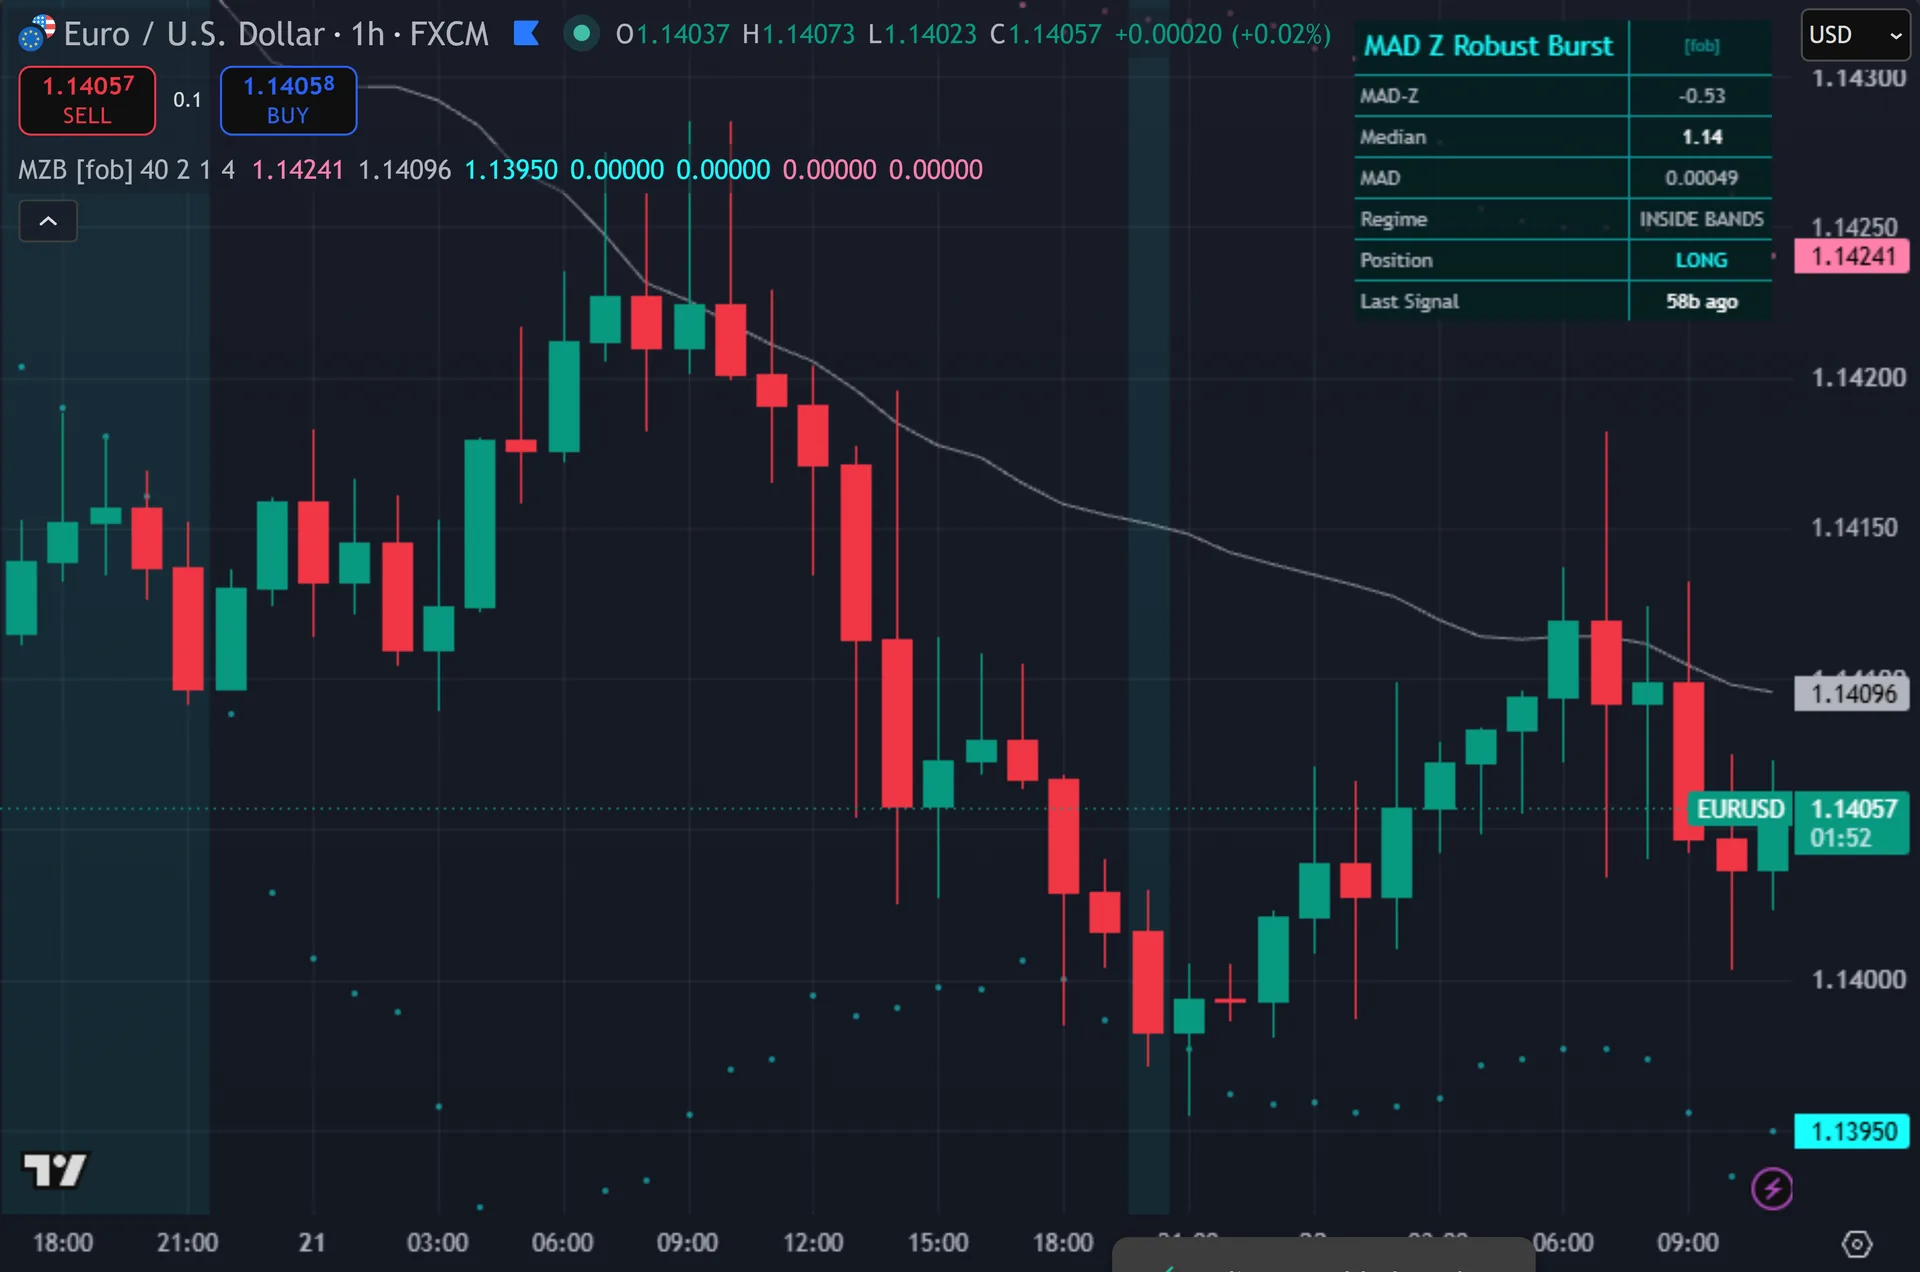
How MAD Z Robust Burst is built
Median and MAD instead of mean and stdev
The script collects the last 40 closes into an array, sorts out the median, then builds a second array holding the absolute distance of each close from that median. Yet, the median of that second array is the MAD. Both steps rebuild from scratch on every bar, so the reading always covers the same fixed window.
Then comes the scaling constant. Truly, the code divides by 1.4826 times the MAD. That factor makes MAD line up with the standard deviation on normally distributed data, so a MAD-Z of 2.0 means roughly what a classic z-score of 2.0 means. Plainly, the payoff shows up on messy data. One news candle drags a standard deviation hard. It barely moves a median.
The final figure is simply the current close minus the median, divided by 1.4826 times the MAD. Also, when MAD reads zero, which happens on a dead flat window, the script returns 0.0 and stays quiet.
Burst first, then the return
A latch holds the regime. Indeed, MAD-Z above 2.0 sets the state to up-burst. Below -2.0 sets it to down-burst. Still, the latch clears once MAD-Z drops inside half of the return level, so under 0.5 with the shipped defaults. Burst Z and Return Z both sit in the settings.
The entry then fires on the way back. Thus, from a down-burst, a MAD-Z that climbs back to -1.0 or higher produces a buy. From an up-burst, a MAD-Z that falls back to 1.0 or lower produces a sell. Hence, so the tool never buys the falling knife itself. It waits for the snap back toward the median.
Three gates guard each signal. Next, the bar must close, since the code requires barstate.isconfirmed. At least 4 bars must have passed since the last signal. Then, and the internal position state must not already point the same way, so buys and sells alternate. Nothing else enters the rule. Yet, there is no moving average cross here, no ATR filter and no volume test, despite what the shorthand header note suggests. The MAD-Z path is the whole trigger.
How to read the signals
Read the bands as a stretch gauge, not as support and resistance. Truly, the upper band sits at the median plus 2.0 robust deviations and the lower band mirrors it. Price outside a band means the current close ranks as an outlier against its own last 40 closes. Plainly, that is a statement about stretch, nothing more.
The squares mark reversion attempts. Also, a cyan MZB up square says price fell far below the median, then recovered to within one robust deviation of it. Where that lands relative to the wider trend is your call, not the script’s. Indeed, the dashboard MAD-Z row gives you the live number so you can see how far the snap has already run.
Watch the regime row. Still, INSIDE BANDS means no burst is active, so no entry can fire until price stretches out again. BURST UP or BURST DOWN means the latch is armed and the next qualifying close can trigger. Thus, the background tint tracks that state, and it refreshes on every tick, so it can flicker inside a forming bar. The squares do not, because they wait for the close.
Every MAD Z Robust Burst setting explained
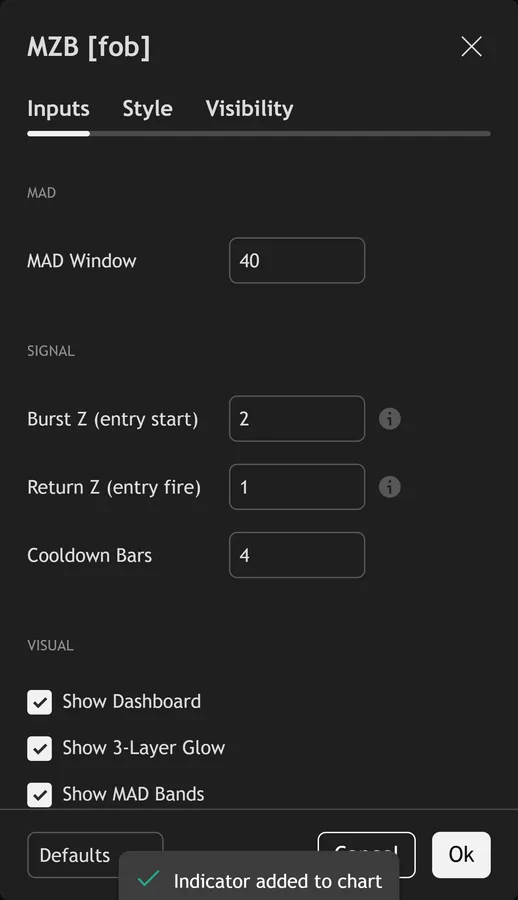
The script exposes 9 inputs, grouped in the settings panel exactly as shown below. Defaults are the published values.
MAD
| Setting | What it does | Default | Range |
|---|---|---|---|
| MAD Window | Sets the mad window used in the calculation. | 40 | 10 to 200 |
Signal
| Setting | What it does | Default | Range |
|---|---|---|---|
| Burst Z (entry start) | Burst regime when |MAD-Z| > this. | 2.0 | 1.0 to 4.0 |
| Return Z (entry fire) | Entry when |MAD-Z| comes back below this from the burst. | 1.0 | 0.2 to 2.0 |
| Cooldown Bars | Sets the cooldown bars used in the calculation. | 4 | 1 to 20 |
Visual
| Setting | What it does | Default | Range |
|---|---|---|---|
| Show Dashboard | Toggles show dashboard on the chart. | on | on / off |
| Show 3-Layer Glow | Toggles show 3-layer glow on the chart. | on | on / off |
| Show MAD Bands | Toggles show mad bands on the chart. | on | on / off |
| Buy Color (Cyan) | Colour used for buy color (cyan). | #18ffff | |
| Sell Color (Pink) | Colour used for sell color (pink). | #ff80ab |
Alerts built into MAD Z Robust Burst
The script ships 11 alert conditions. Hence, open the alert dialog on the chart, pick the indicator as the condition source, then choose the event you want. Alerts fire on the close of the bar, so they follow the same confirmed-bar rule the on-chart signals use.
- MZB Buy
- MZB Sell
- MZB Any Signal
- MZB Burst Up
- MZB Burst Down
- MZB Extreme
- MZB Return Up
- MZB Return Down
- MZB Webhook JSON
Other markets and timeframes
The output is scale free. Next, dividing by the MAD strips out the price unit, so a MAD-Z of 2.5 means the same thing on EURUSD, on gold and on a crypto pair. Nothing in the signal path uses pips, points or volume. Then, that makes the defaults portable without retuning. Two settings still deserve a per market look. Yet, the 40-bar window sets how much history defines normal. The 4-bar cooldown spaces signals out, and a fast intraday chart usually wants a larger one.

Limitations worth knowing
This is a counter-trend tool by construction. In a sustained trend the median trails behind price, MAD-Z stays elevated for long stretches, and each return signal fires against the dominant move. The script carries no trend filter, no stop placement, no target and no sizing rule.
Quiet or gappy data breaks the reading. Truly, a window with almost no variation drives MAD toward zero, and the script then forces MAD-Z to 0.0 and prints nothing at all. Extremely calm sessions can therefore go silent right when a burst finally arrives.
The state machine limits what you see. Plainly, signals alternate, so the script never prints two buys in a row even if the second setup looks better. The 4-bar cooldown can also suppress a genuine follow-up entry. Also, and the burst latch clears only below 0.5, so a stretch that stalls midway keeps the regime armed for a long time.
Get MAD Z Robust Burst on TradingView
Open MAD Z Robust Burst on TradingView
If you also trade MetaTrader, the MT4 and MT5 indicator library is available below.
Get the complete indicator library
One email unlocks the full MT4 and MT5 indicator library. Indeed, this TradingView script stays free on TradingView – the button above adds it to your chart.
Using it alongside MetaTrader
Adding a script on TradingView takes one click, so there is no install step here. Still, if you want the same idea on MetaTrader, the MT4 and MT5 indicator installation guide walks through copying files into the data folder and attaching them to a chart. You can also browse the full MetaTrader indicator library, the MT4 indicators section, or the other free TradingView scripts published on this profile. For related chart tools see the MT5 indicators section and the forex trading strategies guides.
External references
- Stochastic oscillator on Wikipedia
- Stochastic Oscillator at Investopedia
- Raff Regression Channel at StockCharts ChartSchool
Frequently asked questions
Does MAD Z Robust Burst repaint?
The buy and sell conditions both require barstate.isconfirmed, and the squares plot from those same flags, so a printed signal stays on its bar. Thus, the dashboard numbers and the burst background update on every tick, so those move while a bar is still forming.
Why the 1.4826 constant?
It rescales the median absolute deviation so it estimates the same quantity as a standard deviation on normally distributed data. Hence, without it, a MAD-based score would read on a different scale from a classic z-score and the 2.0 threshold would lose its usual meaning.
Why did a huge spike produce no square?
The spike itself is the burst, not the entry. Next, the script arms the latch at 2.0 and only fires when MAD-Z travels back to 1.0 or closer to the median. If price never returns that far, or the cooldown has not elapsed, or the last signal already pointed the same way, no square prints.
Which timeframe works best?
Any timeframe works, because the score stays relative to its own 40-bar window. Then, higher timeframes produce fewer and slower bursts. On very fast charts, raise the cooldown and consider widening the MAD window.
How much should I rely on this indicator?
Treat it as one input, not a decision. Yet, it is a chart analysis tool, not trading advice. Test it on your own markets and timeframes before relying on it. Results are not guaranteed; past performance is not indicative of future results.

About the author
Written by Dominic Walsh, a Forex trader and MT4/MT5 indicator, Expert Advisor and script developer. Every tool on forexmt4systems.com is tested on live charts before release and ships with ready-to-use compiled MT4 (.ex4) and MT5 (.ex5) files. Learn more about the trader and developer behind this site.
How we build, test and correct every tool: Editorial & Testing Policy. Trading carries risk; see the disclaimer.