
Magnetic Field Detector is a key levels indicator TradingView traders can use to find the price that keeps pulling the market back. Also, it cuts the last 120 bars into 25 price bins, then counts how many bars touched each one. The busiest bin becomes the magnet. Indeed, the script draws it in gold, tracks a runner-up in cyan, and signals only when price clears the magnet on above-average volume.
It is free and open source. Still, you can add it to any chart from the Magnetic Field Detector script page on TradingView, and the full Pine source is published there for you to read.
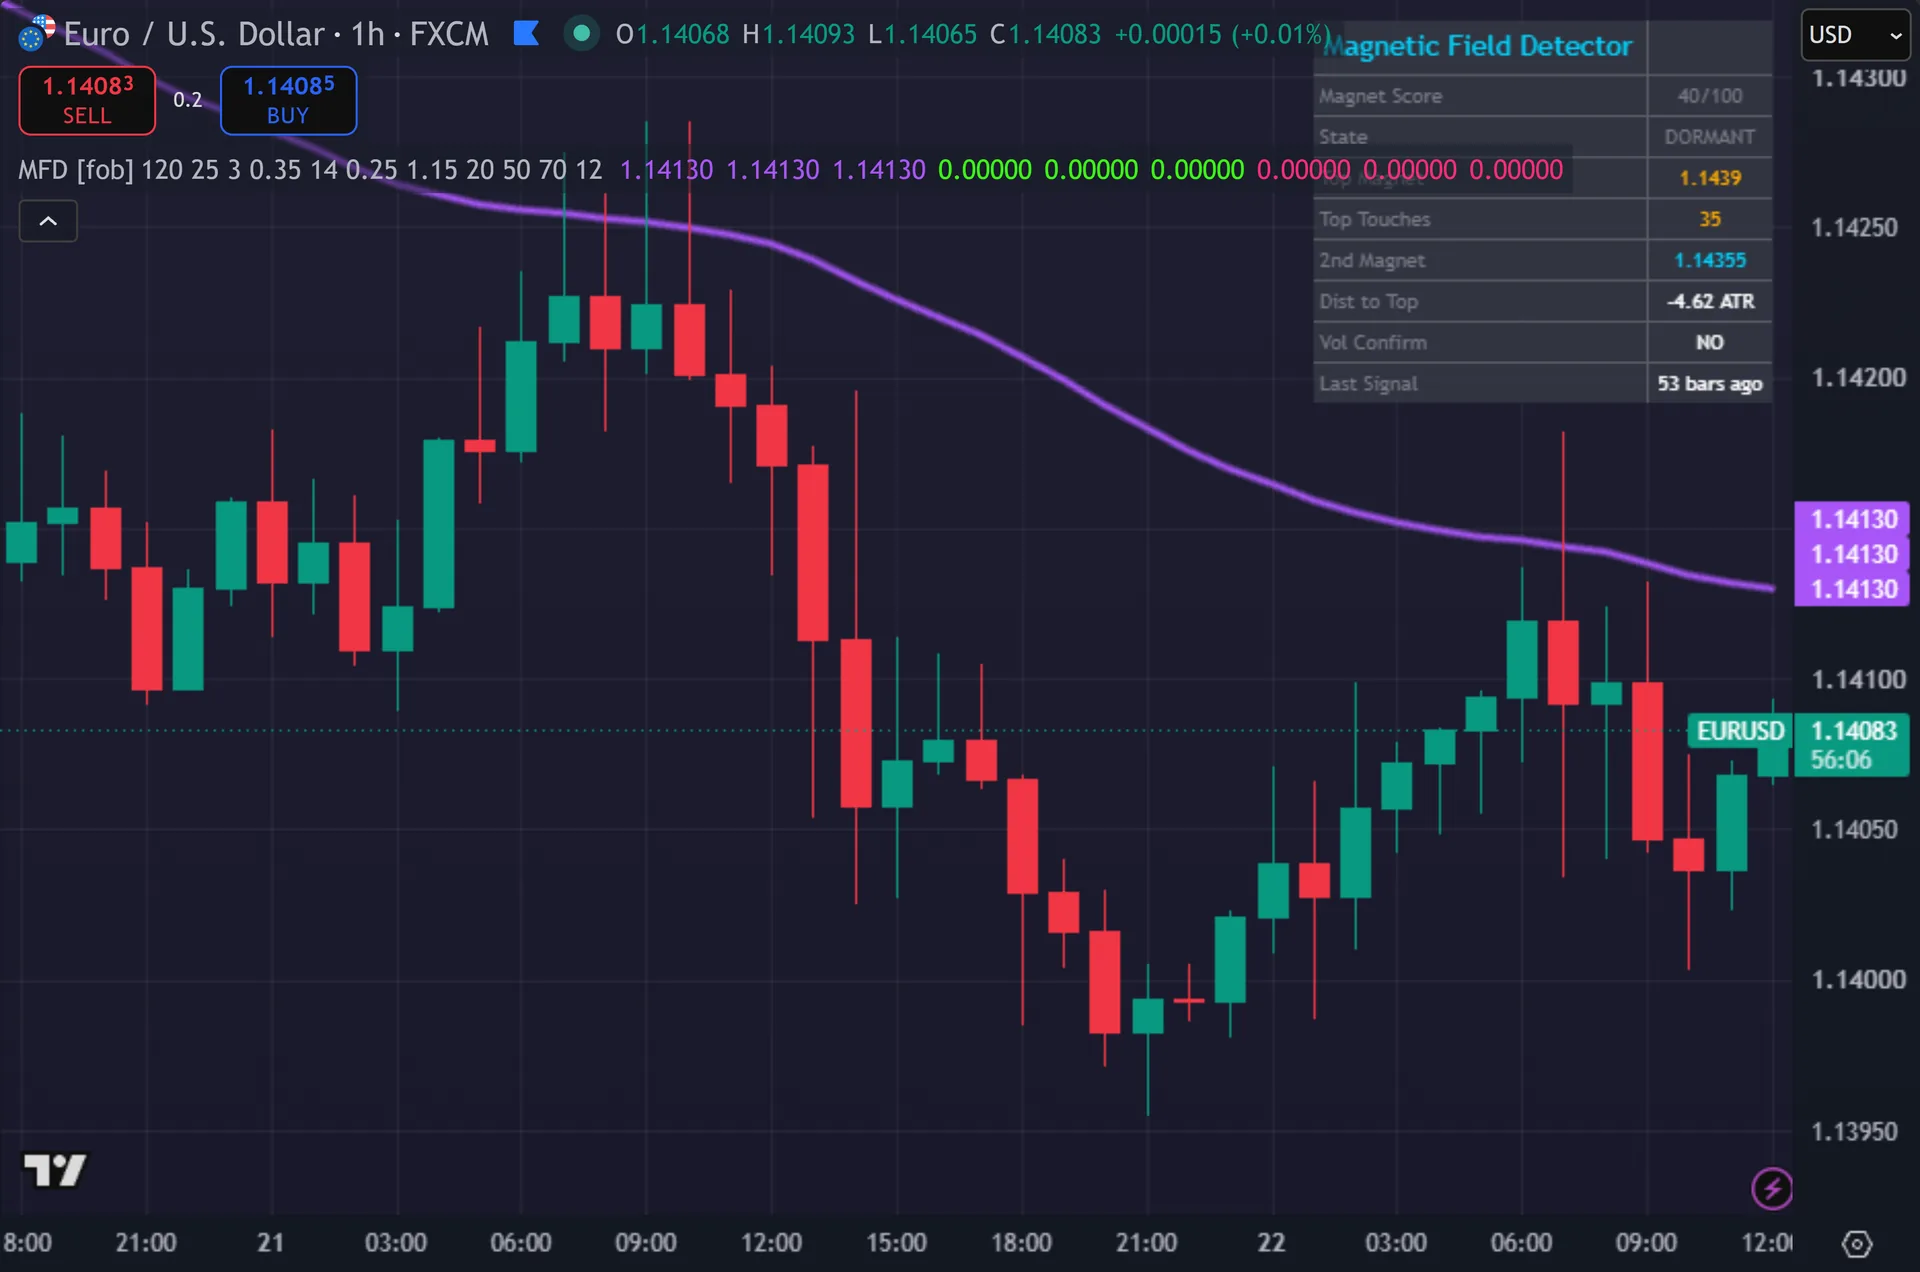
What Magnetic Field Detector plots on the price chart
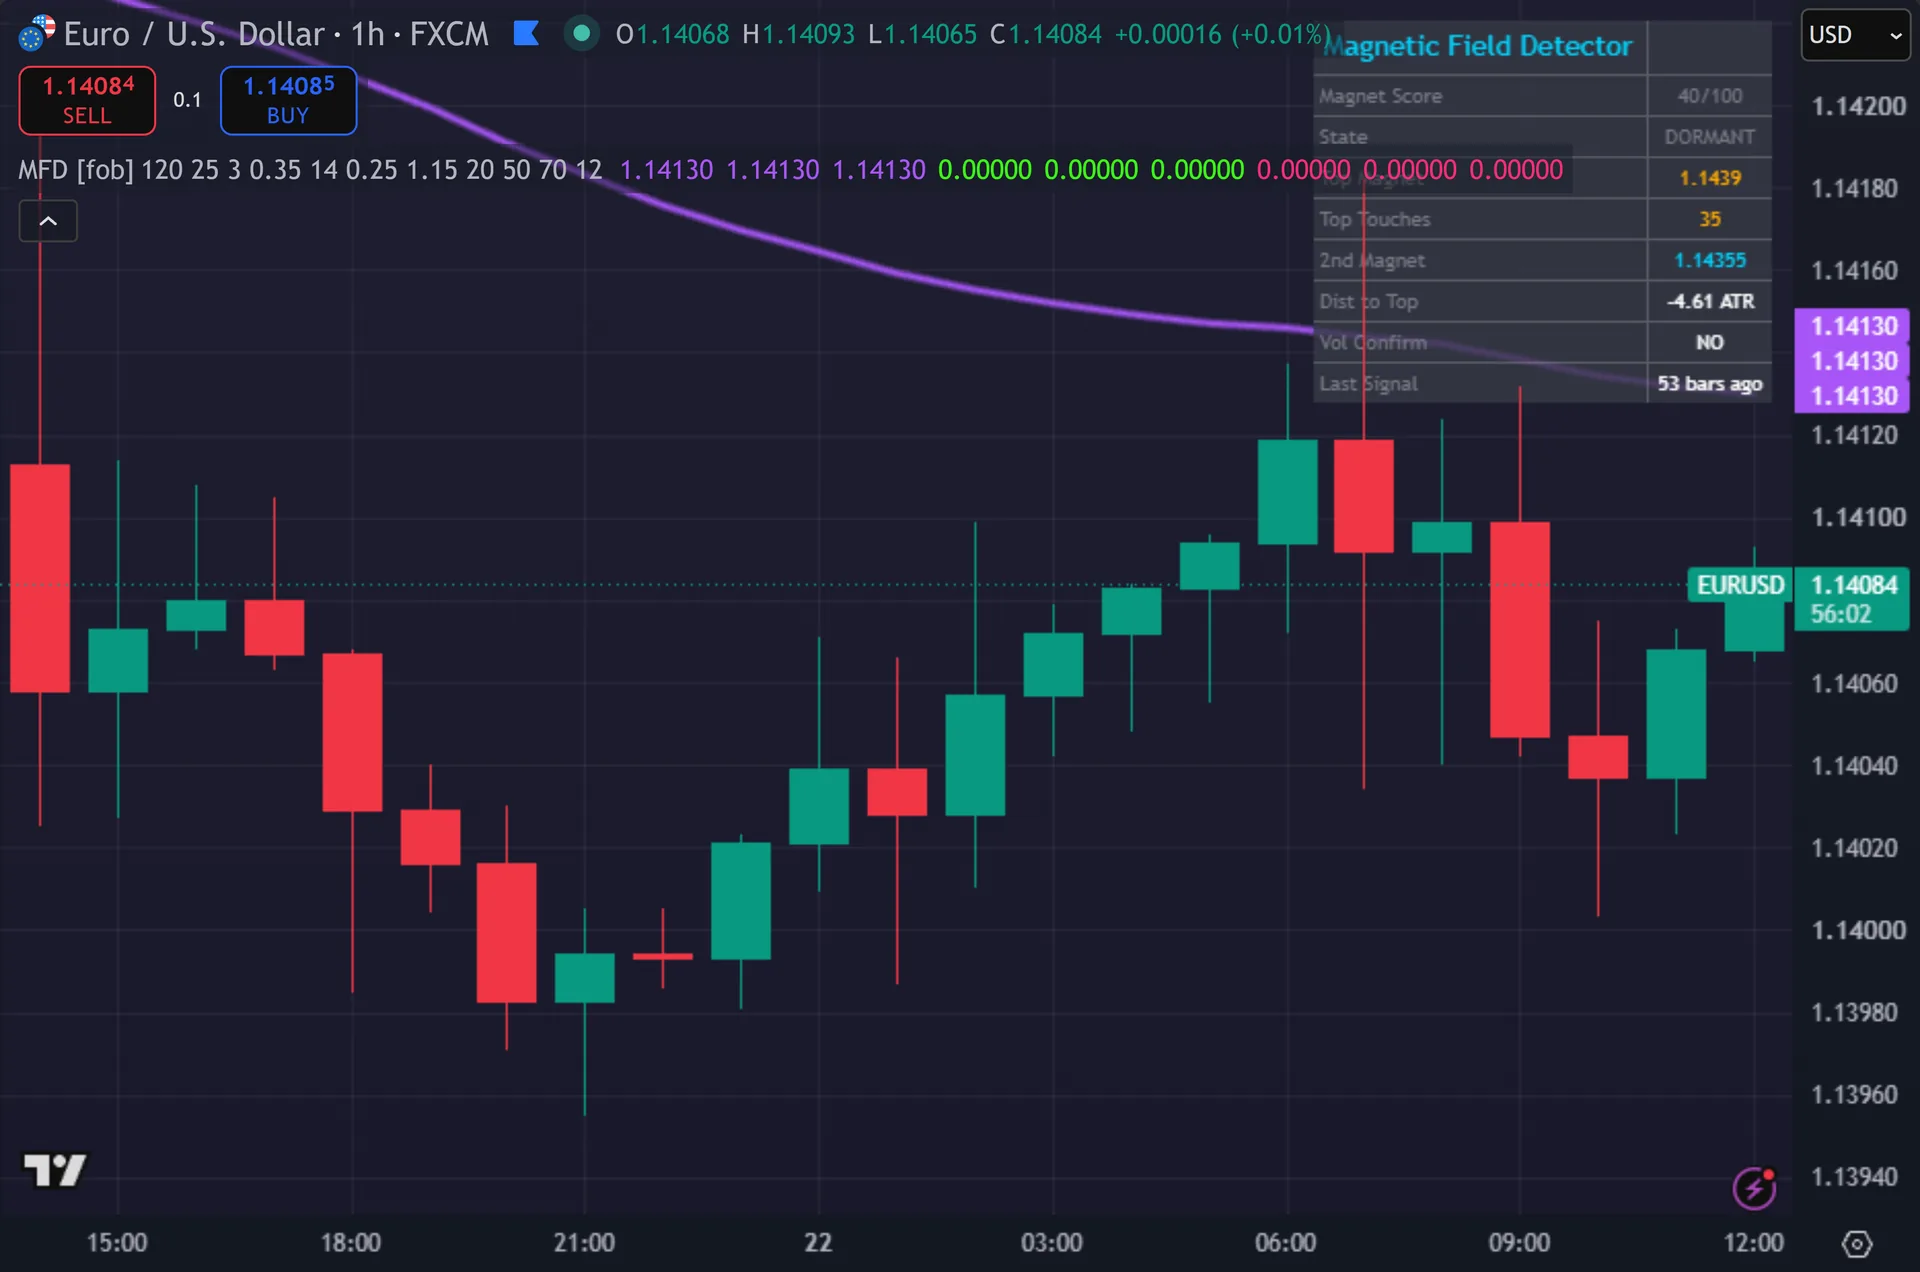
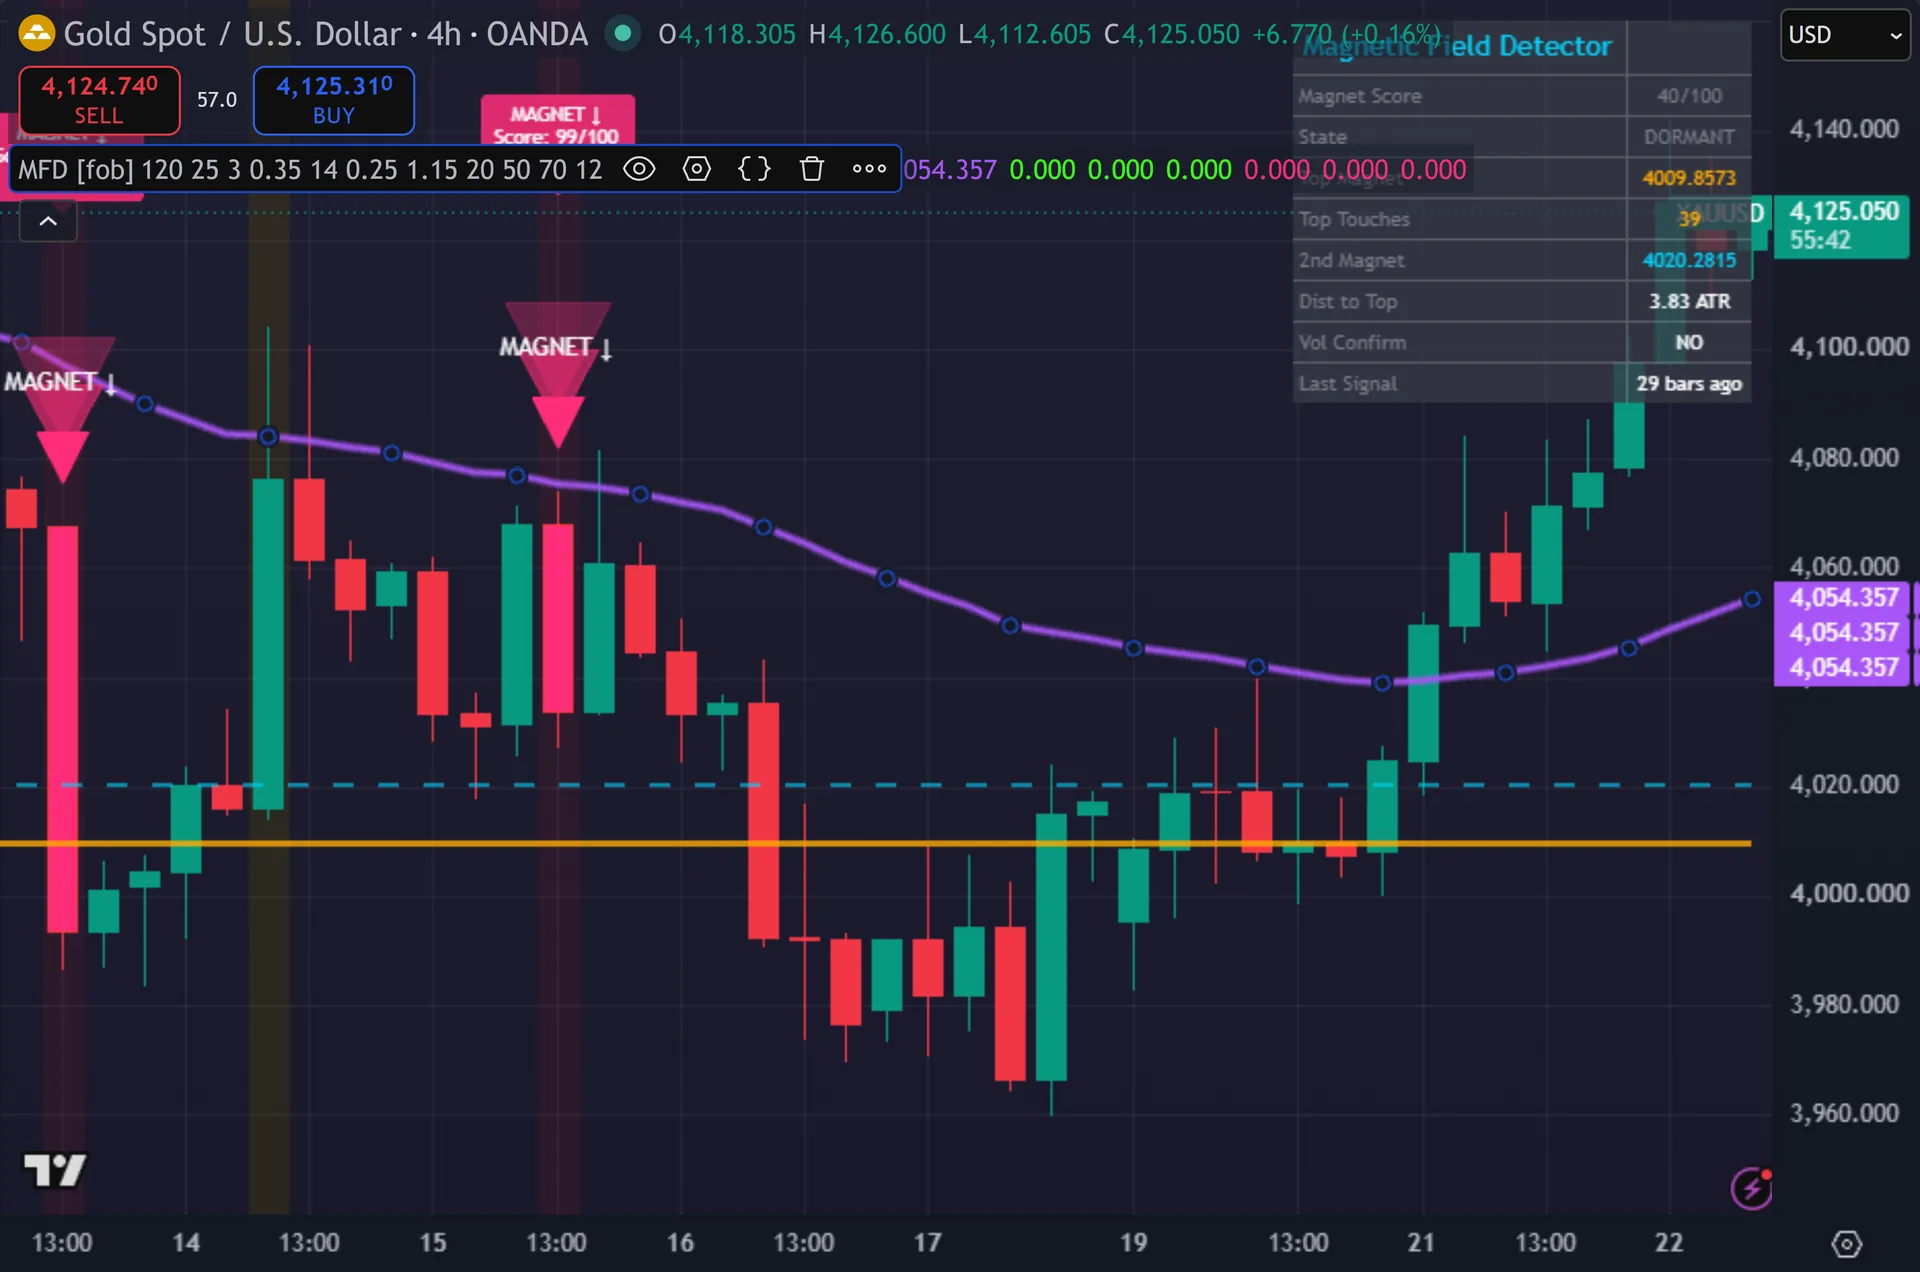
A thick gold line marks the top magnet, stretched back across the scan window. Thus, a dashed cyan line marks the runner-up whenever it also clears the touch minimum. A three-layer purple glow draws the 50-period bias EMA. Hence, signals print as stacked triangles tagged MAGNET up or down, the bar changes colour, and a label reports the magnet score out of 100 with the touch count. The background tints by score band. Next, a nine-row dashboard lists score, state, both levels, distance in ATR and volume confirmation.
How Magnetic Field Detector is built
Counting time at price
The scan is a histogram of bars, not a volume profile. Then, the script takes the highest high and lowest low over 120 bars, then cuts that span into 25 equal bins. It walks those 120 bars one by one. For each bar it finds the bin holding the low and the bin holding the high, then adds a touch to every bin between them. Volume plays no part at this stage.
The bin with the most touches becomes the magnet, and its price is the bin centre. Yet, so the level lands on a midpoint rather than on an exact wick. The script then zeroes that bin and repeats the search to find a second level. Truly, a magnet counts as valid only when its touch count reaches the minimum, which defaults to three.
Both counts recompute on every bar from a rolling window. Plainly, the lines are deleted and redrawn each time, so what you see is the current window’s answer rather than a record of past levels. Bins in the middle of a range also collect touches faster than bins near the extremes, simply because more bar ranges cross them. Also, note that the Touch Zone input does not enter this calculation at all.
Scoring the break
The score has three parts. Indeed, touches contribute six points each and cap at 40, so seven touches already max that component. Relative volume contributes forty points per unit above average and caps at 25, which saturates near 1.63 times the average. Still, a live break adds a flat 35. The three parts add together and cap at 100.
Do the arithmetic and the default threshold tells a story. Thus, without a break the ceiling sits at 65, below the 70 default, so a qualifying signal always needs a break. A break means close clears the magnet by 0.25 ATR while the previous close sat on the other side of that same band. Hence, volume must also run at least 1.15 times its 20-bar average, or the break does not register.
Direction comes from the 50-period EMA. Next, a buy needs an up break with close above that EMA and the EMA rising across the last three bars. A sell needs the mirror image. Then, two gates close the chain: a twelve-bar cooldown and barstate.isconfirmed, so a triangle appears only once the bar has finished. State words track the score, reading DORMANT under 50, CHARGED from 50, BREAKING from 70 and RUPTURED from 85.
How to read the signals
Treat the gold line as a centre of gravity rather than as classic support or resistance. Yet, it marks the price band where the last 120 bars spent the most time, so price tends to drift back toward it during balance. The Dist to Top row states how far the current close sits from it in ATR. Truly, small values mean price is inside the field. Large values mean it has already pulled away.
Use the score bands to judge context, not certainty. Plainly, touches saturate quickly, so most of the movement in the score comes from the volume component and the flat 35 points a break adds. A reading of CHARGED tells you a level is well established and volume is picking up. Also, RUPTURED tells you a break just fired with heavy participation behind it.
The cyan runner-up often matters more than the arrow. Indeed, after a break away from the gold level, that second magnet is the next place the histogram says bars have clustered. Signals themselves confirm on the close, so the triangle lands after the candle completes, and both lines redraw on the next bar from a window that has moved forward by one.
Every Magnetic Field Detector setting explained
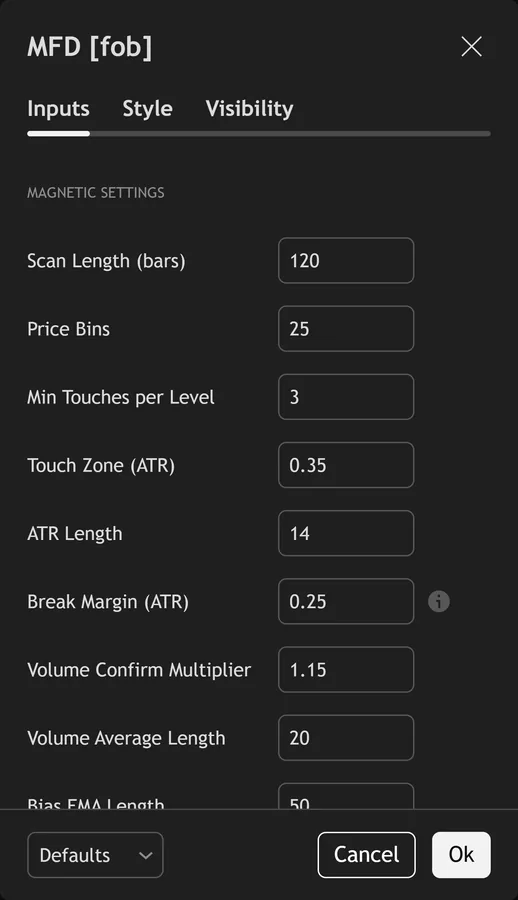
The script exposes 18 inputs, grouped in the settings panel exactly as shown below. Defaults are the published values.
Magnetic Settings
| Setting | What it does | Default | Range |
|---|---|---|---|
| Scan Length (bars) | Sets the scan length (bars) used in the calculation. | 120 | 30 to 500 |
| Price Bins | Sets the price bins used in the calculation. | 25 | 10 to 60 |
| Min Touches per Level | Sets the min touches per level used in the calculation. | 3 | 2 to 10 |
| Touch Zone (ATR) | Sets the touch zone (atr) used in the calculation. | 0.35 | 0.1 to 1.5 |
| ATR Length | Sets the atr length used in the calculation. | 14 | 5 to 50 |
| Break Margin (ATR) | Close must exceed level by this ATR fraction | 0.25 | 0.05 to 1.0 |
| Volume Confirm Multiplier | Sets the volume confirm multiplier used in the calculation. | 1.15 | 1.0 to 2.5 |
| Volume Average Length | Sets the volume average length used in the calculation. | 20 | 5 to 100 |
| Bias EMA Length | Sets the bias ema length used in the calculation. | 50 | 10 to 200 |
Signal Settings
| Setting | What it does | Default | Range |
|---|---|---|---|
| Magnet Score Threshold | Sets the magnet score threshold used in the calculation. | 70 | 40 to 95 |
| Signal Cooldown Bars | Sets the signal cooldown bars used in the calculation. | 12 | 3 to 50 |
Visual Settings
| Setting | What it does | Default | Range |
|---|---|---|---|
| Show Magnet Dashboard | Toggles show magnet dashboard on the chart. | on | on / off |
| Show Magnet Background | Toggles show magnet background on the chart. | on | on / off |
| Show 3-Layer Signal Glow | Toggles show 3-layer signal glow on the chart. | on | on / off |
| Show Bias EMA Glow | Toggles show bias ema glow on the chart. | on | on / off |
| Show Magnetic Lines | Toggles show magnetic lines on the chart. | on | on / off |
| Buy Color | Colour used for buy color. | #39ff14 | |
| Sell Color | Colour used for sell color. | #ff2d78 |
Alerts built into Magnetic Field Detector
The script ships 11 alert conditions. Still, open the alert dialog on the chart, pick the indicator as the condition source, then choose the event you want. Alerts fire on the close of the bar, so they follow the same confirmed-bar rule the on-chart signals use.
- MFD Buy Magnet
- MFD Sell Magnet
- MFD Any Signal
- MFD Ruptured
- MFD Up Break
- MFD Down Break
- MFD Magnet Valid
- MFD Volume Confirm
- MFD Webhook JSON
Other markets and timeframes
Every threshold here stays relative. Thus, the break margin is an ATR fraction, the volume gate is a multiple of the symbol’s own average, and the bins scale with whatever range the last 120 bars produced. So gold, indices, crypto and equities run on the defaults without retuning. Volume is the exception. Spot forex volume comes from broker tick counts rather than an exchange, so the 1.15 multiplier means something slightly different per feed. On a symbol with no volume the gate blocks every signal.
Limitations worth knowing
This marks levels and grades breaks. It runs no trade logic. There is no stop, no target and no sizing anywhere in the source. Hence, the magnet is also a statistic about where bars have already been, not a read of resting orders. The level itself carries no volume weighting, so a slow drift and a violent test count the same when the histogram tallies touches.
The rolling window moves the answer. Next, both levels recompute every bar and only the current window’s lines exist on the chart, so you cannot review where the magnet sat last month. The three-touch minimum is very permissive across a 120-bar scan, and mid-range bins gather touches partly through geometry. Then, the Touch Zone input ships in the panel but affects nothing.
Volume gates everything. Yet, without at least 1.15 times average volume no break registers, so a clean level break on quiet tape produces no signal. Forex tick volume makes that gate provider-dependent. Truly, the twelve-bar cooldown also suppresses a genuine second break that follows soon after the first, and the EMA slope filter blocks breaks that fire against the slower trend.
Get Magnetic Field Detector on TradingView
Open Magnetic Field Detector on TradingView
If you also trade MetaTrader, the MT4 and MT5 indicator library is available below.
Get the complete indicator library
One email unlocks the full MT4 and MT5 indicator library. Plainly, this TradingView script stays free on TradingView – the button above adds it to your chart.
Using it alongside MetaTrader
Adding a script on TradingView takes one click, so there is no install step here. Also, if you want the same idea on MetaTrader, the MT4 and MT5 indicator installation guide walks through copying files into the data folder and attaching them to a chart. You can also browse the full MetaTrader indicator library, the MT4 indicators section, or the other free TradingView scripts published on this profile. For related chart tools see the MT5 indicators section and the forex trading strategies guides.
External references
- Candlestick pattern on Wikipedia
- Pivot Point at Investopedia
- Candlestick Charts at StockCharts ChartSchool
Frequently asked questions
Does the Magnetic Field Detector repaint?
The signals do not. Indeed, both booleans require barstate.isconfirmed, and the plotshapes read those booleans, so a triangle prints only after the bar closes. The lines behave differently. Still, both magnet levels recompute every bar from a rolling 120-bar window and get deleted and redrawn, so the level you see moves as new bars arrive.
Is this a volume profile?
No. Thus, the level search counts how many of the last 120 bars had a high-low range covering each price bin. That measures time at price, and every bar counts once regardless of size. Hence, volume enters only later, as a confirmation gate on the break and as up to 25 points of the magnet score.
Price broke the gold line but no arrow appeared. Why?
Five gates can stop it. Next, volume may have run under 1.15 times its 20-bar average. The close may have missed the 0.25 ATR margin. Then, price may sit on the wrong side of the 50-period EMA, or the EMA slope may point the wrong way. The twelve-bar cooldown may also still be running. Yet, the dashboard shows the score and the volume confirmation row.
What do DORMANT, CHARGED, BREAKING and RUPTURED mean?
They are score bands, nothing more. Truly, under 50 reads DORMANT, from 50 reads CHARGED, from 70 reads BREAKING and from 85 reads RUPTURED. Since a break contributes a flat 35 points, anything at BREAKING or above means a break is active on the current bar with volume behind it.
How much should I rely on this indicator?
Treat it as one input, not a decision. Plainly, it is a chart analysis tool, not trading advice. Test it on your own markets and timeframes before relying on it. Results are not guaranteed; past performance is not indicative of future results.

About the author
Written by Dominic Walsh, a Forex trader and MT4/MT5 indicator, Expert Advisor and script developer. Every tool on forexmt4systems.com is tested on live charts before release and ships with ready-to-use compiled MT4 (.ex4) and MT5 (.ex5) files. Learn more about the trader and developer behind this site.
How we build, test and correct every tool: Editorial & Testing Policy. Trading carries risk; see the disclaimer.