
Price remembers a handful of levels. Also, yesterday’s high, yesterday’s low, last week’s extremes and the big round numbers. Market Memory Levels is a previous day high low indicator TradingView traders can leave running all session. Indeed, it plots those references, then watches for a rejection candle within 0.3 ATR of any of them. Volume has to confirm before an arrow prints, and the dashboard keeps score.
It is free and open source. Still, you can add it to any chart from the Market Memory Levels script page on TradingView, and the full Pine source is published there for you to read.
What Market Memory Levels plots on the price chart
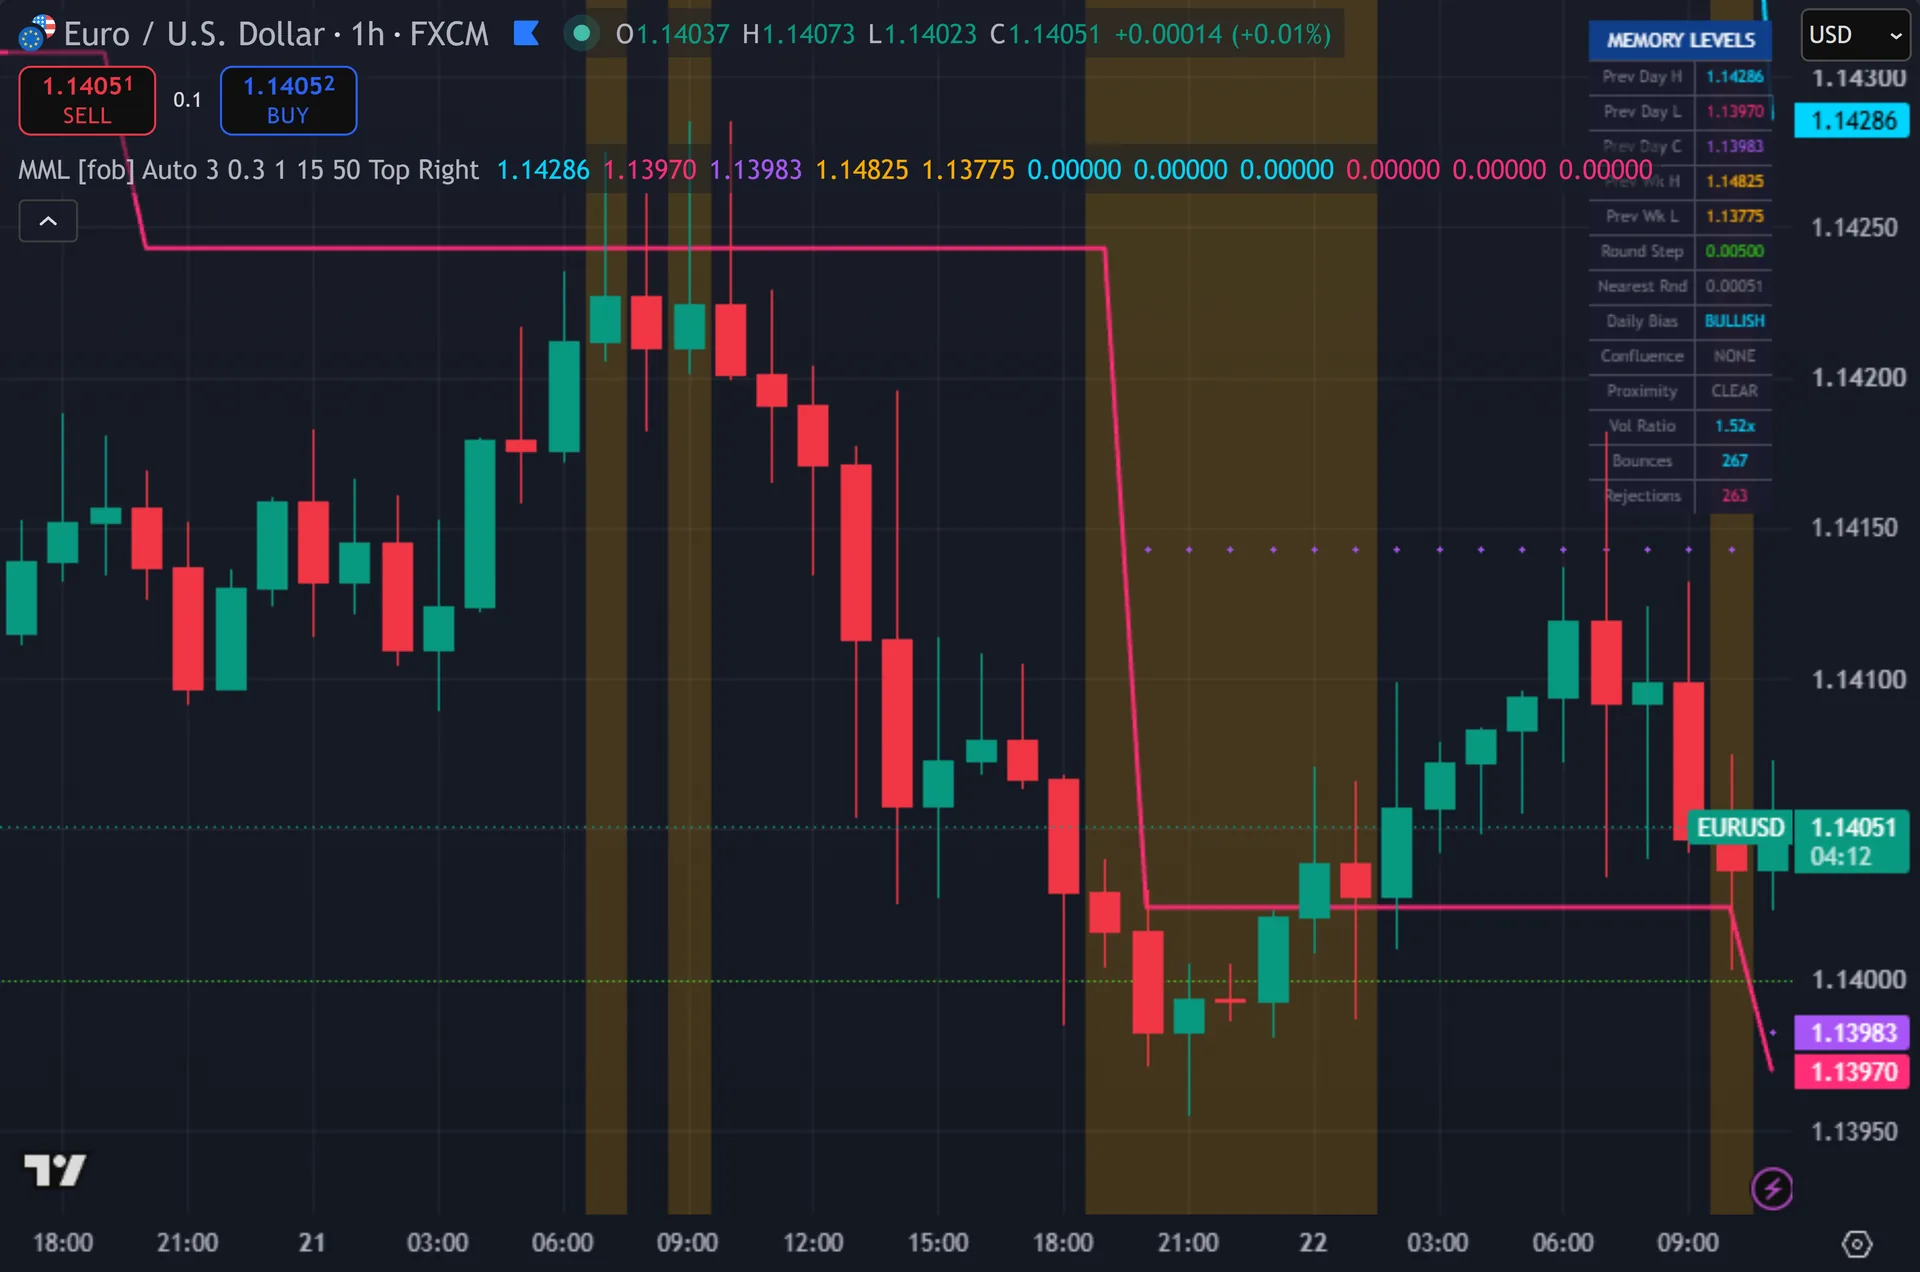
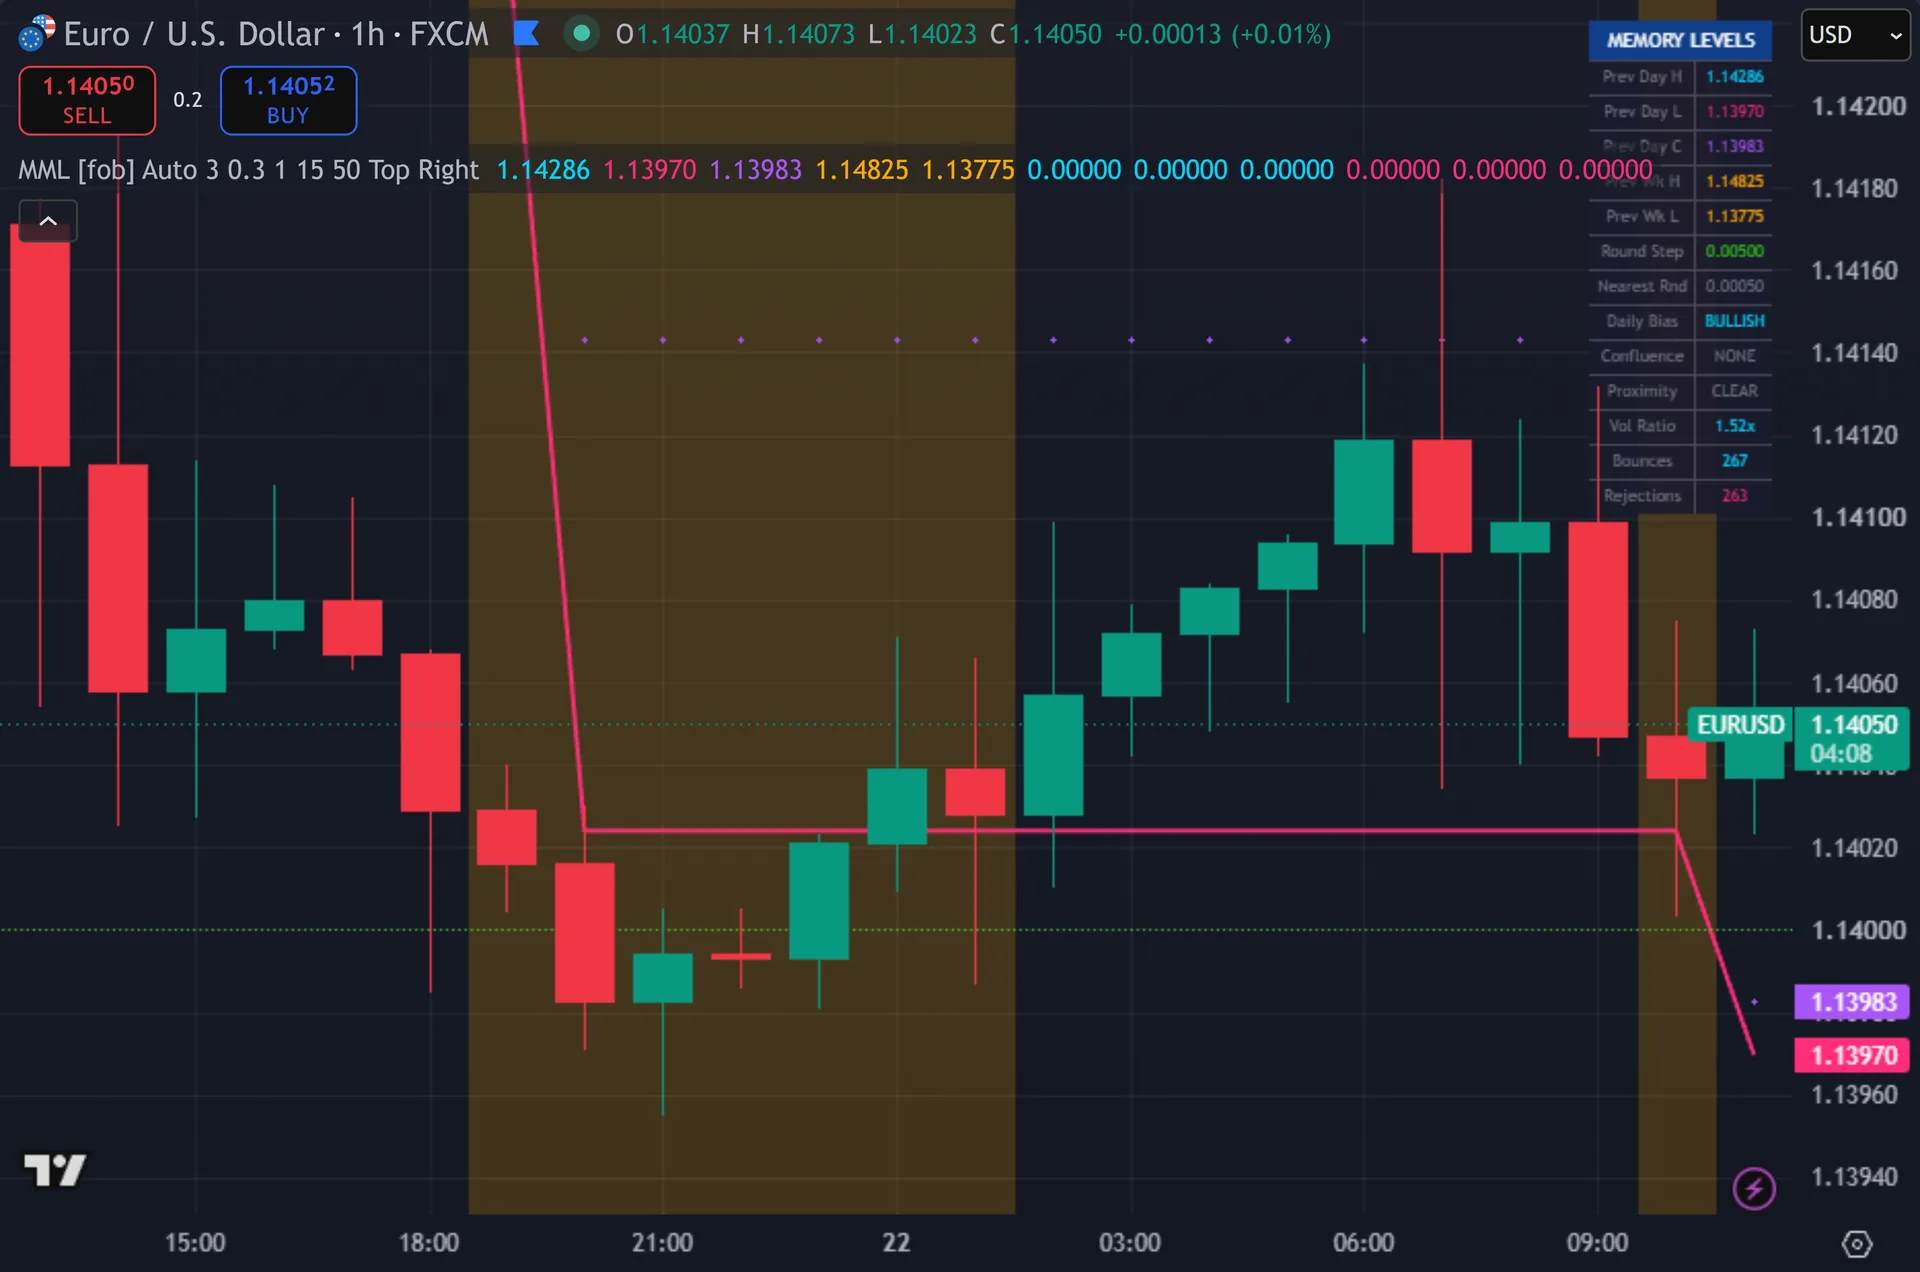
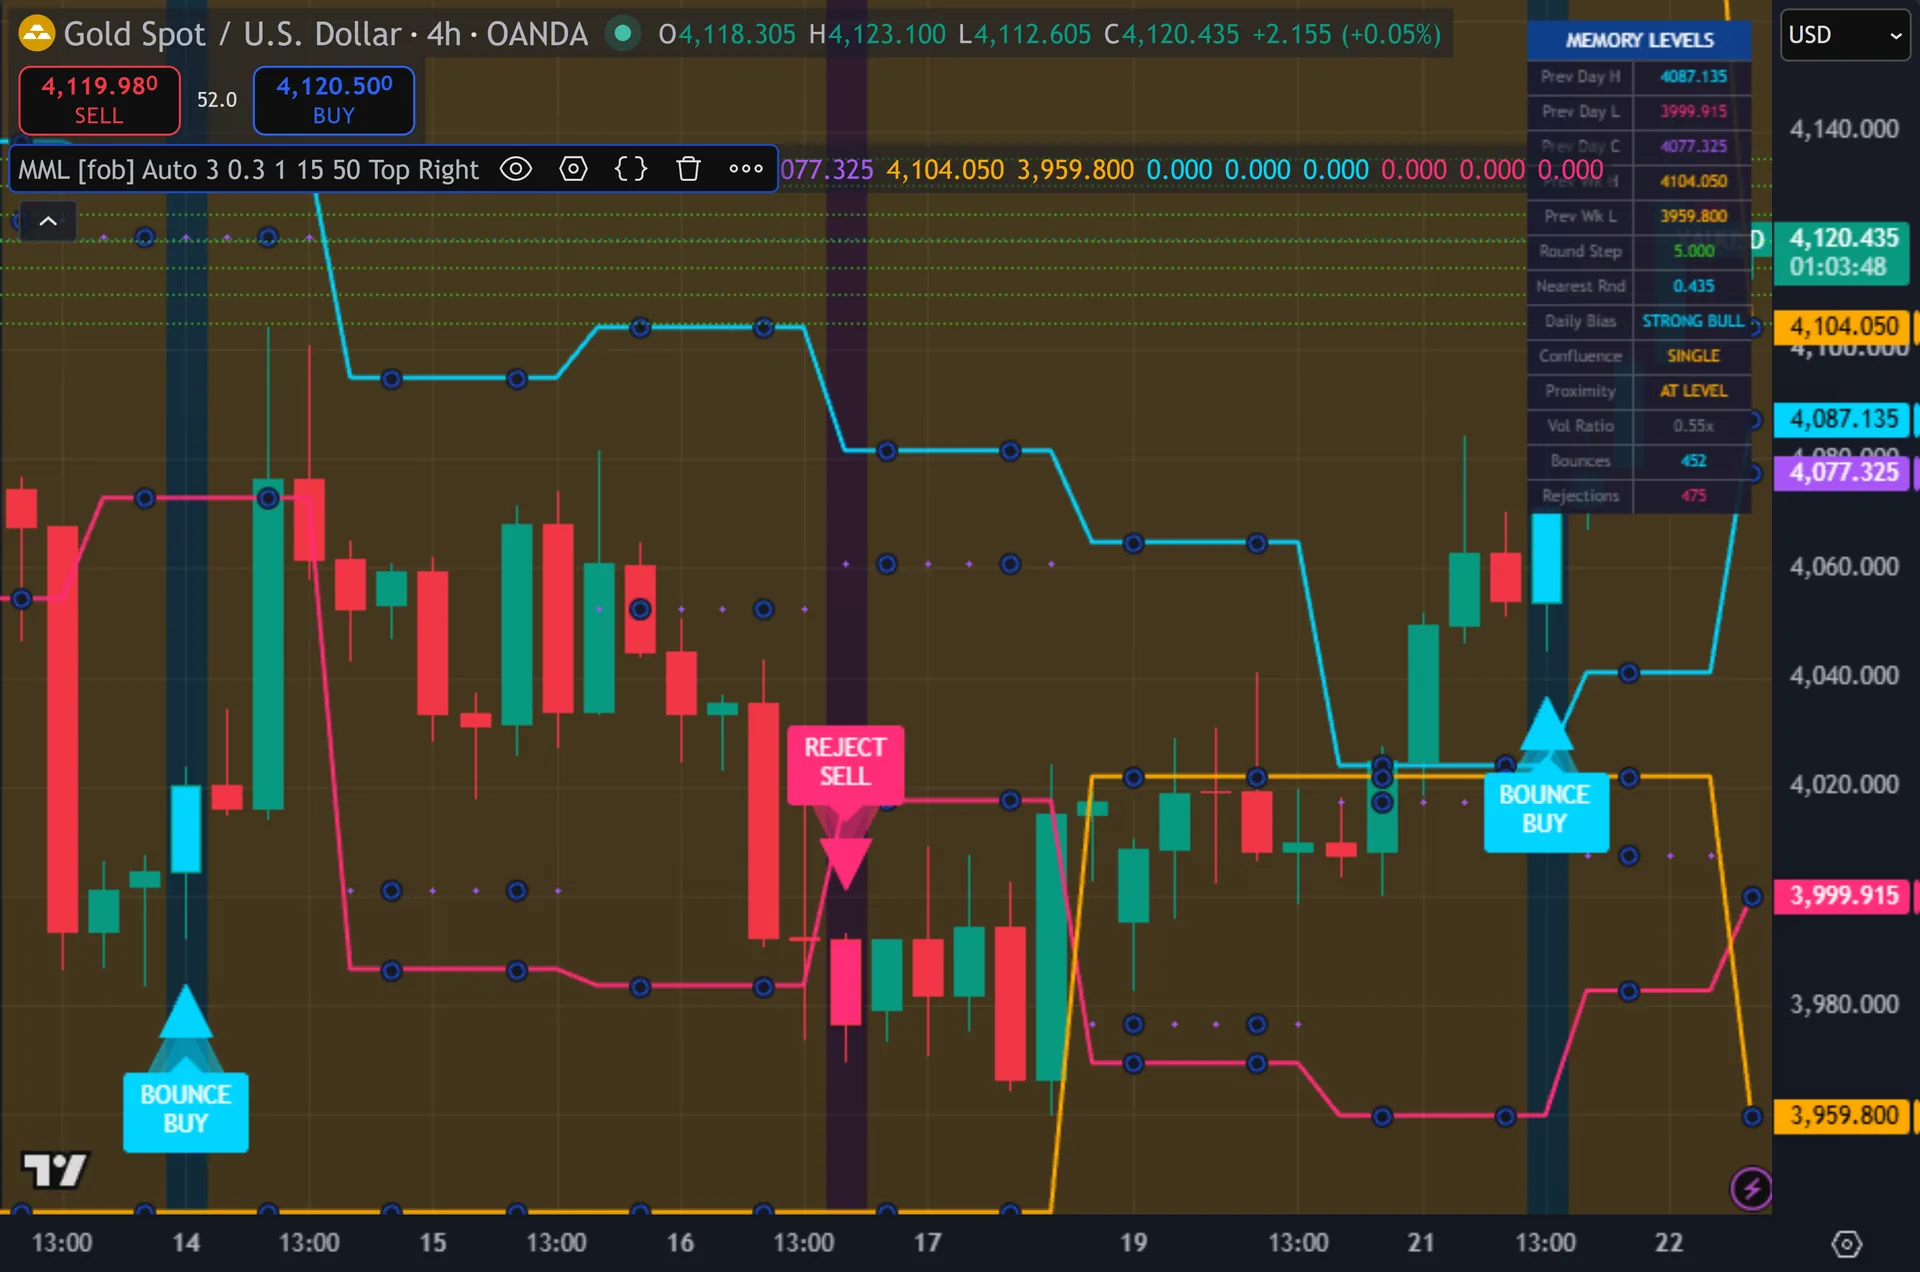
Five level lines run across the chart: previous day high, low and close, plus previous week high and low. Thus, the close plots as a cross series, the rest as solid lines. Round number lines appear on the last bar only, three above and three below the current step, each carrying a price label. Hence, signals print as triangles with a BOUNCE BUY or REJECT SELL label. A fourteen-row dashboard lists every level price, the round step, distance to the nearest round number, daily bias, confluence, volume ratio and running signal counts.
How Market Memory Levels is built
Where the levels come from
Daily and weekly values arrive through five request.security calls on the D and W timeframes. Next, each one asks for the previous completed bar – high[1], low[1], close[1] – with lookahead off. So the lines hold still through the session and step to new values only when a new daily or weekly bar opens.
Round numbers come from a step size the script picks per instrument. On forex it uses 500 ticks, which is 50 pips on a five-digit feed. On crypto it uses 1000 price units, and on anything else 5. Then, the Round Number Mode dropdown overrides that. The script then floors current price to that step and builds three levels above and three below.
What turns a level into a signal
Proximity is measured in volatility, not pips. Yet, the script multiplies ATR(14) by 0.3 and treats any level inside that distance from the close as in play. That keeps the trigger zone sane across a quiet Asian range and a fast news hour alike.
The candle has to do the work next. Truly, a bounce needs a green bar whose body covers more than 40 percent of its range. A rejection needs the same body strength in a red bar. Plainly, a thin doji sitting on the level does not qualify. Buy signals also need a support-side level nearby – previous day low, previous week low, or a round number under price. Also, sell signals need the resistance-side equivalent.
Two gates finish the job. Indeed, volume must beat its own 20-bar average by the multiplier you set, which starts at 1.0. And at least 15 bars must have passed since the last signal. Still, both signals wait for the bar to close, so an arrow lands only on a completed candle.
How to read the signals
Use the dashboard as a positioning check before you read any arrow. Thus, daily Bias shows STRONG BULL when price holds above yesterday’s high, BULLISH above yesterday’s close, and the bearish equivalents below the low and close. It tells you which side of the memory levels you trade.
Confluence is the number that changes weight. Hence, it counts up to three at once: a daily or weekly support, its resistance-side counterpart, and a round number. A bounce off the previous day low that also sits on a 50-pip round number reads HIGH. Next, that level carries more weight than either one alone.
The arrow marks a reaction that already happened. Then, it confirms on the close of the rejection bar, so you act on the next one. Check the Vol Ratio row as well. Yet, the gate only asks for 1.0 times average, and a 2.5x reading behind the same arrow tells a very different story.
Every Market Memory Levels setting explained
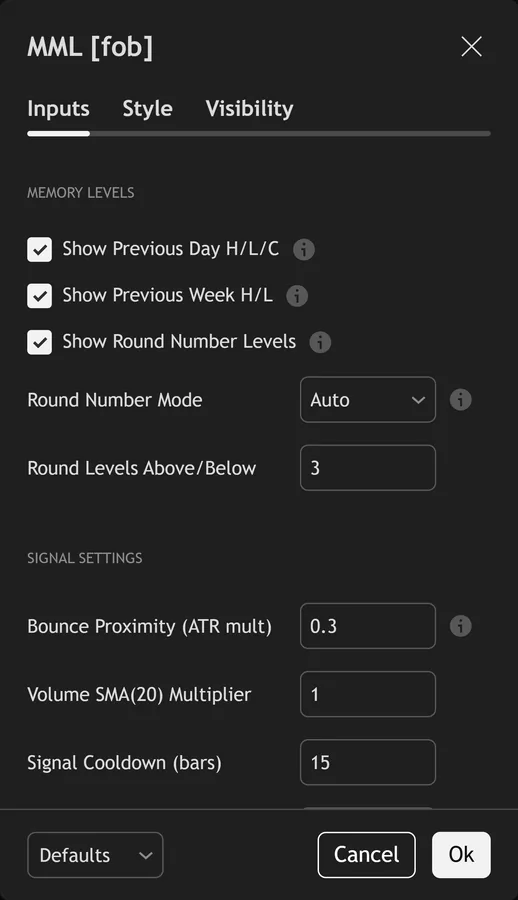
The script exposes 22 inputs, grouped in the settings panel exactly as shown below. Defaults are the published values.
Memory Levels
| Setting | What it does | Default | Range |
|---|---|---|---|
| Show Previous Day H/L/C | Plot previous day high, low, and close | on | on / off |
| Show Previous Week H/L | Plot previous week high and low | on | on / off |
| Show Round Number Levels | Auto-detect and plot round number levels | on | on / off |
| Round Number Mode | Auto-detect or manually set round number spacing | Auto | Auto, Forex 50pip, Crypto 1000, Stocks 5 |
| Round Levels Above/Below | Sets the round levels above/below used in the calculation. | 3 | 1 to 10 |
Signal Settings
| Setting | What it does | Default | Range |
|---|---|---|---|
| Bounce Proximity (ATR mult) | How close price must be to a level | 0.3 | 0.1 to 1.0 |
| Volume SMA(20) Multiplier | Sets the volume sma(20) multiplier used in the calculation. | 1.0 | 0.5 to 3.0 |
| Signal Cooldown (bars) | Sets the signal cooldown (bars) used in the calculation. | 15 | 5 to 50 |
| EMA Filter Length | Sets the ema filter length used in the calculation. | 50 | 10 to 200 |
Visual Settings
| Setting | What it does | Default | Range |
|---|---|---|---|
| Prev Day High Color | Colour used for prev day high color. | color.new(#00d4ff, 0) | |
| Prev Day Low Color | Colour used for prev day low color. | color.new(#ff2d78, 0) | |
| Prev Day Close Color | Colour used for prev day close color. | color.new(#a855f7, 0) | |
| Prev Week Color | Colour used for prev week color. | color.new(#ffaa00, 0) | |
| Round Number Color | Colour used for round number color. | color.new(#39ff14, 30) | |
| Bull Signal Color | Colour used for bull signal color. | color.new(#00d4ff, 0) | |
| Bear Signal Color | Colour used for bear signal color. | color.new(#ff2d78, 0) | |
| Show Info Table | Toggles show info table on the chart. | on | on / off |
| Show Glow Effects | Toggles show glow effects on the chart. | on | on / off |
| Table Position | Choose the table position from the listed options. | Top Right | Top Right, Top Left, Bottom Right, Bottom Left |
Statistics
| Setting | What it does | Default | Range |
|---|---|---|---|
| Show Signal Statistics | Display running signal count | on | on / off |
| Show Proximity Warnings | Highlight when price approaches memory levels | on | on / off |
| Proximity Warning Color | Colour used for proximity warning color. | color.new(#ffaa00, 80) |
Alerts built into Market Memory Levels
The script ships 11 alert conditions. Truly, open the alert dialog on the chart, pick the indicator as the condition source, then choose the event you want. Alerts fire on the close of the bar, so they follow the same confirmed-bar rule the on-chart signals use.
- MML Buy Signal
- MML Sell Signal
- MML Any Signal
- Near Support Level
- Near Resistance Level
- Near Round Number
- Support Bounce
- Resistance Reject
- Volume Confirmed
Other markets and timeframes
Two parts travel well and one needs attention. Plainly, proximity in ATR and volume against its own average adapt to any market, and daily and weekly levels work as universal references. Round numbers are the exception, because the auto step is fixed per instrument class: 500 ticks for forex, 1000 units for crypto, 5 for everything else. On an index at 18,000 or a stock at 12 dollars, set the mode manually. The level lines themselves plot fine anywhere.
Limitations worth knowing
The EMA Filter Length input has no effect in this build. Also, the script calculates a 50-period and a 200-period EMA, then never uses either one in the signal logic. Changing that input will not alter a single arrow on your chart.
Round number lines draw on the last bar only, across a 50-bar window. Indeed, so a historical chart shows no round levels beside older signals, and you cannot review past reactions to them visually. The daily and weekly lines do plot across full history.
The dashboard counters tally signals, not results. Still, bounces and Rejections count how many arrows printed since the chart loaded. They say nothing about what happened next. Thus, the tool also holds no stop, target or sizing logic of any kind.
Get Market Memory Levels on TradingView
Open Market Memory Levels on TradingView
If you also trade MetaTrader, the MT4 and MT5 indicator library is available below.
Get the complete indicator library
One email unlocks the full MT4 and MT5 indicator library. Hence, this TradingView script stays free on TradingView – the button above adds it to your chart.
Using it alongside MetaTrader
Adding a script on TradingView takes one click, so there is no install step here. Next, if you want the same idea on MetaTrader, the MT4 and MT5 indicator installation guide walks through copying files into the data folder and attaching them to a chart. You can also browse the full MetaTrader indicator library, the MT4 indicators section, or the other free TradingView scripts published on this profile. For related chart tools see the MT5 indicators section and the forex trading strategies guides.
External references
- Candlestick pattern on Wikipedia
- Pivot Point at Investopedia
- Candlestick Charts at StockCharts ChartSchool
Frequently asked questions
Does Market Memory Levels repaint?
No. Then, both signals gate on barstate.isconfirmed, and the level requests use lookahead_off against the previous completed daily and weekly bar. So the lines never shift mid-session, and arrows stay on the bar where they printed.
Is it really multi-timeframe?
Yes. Yet, five request.security calls pull daily and weekly highs, lows and closes onto the chart you are on. That is the whole point of the tool – it puts higher timeframe memory in front of a lower timeframe trader.
How close must price be to a level?
Within 0.3 times ATR(14) by default, measured from the close. On a 20 pip ATR that works out near 6 pips. Raise Bounce Proximity toward 1.0 for a wider trigger zone and more signals, or drop it to 0.1 for a tight one.
Why did an obvious bounce print no arrow?
Check three gates. Truly, the candle body may have covered under 40 percent of its range, volume may have sat below its 20-bar average, or the 15-bar cooldown may still have been running. The Proximity row shows whether a level was in range at all.
How much should I rely on this indicator?
Treat it as one input, not a decision. Plainly, it is a chart analysis tool, not trading advice. Test it on your own markets and timeframes before relying on it. Results are not guaranteed; past performance is not indicative of future results.

About the author
Written by Dominic Walsh, a Forex trader and MT4/MT5 indicator, Expert Advisor and script developer. Every tool on forexmt4systems.com is tested on live charts before release and ships with ready-to-use compiled MT4 (.ex4) and MT5 (.ex5) files. Learn more about the trader and developer behind this site.
How we build, test and correct every tool: Editorial & Testing Policy. Trading carries risk; see the disclaimer.