
Most alignment tools ask you to flip through charts by hand. Also, multi-Timeframe Confluence System works as a multi timeframe trend indicator TradingView traders can leave running on a single chart. It reads trend, momentum and structure on the 15-minute, 1-hour, 4-hour and daily charts at once. Then it scores how many of them agree, and prints a BUY or SELL label only when your minimum count is met.
It is free and open source. Indeed, you can add it to any chart from the Multi-Timeframe Confluence System script page on TradingView, and the full Pine source is published there for you to read.
What Multi-Timeframe Confluence System plots on the price chart
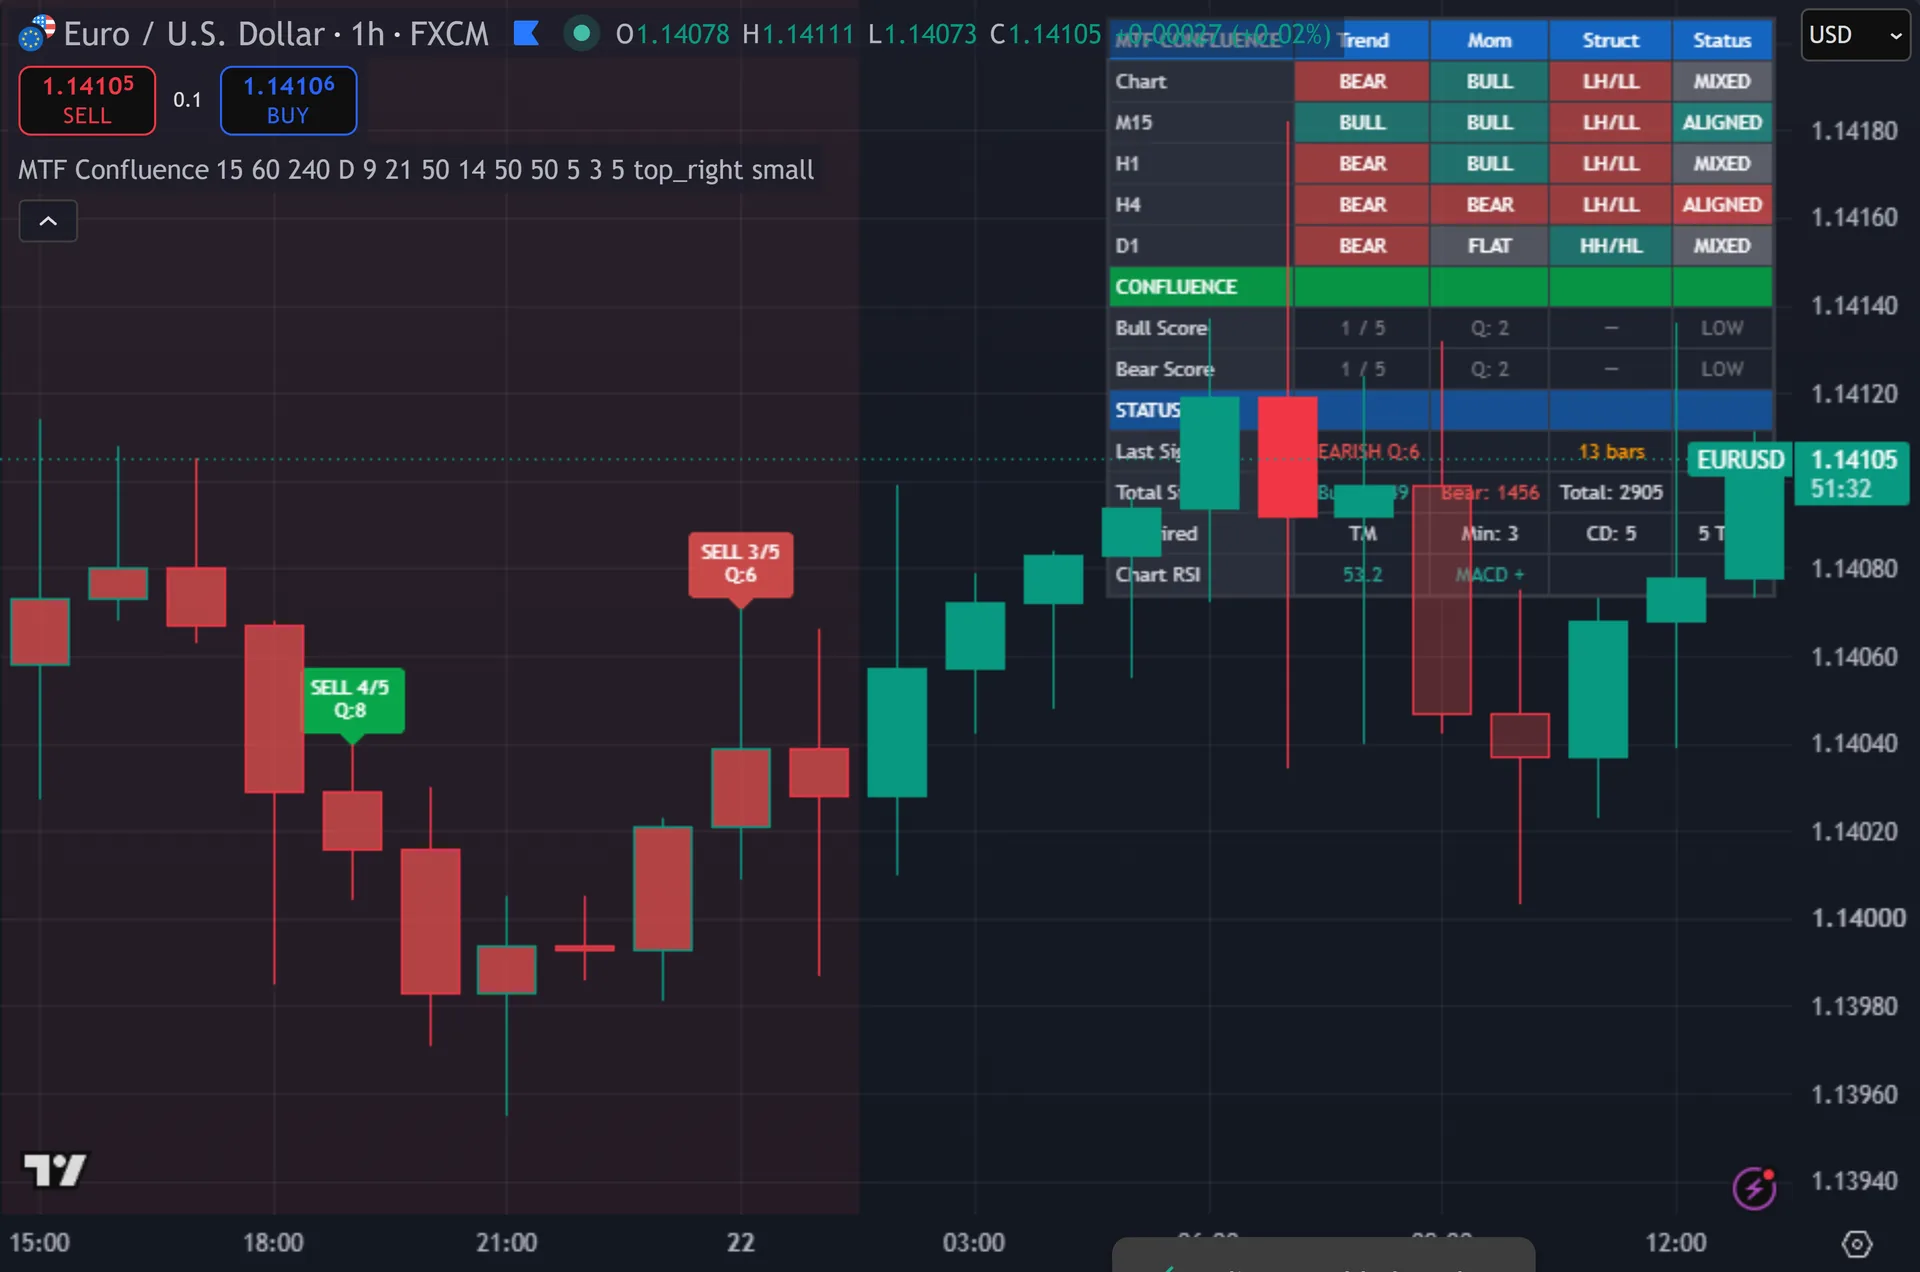
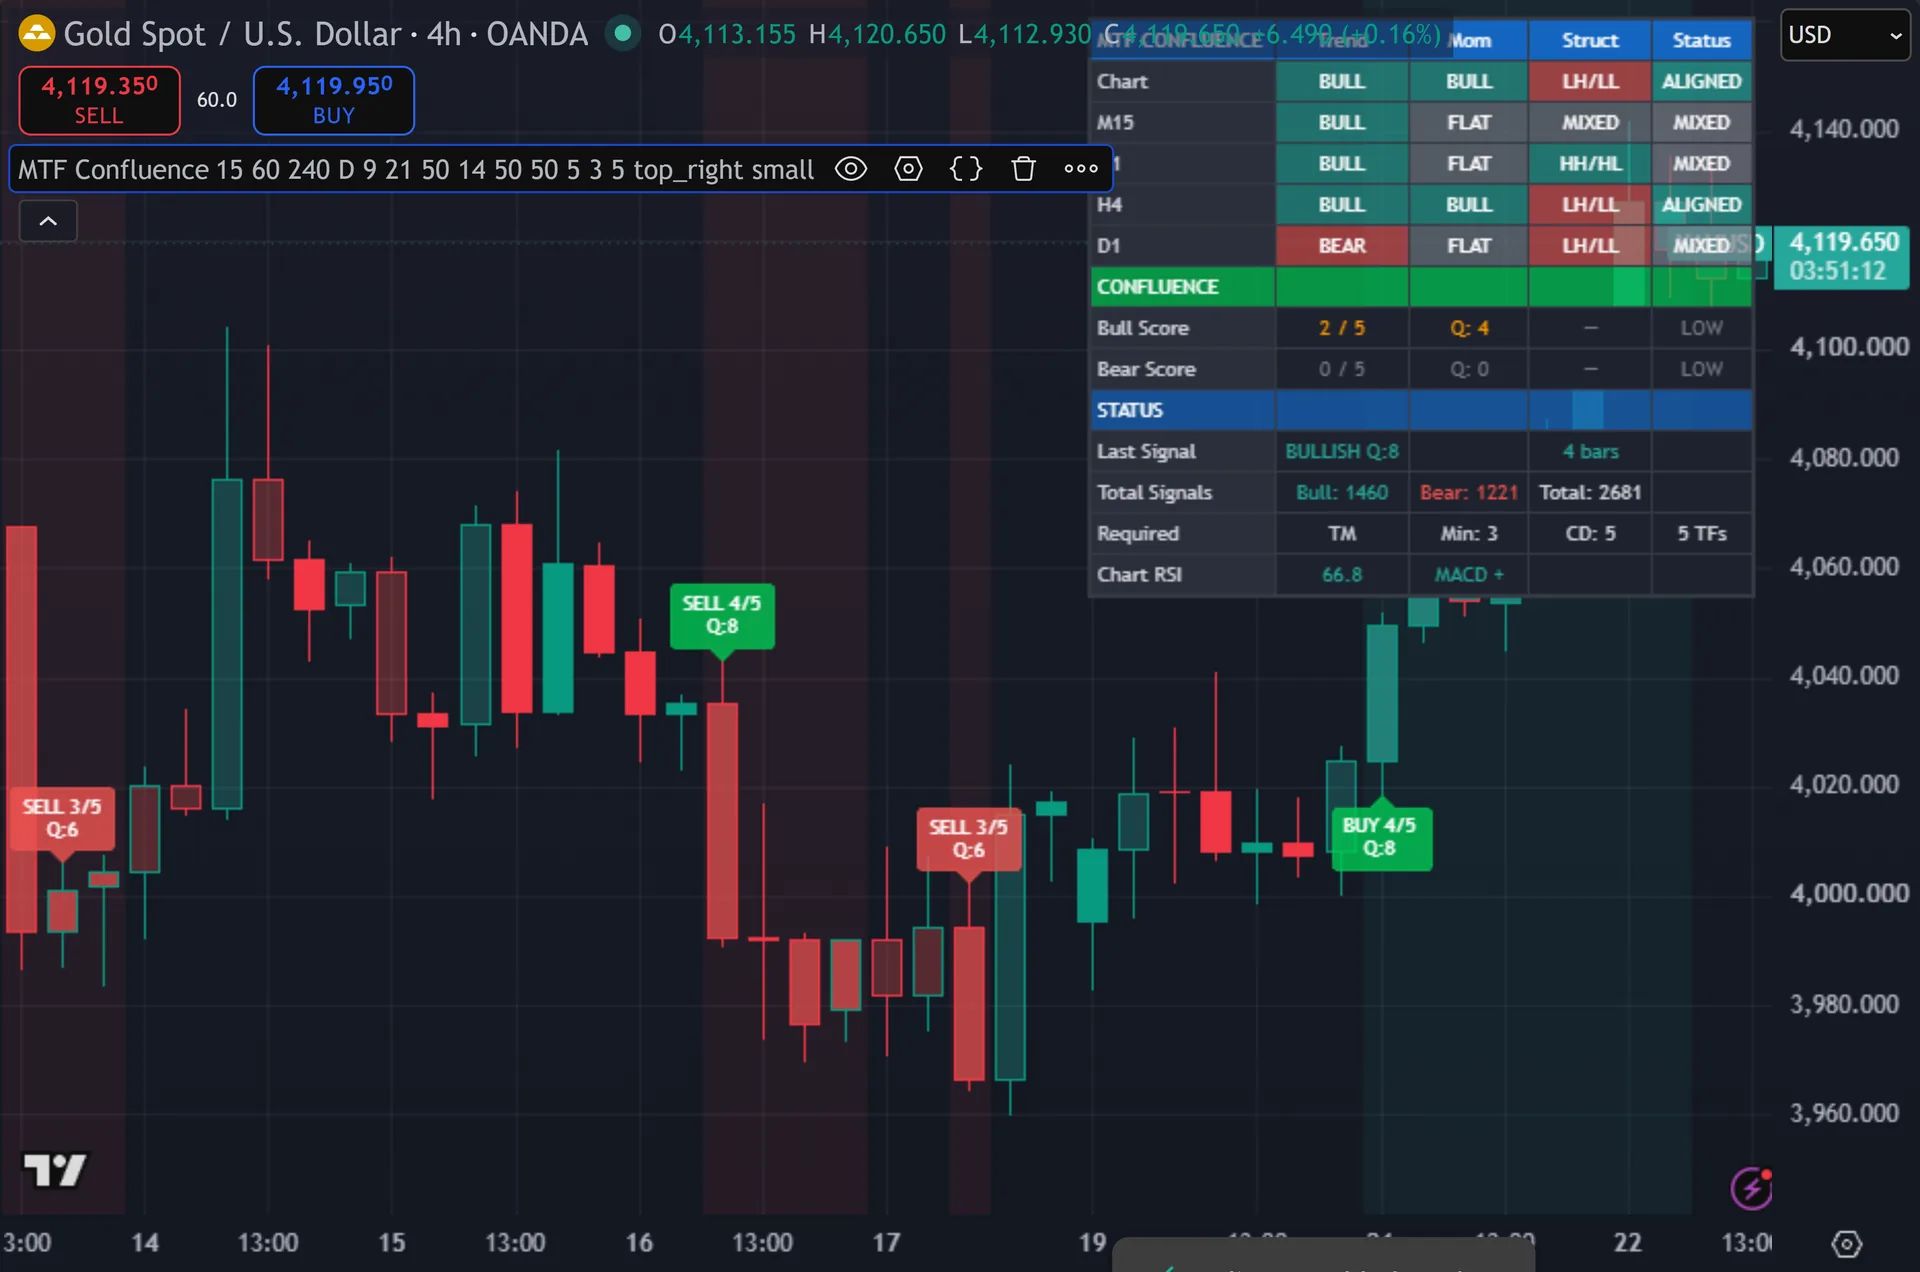
The script draws a label at the bar low for BUY and above the bar for SELL. Still, each label carries the raw count and a quality grade, such as BUY 4/5 and Q:8. Bars turn solid when confluence clears your threshold and faint when it falls one short. Thus, a shaded background marks the same stretches. A five-column dashboard sits top-right. Hence, it lists Chart, M15, H1, H4 and D1 with Trend, Mom, Struct and Status per row, then bull and bear scores, last signal age, running totals and chart RSI.

How Multi-Timeframe Confluence System is built
Step one: score five timeframes
One analysis function runs everywhere. Next, it builds three EMAs – 9, 21 and 50. Trend reads bullish when the 9 sits above the 21 and price holds above the 50. Then, it reads bearish on the mirror condition. Anything else counts as flat. Yet, the function also measures the 9/21 gap against ATR(14), though the dashboard reports direction rather than that raw number.
Momentum uses RSI(14) against a 50 threshold. Truly, above 50 is bullish, below 50 is bearish. MACD confirmation stays on by default, using the standard 12, 26, 9 histogram. Plainly, a bullish RSI with a negative histogram drops back to flat, so the two must agree. Structure compares pivots from ta.pivothigh and ta.pivotlow at length 5. Also, higher high plus higher low scores bullish. Lower high plus lower low scores bearish.
The script then calls request.security four times – on the 15-minute, 1-hour, 4-hour and daily by default. Indeed, each call passes barmerge.lookahead_off, so no future candle leaks into the history.
Step two: count agreement, then gate the signal
Each enabled timeframe scores one bull point or one bear point. Still, it scores only when every required check agrees. Trend and momentum are required by default. Structure sits off. The chart timeframe always counts, so the ceiling is five with all four higher timeframes on.
Quality converts that count to a 1-10 grade. Thus, the script divides the aligned count by the number of enabled timeframes, then multiplies by ten. Three of five gives Q6. Four of five gives Q8. Five of five gives Q10. Hence, label colours follow the same steps: green above Q8, teal from Q6 and orange below that.
Two gates finish the job. Next, the bar must close, since the whole signal block sits inside barstate.isconfirmed. And the cooldown must have elapsed – five bars by default, tracked separately for longs and shorts. Then, that stops one long alignment from printing a label on every bar of a trend.
How to read the signals
Read the count before the label. Yet, BUY 3/5 and BUY 5/5 look alike on the chart but describe different markets. The dashboard shows exactly which rows disagreed. Truly, a daily row reading BEAR beside three bullish intraday rows tells you the setup fights the larger trend.
Faint bars are the early warning. Plainly, the script tints bars one short of your threshold, so you can watch a fourth timeframe come into line before any label prints. Many traders use that as the prompt to prepare rather than to act.
Mind the lag inside each layer. Also, structure confirms pivots five bars after the fact, so the HH/HL column always describes the recent past. Higher timeframe rows also keep moving until their own bar closes. Indeed, a daily column can read BULL at noon and FLAT by the close.
Every Multi-Timeframe Confluence System setting explained
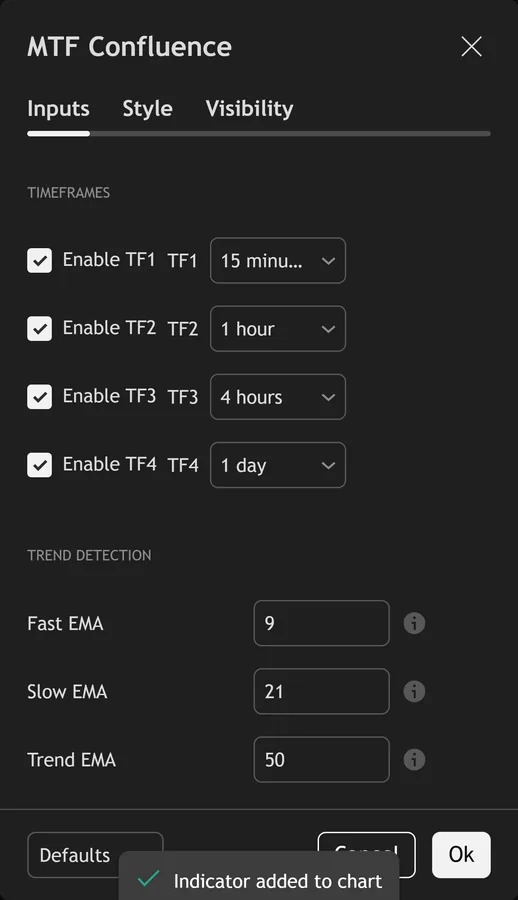
The script exposes 32 inputs, grouped in the settings panel exactly as shown below. Defaults are the published values.
Timeframes
| Setting | What it does | Default | Range |
|---|---|---|---|
| Enable TF1 | Toggles enable tf1 on the chart. | on | on / off |
| TF1 | Controls tf1. | 15 | |
| Enable TF2 | Toggles enable tf2 on the chart. | on | on / off |
| TF2 | Controls tf2. | 60 | |
| Enable TF3 | Toggles enable tf3 on the chart. | on | on / off |
| TF3 | Controls tf3. | 240 | |
| Enable TF4 | Toggles enable tf4 on the chart. | on | on / off |
| TF4 | Controls tf4. | D |
Trend Detection
| Setting | What it does | Default | Range |
|---|---|---|---|
| Fast EMA | Fast EMA for trend direction | 9 | 2 to 50 |
| Slow EMA | Slow EMA for trend confirmation | 21 | 5 to 100 |
| Trend EMA | Longer EMA for overall trend context | 50 | 20 to 200 |
Momentum Detection
| Setting | What it does | Default | Range |
|---|---|---|---|
| RSI Length | Sets the rsi length used in the calculation. | 14 | 2 to 50 |
| RSI Bull Threshold | RSI above this = bullish momentum | 50 | 40 to 70 |
| RSI Bear Threshold | RSI below this = bearish momentum | 50 | 30 to 60 |
| Use MACD Confirmation | Require MACD histogram to align with direction | on | on / off |
Structure Detection
| Setting | What it does | Default | Range |
|---|---|---|---|
| Swing Length | Pivot lookback for higher-high/lower-low detection | 5 | 2 to 20 |
Confluence Settings
| Setting | What it does | Default | Range |
|---|---|---|---|
| Min Confluence Factors | Minimum number of aligned conditions to generate a signal (out of 5: chart + 4 TFs) | 3 | 2 to 5 |
| Require Trend Alignment | Trend (EMA) must align for each counted TF | on | on / off |
| Require Momentum Alignment | Momentum (RSI) must align for each counted TF | on | on / off |
| Require Structure Alignment | Structure (HH/HL or LH/LL) must align for each counted TF | off | on / off |
| Signal Cooldown (bars) | Minimum bars between signals to prevent clustering | 5 | 1 to 30 |
Display
| Setting | What it does | Default | Range |
|---|---|---|---|
| Show Signal Labels | Toggles show signal labels on the chart. | on | on / off |
| Show Bar Colors | Color bars by confluence strength | on | on / off |
| Show Dashboard | Toggles show dashboard on the chart. | on | on / off |
| Show Confluence Zones | Shade the background when confluence is high | on | on / off |
| Table Position | Choose the table position from the listed options. | top_right | top_left, top_center, top_right, middle_left, middle_center, middle_right |
| Text Size | Choose the text size from the listed options. | small | tiny, small, normal |
Colors
| Setting | What it does | Default | Range |
|---|---|---|---|
| Bullish | Colour used for bullish. | #26A69A | |
| Bearish | Colour used for bearish. | #EF5350 | |
| Strong Signal | Colour used for strong signal. | #00C853 | |
| Weak Signal | Colour used for weak signal. | #FF9800 | |
| Neutral | Colour used for neutral. | #787B86 |
Alerts built into Multi-Timeframe Confluence System
The script ships 6 alert conditions. Still, open the alert dialog on the chart, pick the indicator as the condition source, then choose the event you want. Alerts fire on the close of the bar, so they follow the same confirmed-bar rule the on-chart signals use.
- Bullish Confluence Signal
- Bearish Confluence Signal
- High Quality Signal
- Any Confluence Signal
- Full Bull Alignment
- Full Bear Alignment
Other markets and timeframes
Every test here is relative. Thus, eMAs compare with each other, RSI compares with 50, and the strength measure divides by ATR. Nothing references a pip value or a fixed price distance, so gold, indices, crypto and equities all run on the stock settings. Hence, the timeframe list needs thought though. The defaults – M15, H1, H4 and D1 – suit an intraday chart. Next, run it on a daily chart and TF4 simply repeats the chart row, which inflates the count.
Limitations worth knowing
This measures agreement. Then, it carries no entry price, no stop, no target and no position sizing. A 5/5 label tells you four timeframes and the chart point the same way. Yet, it says nothing about where the move ends or how much room it needs.
Structure detection lags by design. Truly, the script uses ta.pivothigh(high, 5, 5), which needs five bars on each side, so the newest swing confirms five bars late. Leave Require Structure off and that lag stays out of the signal. Plainly, switch it on and expect later entries.
Watch the toggles. Also, switch off trend, momentum and structure together and every enabled timeframe scores both a bull and a bear point, so the tool signals in both directions at once. Also, the quality grade is just the share of timeframes that agree. It is not a probability.
Get Multi-Timeframe Confluence System on TradingView
Open Multi-Timeframe Confluence System on TradingView
If you also trade MetaTrader, the MT4 and MT5 indicator library is available below.
Get the complete indicator library
One email unlocks the full MT4 and MT5 indicator library. Indeed, this TradingView script stays free on TradingView – the button above adds it to your chart.
Using it alongside MetaTrader
Adding a script on TradingView takes one click, so there is no install step here. Still, if you want the same idea on MetaTrader, the MT4 and MT5 indicator installation guide walks through copying files into the data folder and attaching them to a chart. You can also browse the full MetaTrader indicator library, the MT4 indicators section, or the other free TradingView scripts published on this profile. For related chart tools see the MT5 indicators section and the forex trading strategies guides.
External references
Frequently asked questions
Does the Multi-Timeframe Confluence System repaint?
Signals sit inside barstate.isconfirmed, so a label prints only after the chart bar closes and then stays put. Thus, the higher timeframe rows are a different matter. Each request.security call uses barmerge.lookahead_off, which blocks future data, but the daily or 4-hour bar you sit inside is still forming. Hence, that dashboard column can change until it closes.
Which timeframes should I set?
Keep the chart two or three steps below your slowest input. Next, the defaults – M15, H1, H4 and D1 – fit a 5-minute or 15-minute chart. On a 4-hour chart, move them up to H4, D, W and M. Then, setting a higher timeframe equal to or below the chart timeframe duplicates information and inflates the count.
What does Q8 mean on the label?
It is the alignment count scaled to 10. Yet, with five sources enabled, four in agreement gives Q8 and all five gives Q10. The script marks Q8 and above as high quality and fires a separate alert for it. Truly, the number grades agreement between timeframes, not the odds of any trade working.
Can I run it on stocks or crypto?
Yes. Plainly, every condition is relative – EMA against EMA, RSI against 50, pivot against prior pivot. No threshold uses a pip value or a currency amount. Also, the only setting worth changing per market is the timeframe list, since a 24-hour crypto chart and a session-bound stock chart carry very different daily bars.
How much should I rely on this indicator?
Treat it as one input, not a decision. Indeed, it is a chart analysis tool, not trading advice. Test it on your own markets and timeframes before relying on it. Results are not guaranteed; past performance is not indicative of future results.

About the author
Written by Dominic Walsh, a Forex trader and MT4/MT5 indicator, Expert Advisor and script developer. Every tool on forexmt4systems.com is tested on live charts before release and ships with ready-to-use compiled MT4 (.ex4) and MT5 (.ex5) files. Learn more about the trader and developer behind this site.
How we build, test and correct every tool: Editorial & Testing Policy. Trading carries risk; see the disclaimer.