
News moves currencies, yet most calendars live in a browser tab. Also, news Impact Analyzer is a forex news indicator TradingView traders can run on the chart itself. It flags every bar whose range clears twice ATR, grades that shock from LOW to EXTREME, and stamps NFP, FOMC and ECB slots straight from the clock. Indeed, it then builds a pip profile of past events and suggests a smaller size around them.
It is free and open source. Still, you can add it to any chart from the News Impact Analyzer script page on TradingView, and the full Pine source is published there for you to read.
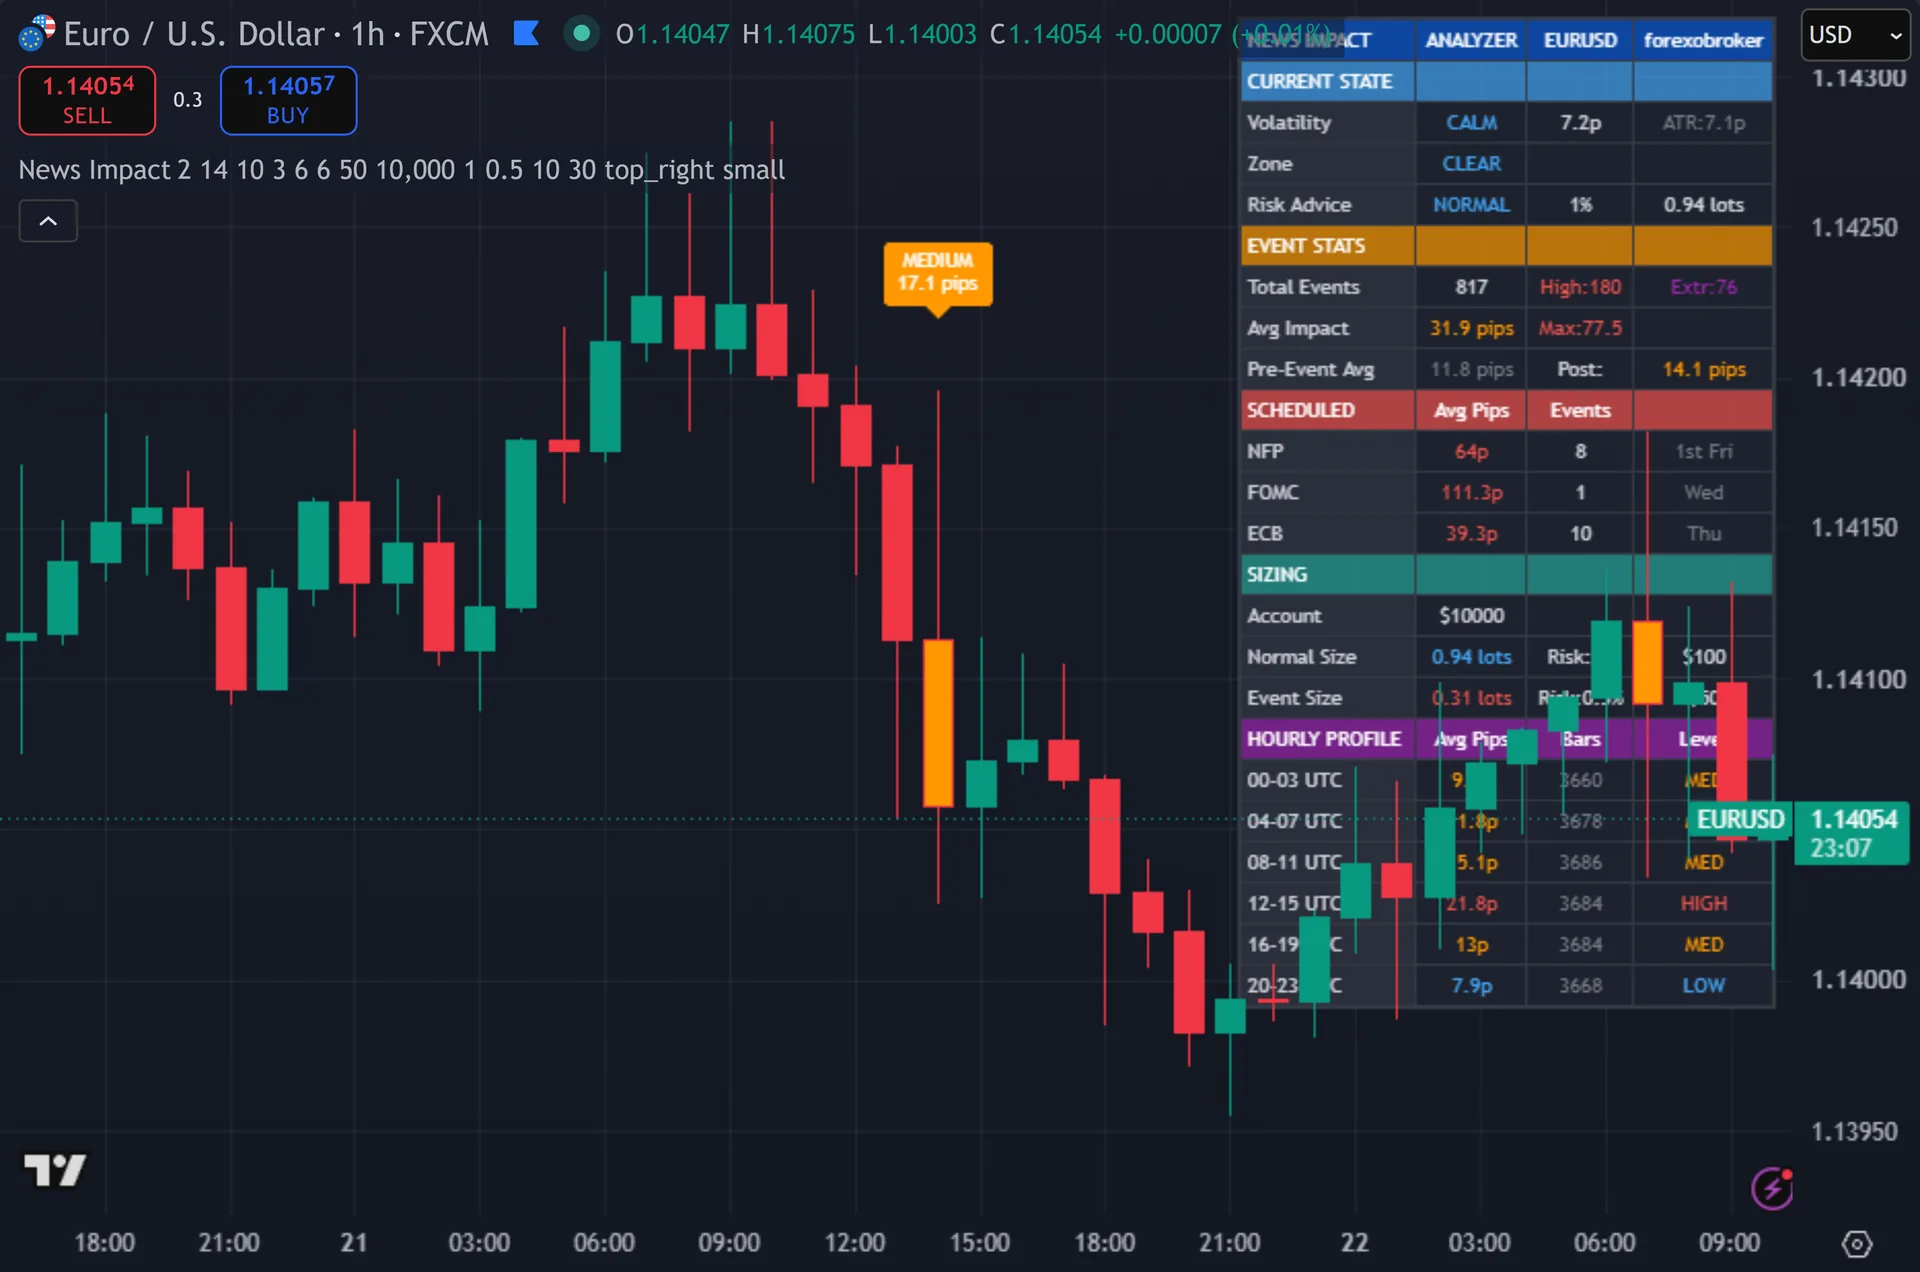
What News Impact Analyzer plots on the price chart
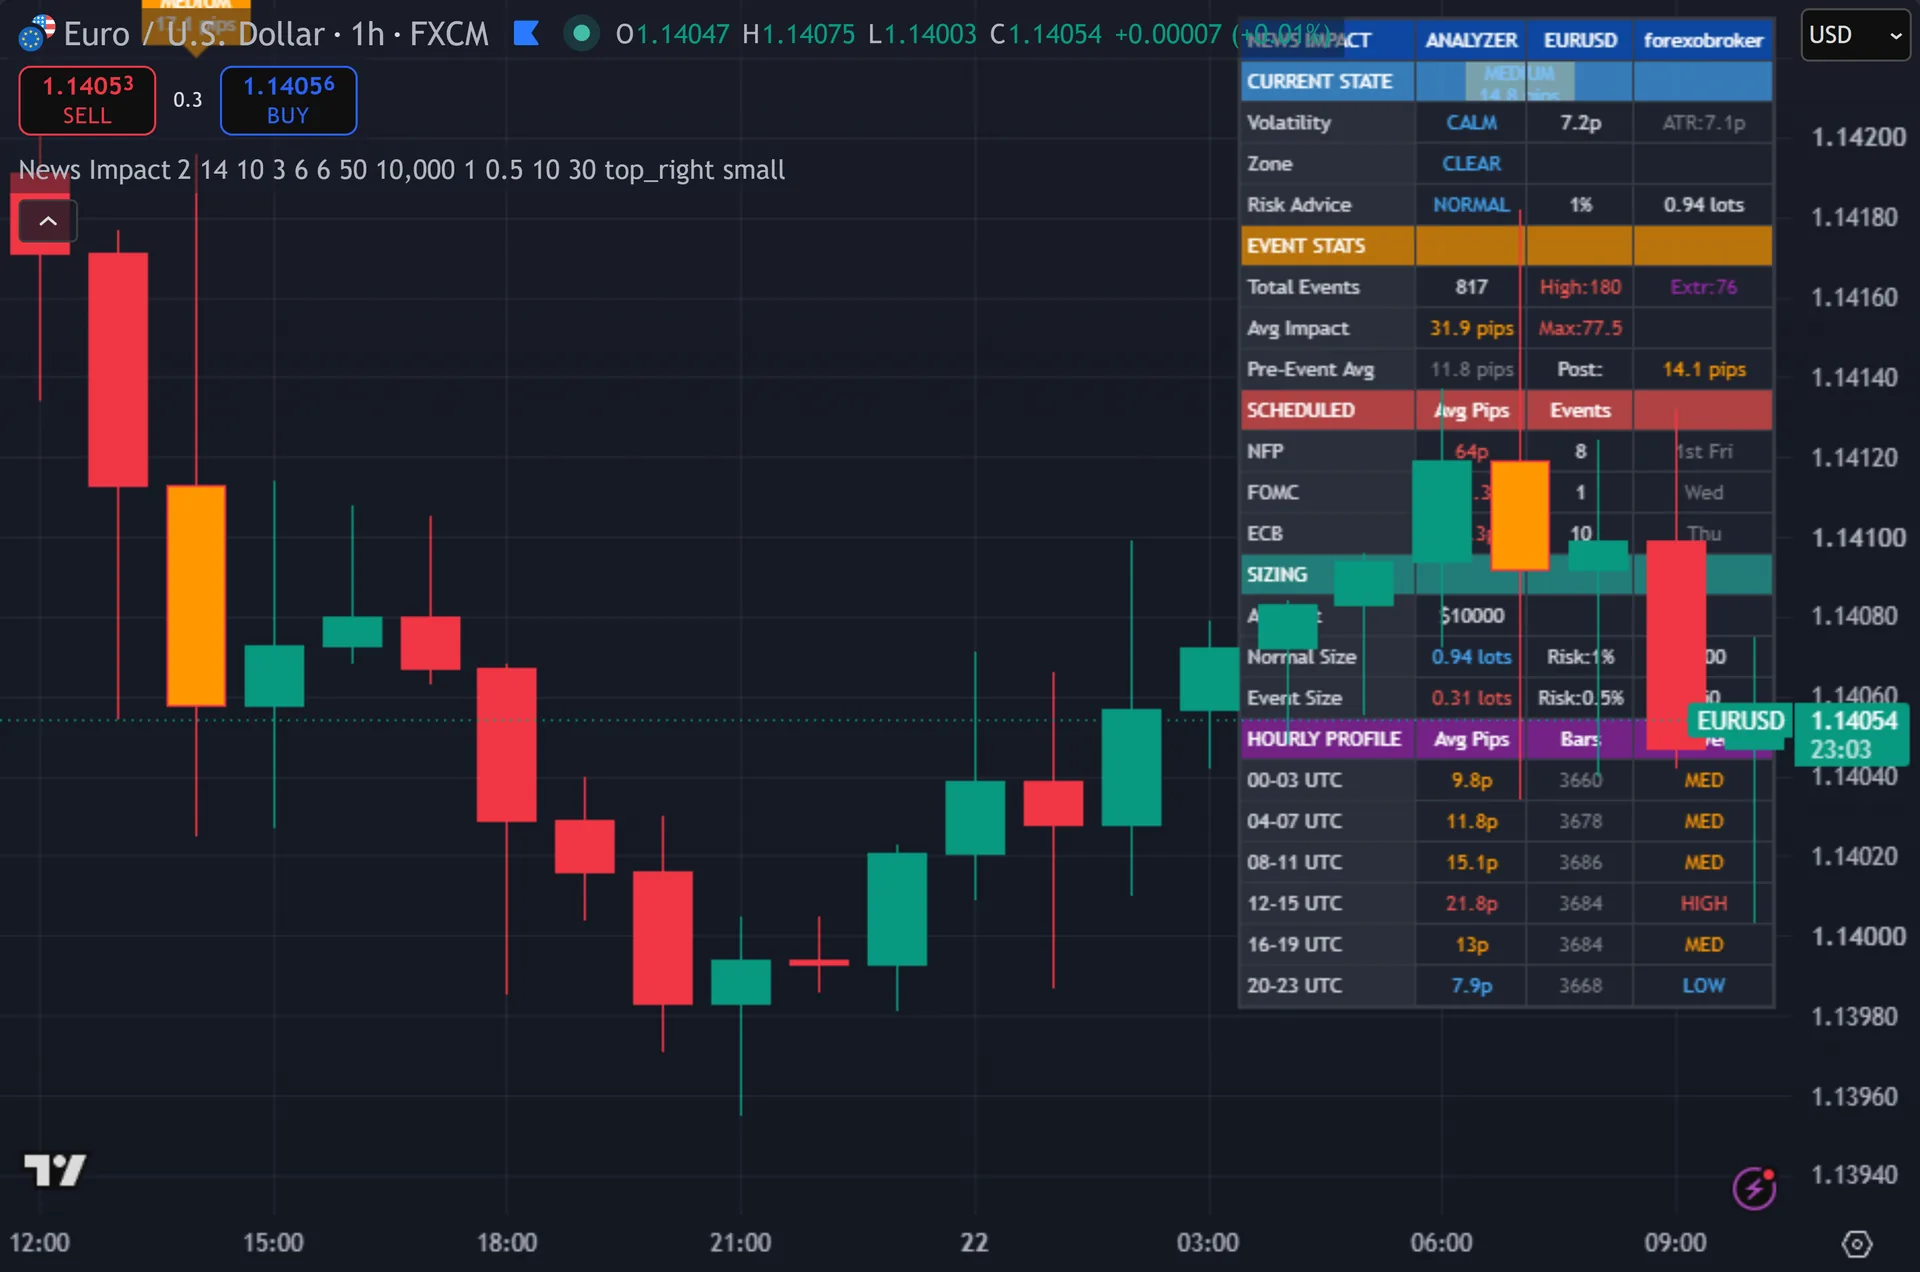
The script colors event bars and attaches a label holding the impact grade and the bar range in pips. Thus, scheduled slots get a tag even on quiet bars. A yellow wash covers the pre-event window and a red wash covers the six bars after. Hence, around scheduled events it draws a dashed box sized to half the average event range. The dashboard runs four columns: current volatility state, risk advice, event counts, average pips for NFP, FOMC and ECB, suggested lot sizes, and a six-block hourly volatility profile in UTC.
How News Impact Analyzer is built
Step one: detect the shock
The script measures each bar’s range and converts it to pips. Next, pip size comes from the symbol’s mintick, times 100 on JPY pairs and times 10 elsewhere. Two tests must pass together. Then, range must exceed ATR 14 times the Spike Threshold, which starts at 2.0, and that range must also reach at least 10 pips.
A merge window stops one event counting twice. Yet, spikes within 3 bars of the last one fold into it, so a violent five-bar release registers as a single event. Every spike must close first as well, which keeps historical marks honest.
Grading uses the raw ratio of range to ATR. Truly, four times ATR or more reads EXTREME. Three reads HIGH, two reads MEDIUM, and anything under that reads LOW. Plainly, the four colors follow the same tiers.
Step two: calendar, stats and sizing
Scheduled events come from the clock, never from a feed. Also, NFP fires on any Friday inside the first seven days of a month at 13:00 UTC. FOMC fires on Wednesdays between the 14th and 21st at 19:00 UTC, in the eight months the committee usually meets. Indeed, ECB fires on Thursdays from the 14th to the 28th at 13:00 UTC, in its own eight months. Earlier bars that same day form the pre-event window.
The script keeps rolling arrays. Still, it stores the last 50 event ranges for the overall average and maximum, plus 50 each for NFP, FOMC and ECB. It also sums pip range per UTC hour across all 24 hours, then reports six four-hour blocks and grades each one HIGH, MED or LOW against the busiest block.
Sizing uses your own numbers. Thus, account size starts at 10,000, normal risk at 1.0 percent and event risk at 0.5 percent. Outside an event window the stop distance is ATR times 1.5 in pips. Hence, inside one it takes the larger of that figure and half the average event range. The script then divides risk dollars by stop pips times your pip value to reach a lot size.
How to read the signals
Start with the Zone row. Next, CLEAR means no scheduled slot sits near. PRE-EVENT means a calendar bar lands later in the same session, and the risk advice switches to AVOID NEW. Then, POST-EVENT covers the six bars after a slot and advises reduced size.
The hourly profile is the quiet workhorse. Yet, it shows which four-hour UTC block actually moves your symbol, measured in average pips per bar. Traders often assume the London to New York overlap dominates. Truly, this table tells you whether that holds on your instrument and timeframe.
Compare the NFP, FOMC and ECB rows against the overall average impact. Plainly, if NFP averages 45 pips on your chart while a typical event runs 22, you now have a number to size against rather than a feeling.
Every News Impact Analyzer setting explained
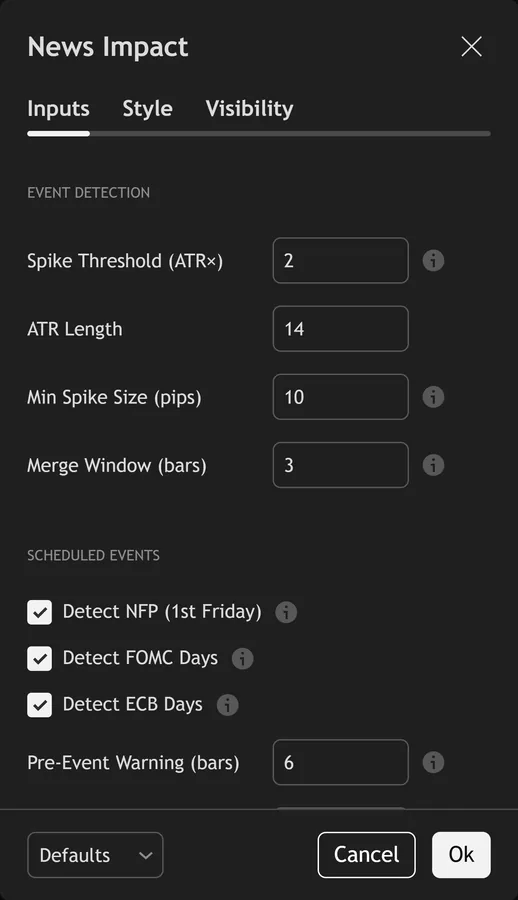
The script exposes 29 inputs, grouped in the settings panel exactly as shown below. Defaults are the published values.
Event Detection
| Setting | What it does | Default | Range |
|---|---|---|---|
| Spike Threshold (ATR×) | Bar range exceeding ATR × this = volatility event | 2.0 | 1.0 to 5.0 |
| ATR Length | Sets the atr length used in the calculation. | 14 | 5 to 50 |
| Min Spike Size (pips) | Minimum bar range in pips to qualify as event | 10.0 | 1 to 200 |
| Merge Window (bars) | Events within this many bars are merged as one | 3 | 1 to 10 |
Scheduled Events
| Setting | What it does | Default | Range |
|---|---|---|---|
| Detect NFP (1st Friday) | Non-Farm Payrolls — first Friday of each month | on | on / off |
| Detect FOMC Days | FOMC meetings — typically 8 per year on Wednesdays | on | on / off |
| Detect ECB Days | ECB rate decisions — typically Thursdays | on | on / off |
| Pre-Event Warning (bars) | Bars before scheduled event to highlight | 6 | 1 to 24 |
| Post-Event Window (bars) | Sets the post-event window (bars) used in the calculation. | 6 | 1 to 24 |
Impact Analysis
| Setting | What it does | Default | Range |
|---|---|---|---|
| Event Lookback Count | How many past events to average for impact stats | 50 | 10 to 200 |
| Show Expected Impact Range | Draw projected pip range box around scheduled events | on | on / off |
Position Sizing
| Setting | What it does | Default | Range |
|---|---|---|---|
| Account Size ($) | Sets the account size ($) used in the calculation. | 10000 | |
| Normal Risk (%) | Sets the normal risk (%) used in the calculation. | 1.0 | 0.1 to 5.0 |
| Event Risk (%) | Reduced risk during high-volatility events | 0.5 | 0.1 to 5.0 |
| No-Trade Zone Pre-Event | Show warning during pre-event window | on | on / off |
| Pip Value ($/lot) | Sets the pip value ($/lot) used in the calculation. | 10.0 | 0.01 to 100.0 |
Display
| Setting | What it does | Default | Range |
|---|---|---|---|
| Show Dashboard | Toggles show dashboard on the chart. | on | on / off |
| Show Event Labels | Toggles show event labels on the chart. | on | on / off |
| Show Volatility Profile | Hourly volatility table showing avg pips per hour | on | on / off |
| Show Pre/Post Zones | Toggles show pre/post zones on the chart. | on | on / off |
| Max Event Labels | Sets the max event labels used in the calculation. | 30 | 5 to 100 |
| Table Position | Choose the table position from the listed options. | top_right | top_left, top_center, top_right, bottom_left, bottom_center, bottom_right |
| Text Size | Choose the text size from the listed options. | small | tiny, small, normal |
Colors
| Setting | What it does | Default | Range |
|---|---|---|---|
| Low Impact | Colour used for low impact. | #42A5F5 | |
| Medium Impact | Colour used for medium impact. | #FF9800 | |
| High Impact | Colour used for high impact. | #EF5350 | |
| Extreme Impact | Colour used for extreme impact. | #9C27B0 | |
| Pre-Event Zone | Colour used for pre-event zone. | #FFF176 | |
| Neutral | Colour used for neutral. | #787B86 |
Alerts built into News Impact Analyzer
The script ships 7 alert conditions. Also, open the alert dialog on the chart, pick the indicator as the condition source, then choose the event you want. Alerts fire on the close of the bar, so they follow the same confirmed-bar rule the on-chart signals use.
- High Impact Event
- Extreme Impact Event
- Any Volatility Spike
- Scheduled Event
- Pre-Event Warning
- Post-Event Start
- Any Event
Other markets and timeframes
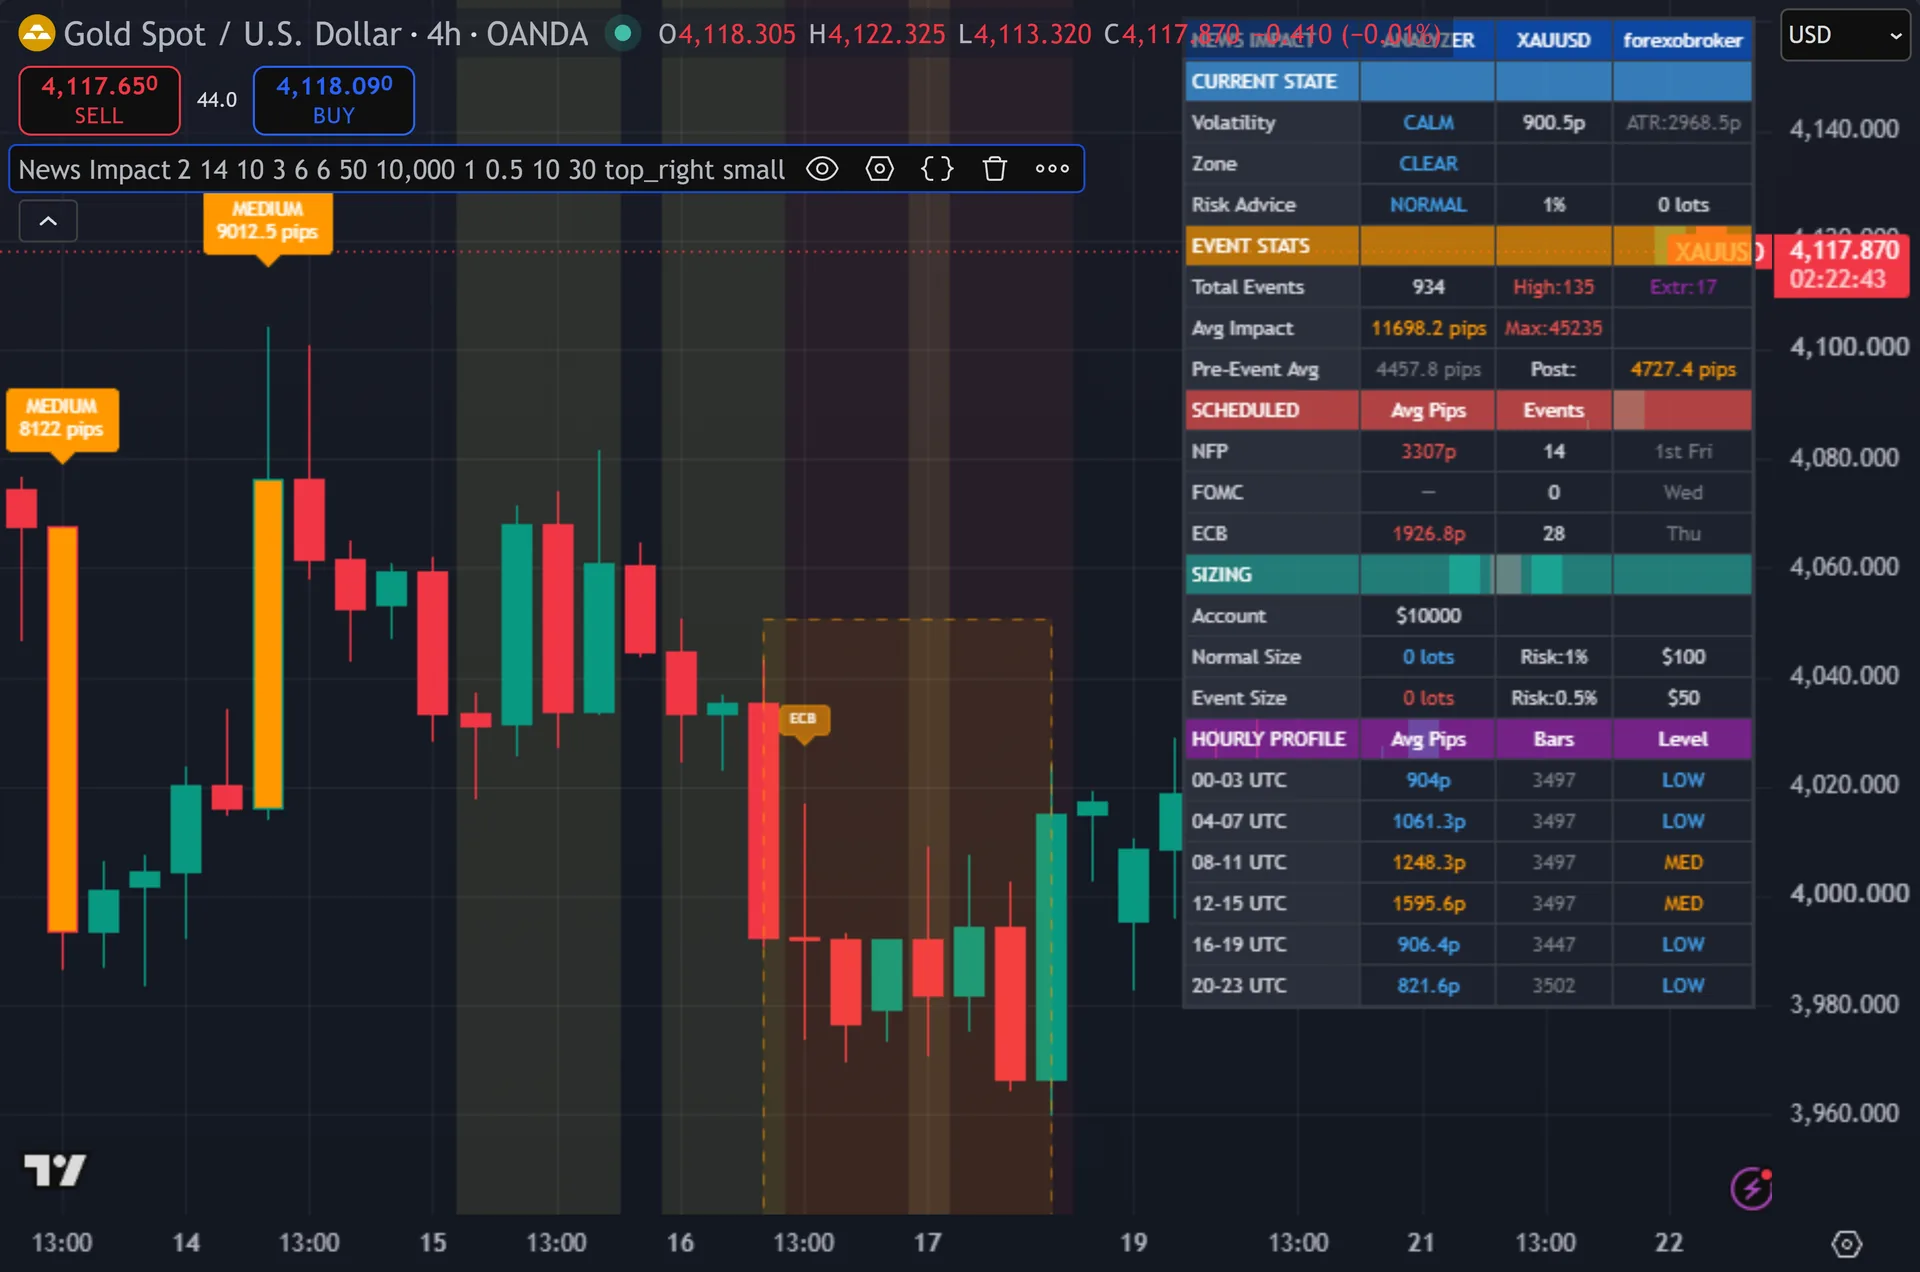
Detection stays fully relative, since the script compares range against ATR. The pip conversion does not. It assumes a forex quote convention, so on indices, crypto or stocks the pip figures turn into an odd unit and Min Spike Size needs a rethink. Indeed, the scheduled slots cover USD and EUR releases, which suits majors and gold more than an Asian index. One upside: nothing here reads volume, so the indicator behaves the same on every feed.
Limitations worth knowing
The calendar is a clock rule, not a news feed. Still, pine cannot fetch economic releases, so the script infers NFP, FOMC and ECB from date and hour patterns. It will tag a Wednesday 19:00 bar in an FOMC month whether or not the committee met. Thus, treat those tags as approximate and check a real calendar.
Spike detection stays blind to cause. Hence, a wide bar during a thin holiday session looks identical to a genuine release. The tool measures volatility, then labels that volatility as an event.
The sizing panel is a calculator, not advice. Next, it divides your stated risk by a stop distance drawn from ATR or from past event ranges. It knows nothing about your broker’s spread during a release, slippage, or whether the trade makes sense at all.
Get News Impact Analyzer on TradingView
Open News Impact Analyzer on TradingView
If you also trade MetaTrader, the MT4 and MT5 indicator library is available below.
Get the complete indicator library
One email unlocks the full MT4 and MT5 indicator library. Then, this TradingView script stays free on TradingView – the button above adds it to your chart.
Using it alongside MetaTrader
Adding a script on TradingView takes one click, so there is no install step here. Yet, if you want the same idea on MetaTrader, the MT4 and MT5 indicator installation guide walks through copying files into the data folder and attaching them to a chart. You can also browse the full MetaTrader indicator library, the MT4 indicators section, or the other free TradingView scripts published on this profile. For related chart tools see the MT5 indicators section and the forex trading strategies guides.
External references
- Volatility (finance) on Wikipedia
- Volatility at Investopedia
- Economic Indicators at StockCharts ChartSchool
Frequently asked questions
Does News Impact Analyzer connect to an economic calendar?
No. Truly, pine Script cannot pull external news data. The script identifies NFP, FOMC and ECB slots from date and time rules – first Friday at 13:00 UTC, mid-month Wednesday at 19:00 UTC, and mid to late month Thursday at 13:00 UTC. Plainly, confirm each one against a real calendar.
Does it repaint?
No. Also, spike detection gates on barstate.isconfirmed, so an event label appears only after that bar closes. The pre-event shading reads the current bar’s own clock, so it does not shift later either.
What counts as an event?
A bar whose range exceeds ATR 14 times 2.0 and also spans at least 10 pips. Indeed, spikes within 3 bars of the previous one merge into a single event, so one release does not inflate the counters.
Which timeframe suits it best?
Intraday charts, since the hourly profile and the scheduled hour rules both need bars smaller than a day. Still, h1 gives a clean read of the calendar slots. On M5 or M15, raise Min Spike Size so ordinary noise stays out of the event list.
How much should I rely on this indicator?
Treat it as one input, not a decision. Thus, it is a chart analysis tool, not trading advice. Test it on your own markets and timeframes before relying on it. Results are not guaranteed; past performance is not indicative of future results.

About the author
Written by Dominic Walsh, a Forex trader and MT4/MT5 indicator, Expert Advisor and script developer. Every tool on forexmt4systems.com is tested on live charts before release and ships with ready-to-use compiled MT4 (.ex4) and MT5 (.ex5) files. Learn more about the trader and developer behind this site.
How we build, test and correct every tool: Editorial & Testing Policy. Trading carries risk; see the disclaimer.