
Most fade tools guess where price should return to. Also, ornstein Uhlenbeck Reverter, a mean reversion indicator TradingView traders can drop on any chart, fits that level instead. It runs a least-squares regression over the last 60 bars to estimate the pull strength theta and the equilibrium mu of an Ornstein-Uhlenbeck process. Indeed, it then fades price only when the gap to mu passes 1.5 residual sigma and starts closing again.
It is free and open source. Still, you can add it to any chart from the Ornstein Uhlenbeck Reverter script page on TradingView, and the full Pine source is published there for you to read.
What Ornstein Uhlenbeck Reverter plots on the price chart
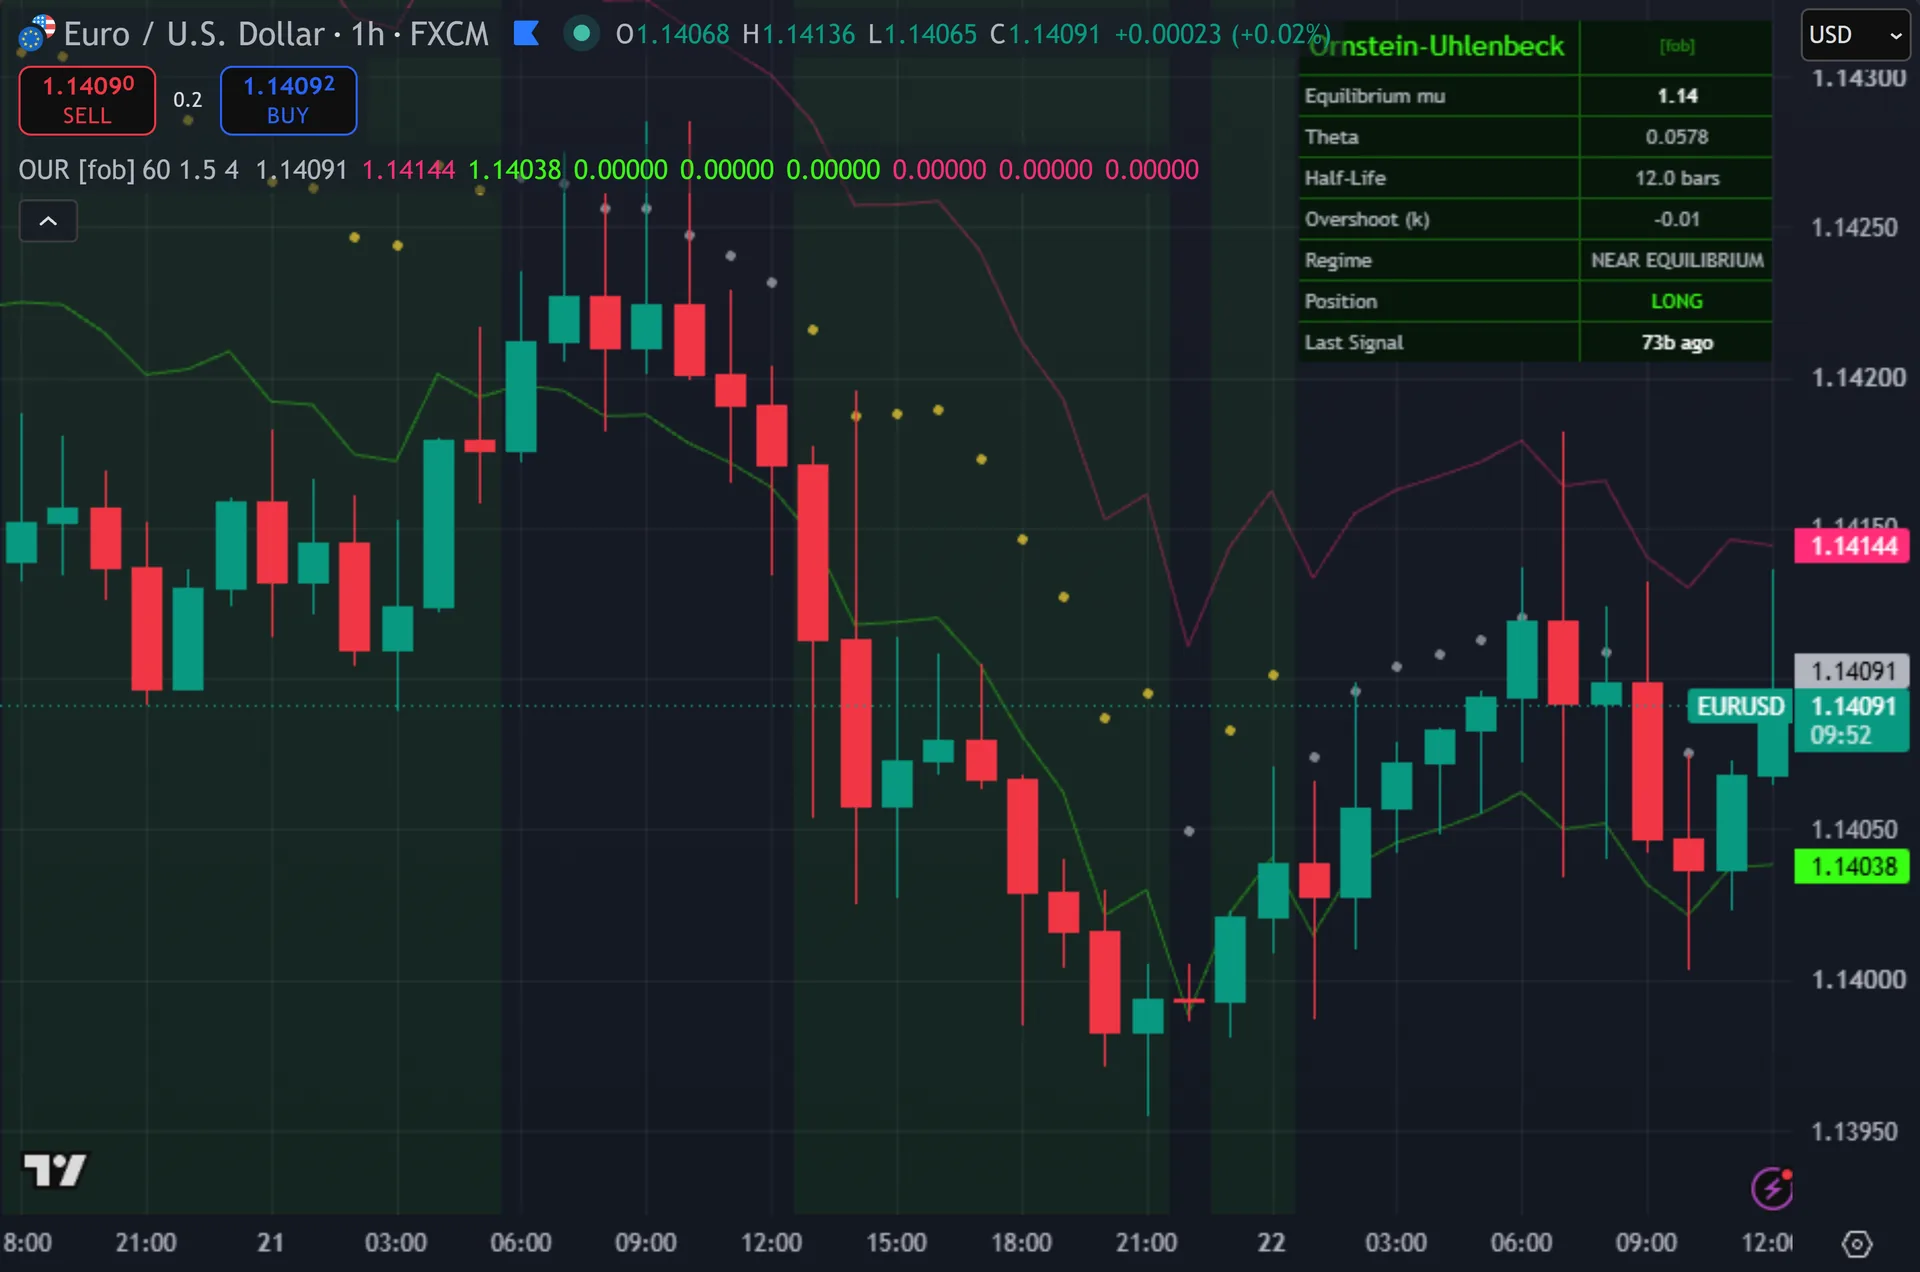
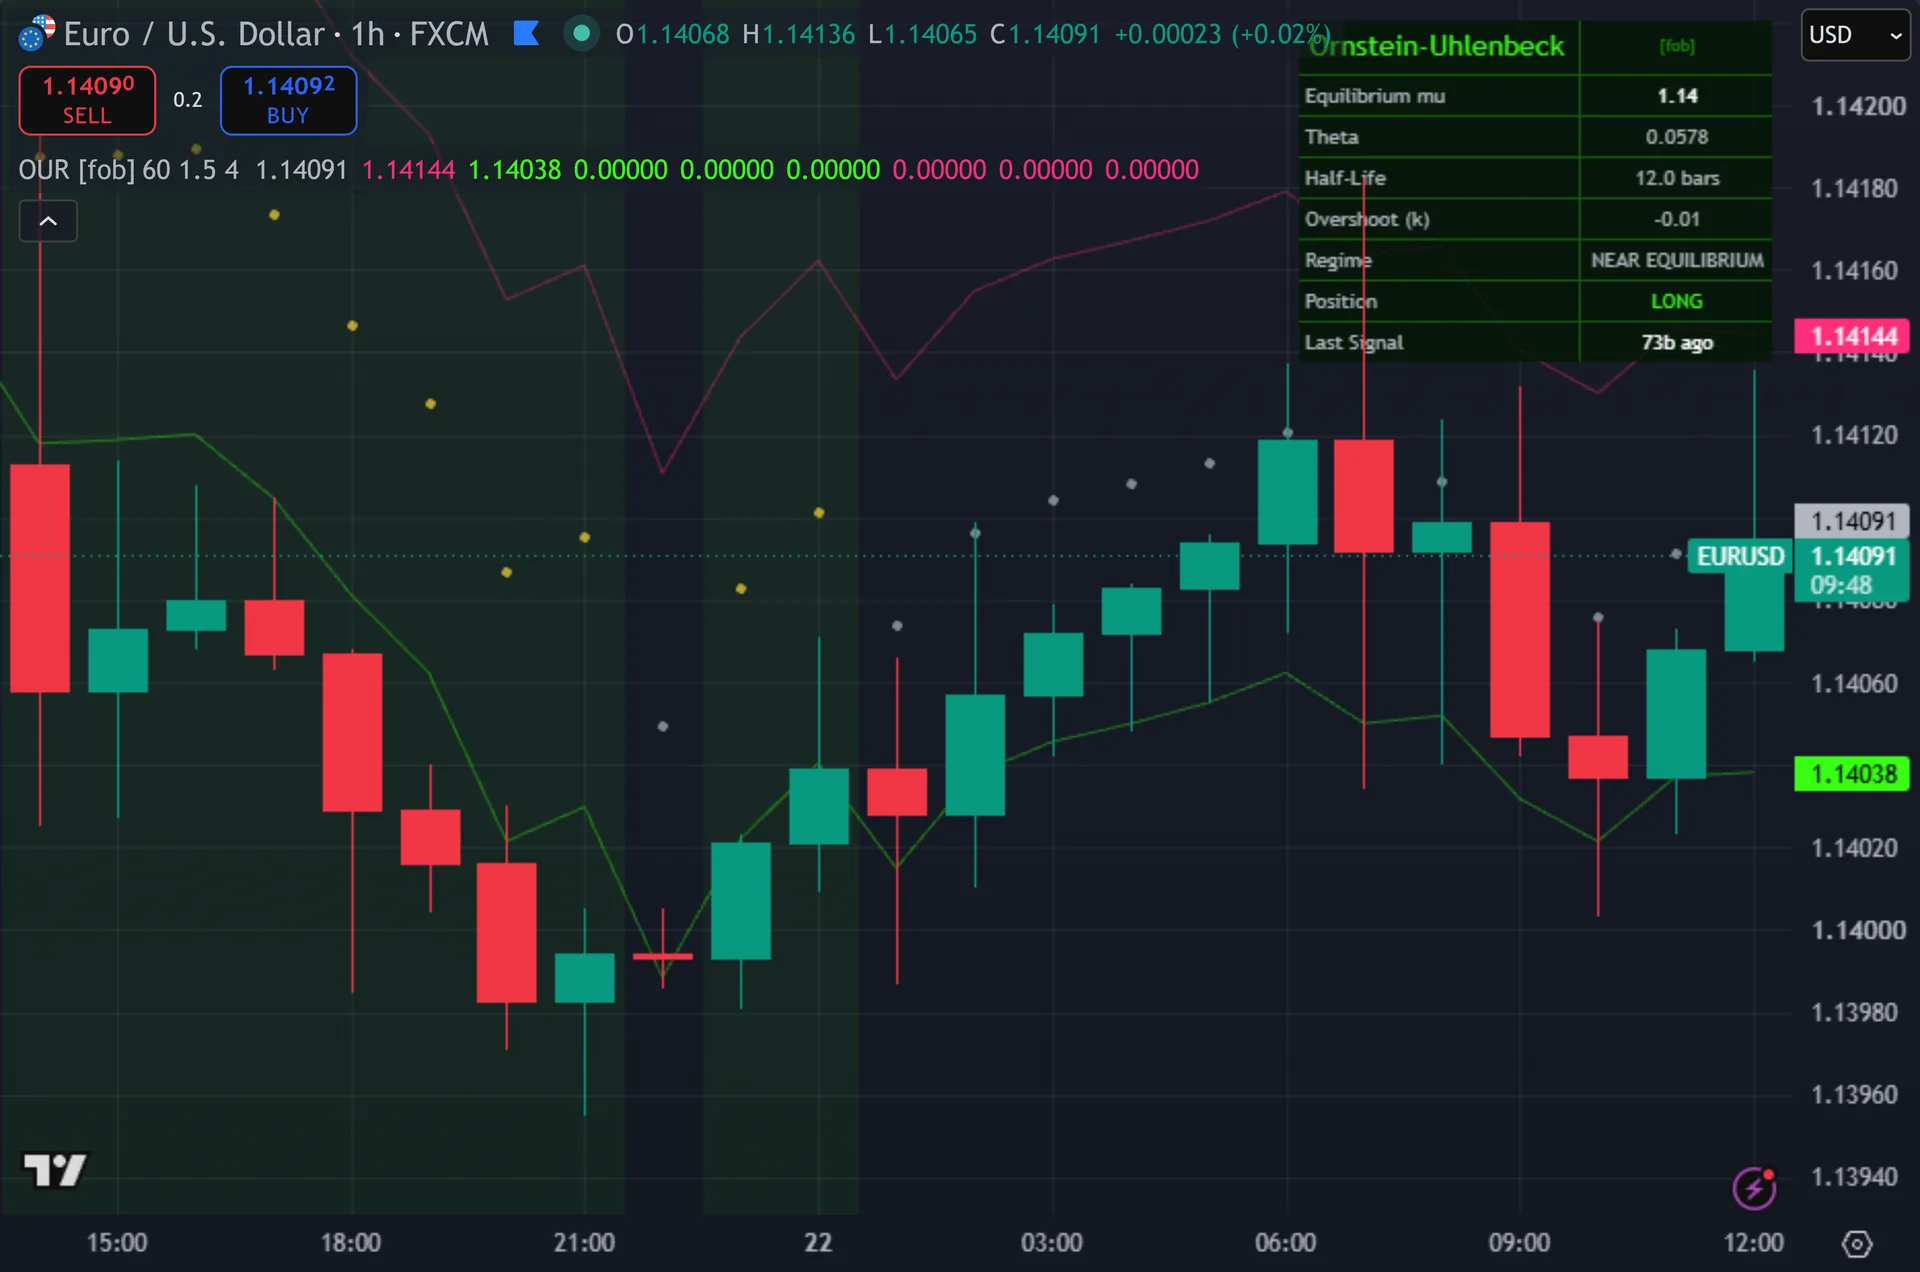
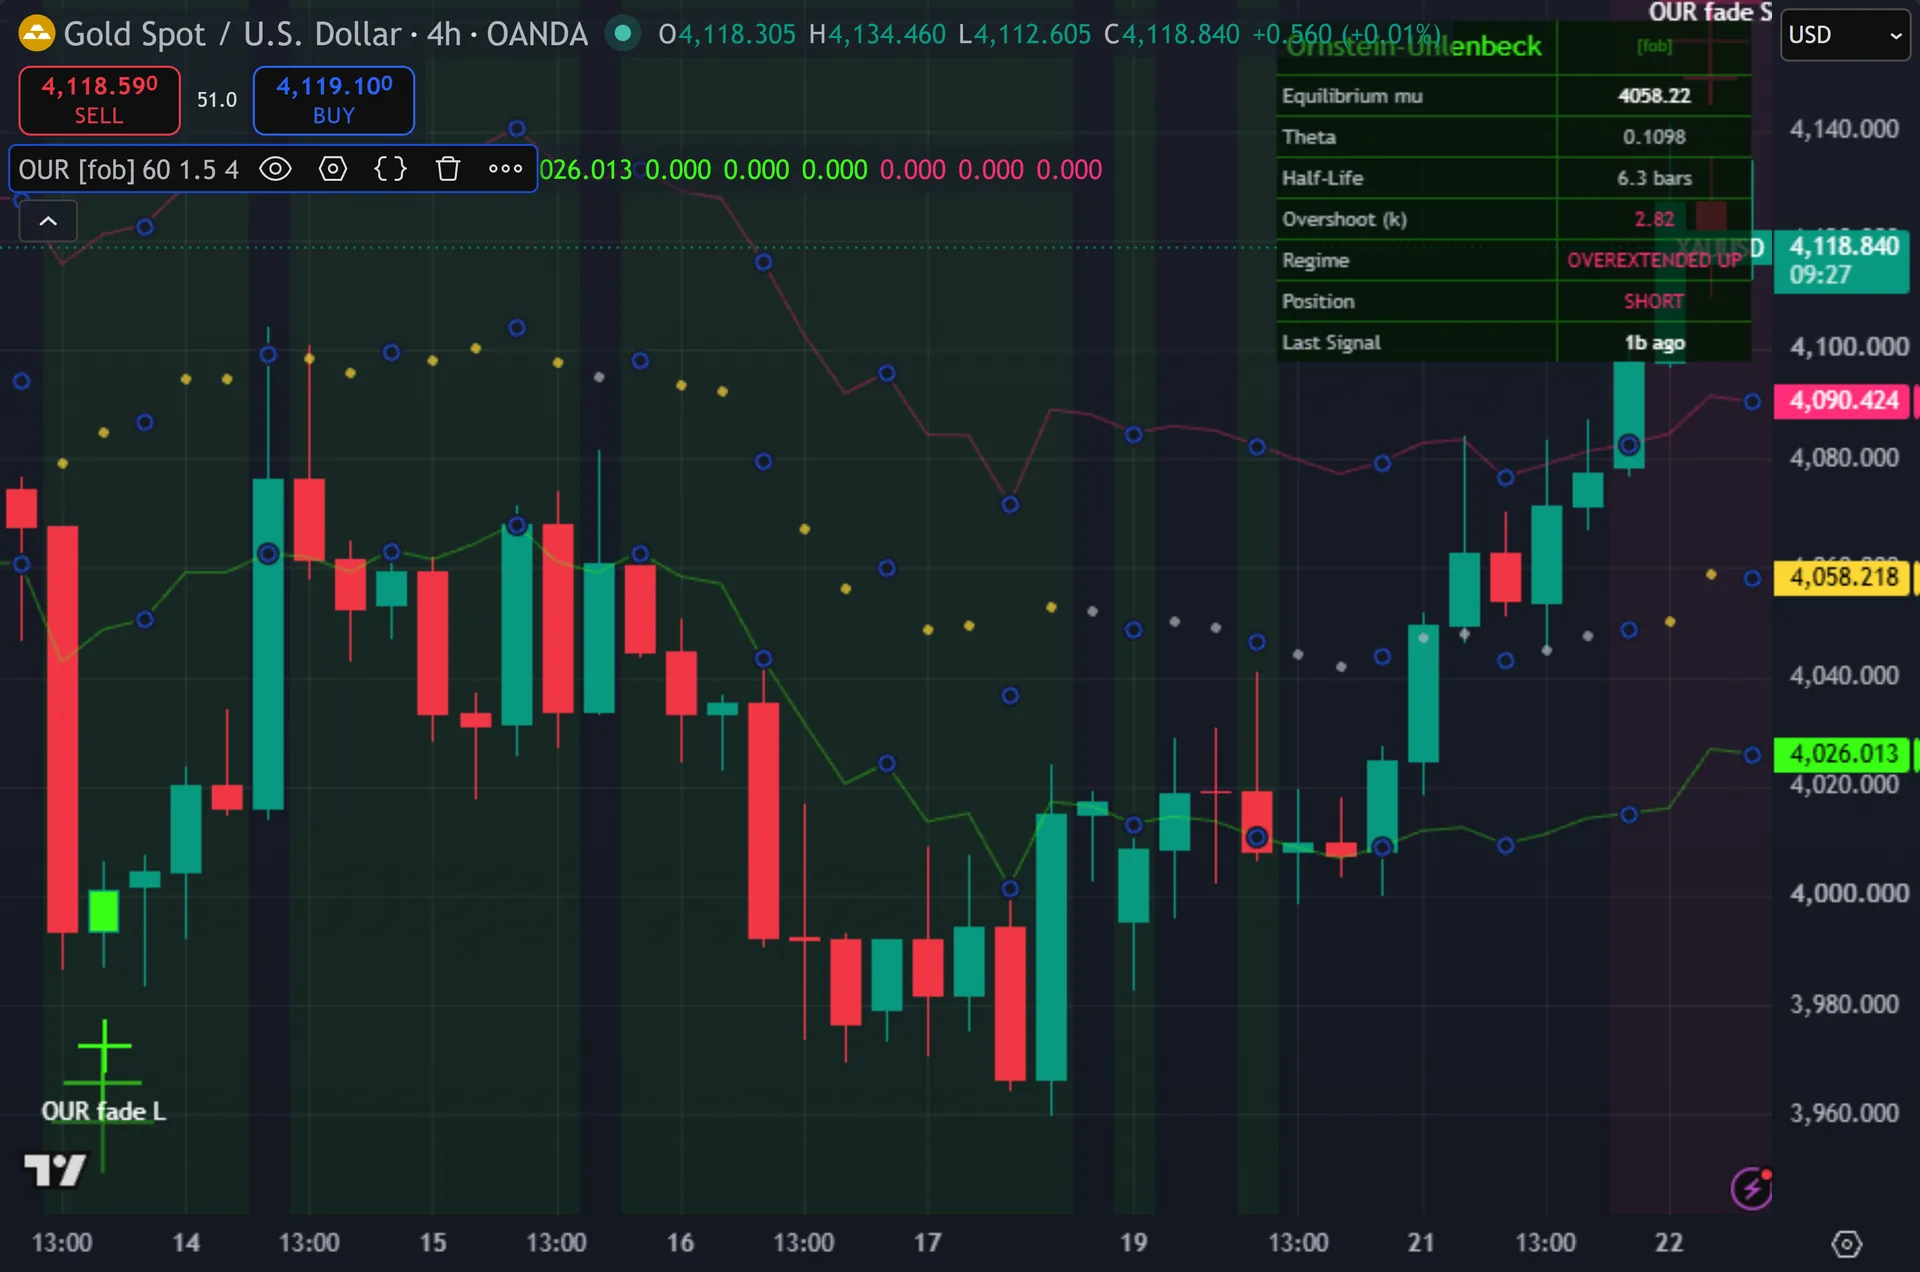
The script plots the fitted equilibrium mu as a circle line. Thus, it turns yellow while price sits beyond the threshold and silver otherwise. Two thin bands sit at mu plus and minus 1.5 sigma. Hence, cross markers with a three-layer glow mark entries, tagged OUR fade L and OUR fade S. The signal bar takes a solid colour, and the chart background tints while price stays overextended. Next, a top-right dashboard lists mu, theta, half-life in bars, the current overshoot, the regime and the position state.
How Ornstein Uhlenbeck Reverter is built
Fitting the OU process
The Ornstein-Uhlenbeck process describes a value that drifts back toward a mean. Then, its equation reads dX = theta * (mu – X) * dt + sigma * dW. Theta sets how hard the pull works. Yet, mu sets the level it pulls toward. Sigma sets the noise around it. Truly, this script estimates all three from price rather than assuming them.
The estimator is plain OLS. For each of the last 60 bars the script pairs a price level with the change that followed it. It then regresses that one-bar change on the level. Plainly, the slope comes out negative in a reverting market, so theta equals minus the slope. Mu equals the intercept divided by theta – the level where the expected change hits zero. Also, half-life follows as ln(2) divided by theta, printed in bars. You can widen the fit window to 200 bars or tighten it to 20.
Turning the fit into entries
Sigma comes from the regression residuals. Indeed, the script squares each residual, averages them over the window and takes the square root. Overshoot then equals the distance from mu divided by that sigma. Still, this single number drives every signal. The default threshold k sits at 1.5.
A long needs two things at once. Thus, overshoot must sit below minus 1.5, so price trades under equilibrium. And overshoot must rise against the previous bar, so the gap is already closing. Hence, the script fades the snap-back, not the fall itself. Shorts mirror this above plus 1.5.
Three gates then apply. Next, the bar must close, since every signal checks barstate.isconfirmed. The position state must flip, so two longs never print in a row. Then, and four bars must pass since the last mark. Raise that cooldown toward 20 if a fast chart clusters the crosses together.
How to read the signals
Read theta and half-life before you read the arrows. Yet, a half-life of 20 bars says the fit found a real pull and gives a fade a plausible time frame. When theta collapses toward zero the dashboard prints half-life as inf. Truly, that market drifts rather than reverts, and the fade logic has little to work with.
Then read overshoot. Plainly, values near 1.5 sit right at the entry edge. Values past 2.5 mark a deep stretch, and a dedicated alert fires there. Also, the background tint carries the same message at a glance, so you can skip the table during fast sessions.
Remember that the bands move. Indeed, every bar refits mu and sigma over a rolling 60-bar window, so the equilibrium line curves and the bands breathe. The script still reads closed bars only. Still, what the historical chart shows matches what you would have seen live.
Every Ornstein Uhlenbeck Reverter setting explained
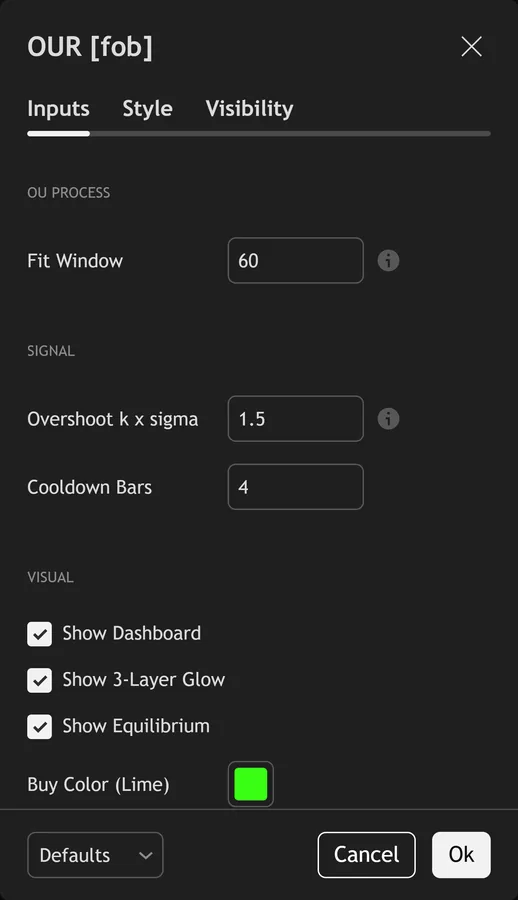
The script exposes 8 inputs, grouped in the settings panel exactly as shown below. Defaults are the published values.
OU Process
| Setting | What it does | Default | Range |
|---|---|---|---|
| Fit Window | Bars used to estimate theta and mu via OLS. | 60 | 20 to 200 |
Signal
| Setting | What it does | Default | Range |
|---|---|---|---|
| Overshoot k x sigma | Fade entry when |close – mu| > k * sigma. | 1.5 | 0.5 to 4.0 |
| Cooldown Bars | Sets the cooldown bars used in the calculation. | 4 | 1 to 20 |
Visual
| Setting | What it does | Default | Range |
|---|---|---|---|
| Show Dashboard | Toggles show dashboard on the chart. | on | on / off |
| Show 3-Layer Glow | Toggles show 3-layer glow on the chart. | on | on / off |
| Show Equilibrium | Toggles show equilibrium on the chart. | on | on / off |
| Buy Color (Lime) | Colour used for buy color (lime). | #39ff14 | |
| Sell Color (Magenta) | Colour used for sell color (magenta). | #ff2d78 |
Alerts built into Ornstein Uhlenbeck Reverter
The script ships 11 alert conditions. Thus, open the alert dialog on the chart, pick the indicator as the condition source, then choose the event you want. Alerts fire on the close of the bar, so they follow the same confirmed-bar rule the on-chart signals use.
- OUR Buy
- OUR Sell
- OUR Any Signal
- OUR Underext
- OUR Overext
- OUR Extreme
- OUR Fast Revert
- OUR Drift Mode
- OUR Webhook JSON
Other markets and timeframes
Nothing here anchors to forex. Hence, the fit reads raw price, and every threshold works in units of the estimated sigma rather than pips or points. So the same defaults transfer to gold, indices, crypto and equities. Next, the script also reads no volume, which removes the usual cross-market snag. One caveat matters. Then, strongly trending instruments push theta toward zero, and the fade logic then produces very few signals. Check the half-life row first on any new market.
Limitations worth knowing
This marks statistical stretch. Yet, it is not a trading system. It sets no stop, no target and no position size, and it holds no view on higher-timeframe structure. Truly, fading a strong trend stays risky no matter how large the overshoot reads.
Sigma here measures one-bar residual noise, not the stationary spread of the process. Plainly, a textbook OU model divides sigma by the square root of two theta to get the stationary band. This script skips that step, so the plotted bands sit tighter than a full OU model would draw them. Also, treat k as a tuning dial rather than a probability.
The fit assumes dt equals one bar and clamps theta at zero. Indeed, when the regression slope turns positive, which happens in a trending window, theta becomes zero, mu falls back to the plain window average and half-life reads as infinite. The bands then collapse onto that average and mean little. Still, the script also calls no request.security, so it offers no multi-timeframe view.
Get Ornstein Uhlenbeck Reverter on TradingView
Open Ornstein Uhlenbeck Reverter on TradingView
If you also trade MetaTrader, the MT4 and MT5 indicator library is available below.
Get the complete indicator library
One email unlocks the full MT4 and MT5 indicator library. Thus, this TradingView script stays free on TradingView – the button above adds it to your chart.
Using it alongside MetaTrader
Adding a script on TradingView takes one click, so there is no install step here. Hence, if you want the same idea on MetaTrader, the MT4 and MT5 indicator installation guide walks through copying files into the data folder and attaching them to a chart. You can also browse the full MetaTrader indicator library, the MT4 indicators section, or the other free TradingView scripts published on this profile. For related chart tools see the MT5 indicators section and the forex trading strategies guides.
External references
- Stochastic oscillator on Wikipedia
- Stochastic Oscillator at Investopedia
- Raff Regression Channel at StockCharts ChartSchool
Frequently asked questions
Does the Ornstein Uhlenbeck Reverter repaint?
No. Next, every signal checks barstate.isconfirmed, and the cross markers use that same gate. Marks appear only after the bar closes. Then, the equilibrium line and the bands do shift from bar to bar, since the script refits them on a rolling 60-bar window, but they never redraw past signals.
What do theta and half-life mean?
Theta measures the strength of the pull back toward equilibrium. Yet, half-life converts theta into bars using ln(2) divided by theta. A half-life of 10 bars says the fit expects roughly half of any gap to close within ten bars. Truly, the dashboard prints both figures on every bar.
Why did an obvious stretch produce no arrow?
Check the three gates. Plainly, overshoot may not have turned back yet, because a long needs a rising overshoot. The position state may already sit long. Also, or the four-bar cooldown may still be running. The dashboard shows overshoot, position and bars since the last signal, so you can see which gate stopped it.
Which settings should I change first?
The fit window and k. Indeed, a shorter window tracks recent behaviour and produces a livelier mu. A larger k demands a deeper stretch and cuts the signal count sharply. Still, test both on your own instrument and timeframe before you rely on them.
How much should I rely on this indicator?
Treat it as one input, not a decision. Thus, it is a chart analysis tool, not trading advice. Test it on your own markets and timeframes before relying on it. Results are not guaranteed; past performance is not indicative of future results.

About the author
Written by Dominic Walsh, a Forex trader and MT4/MT5 indicator, Expert Advisor and script developer. Every tool on forexmt4systems.com is tested on live charts before release and ships with ready-to-use compiled MT4 (.ex4) and MT5 (.ex5) files. Learn more about the trader and developer behind this site.
How we build, test and correct every tool: Editorial & Testing Policy. Trading carries risk; see the disclaimer.