
Sequential Monte Carlo sounds heavy for a chart. Also, particle Filter Pulse, a particle filter indicator TradingView traders can run on any symbol, keeps it readable. It carries 32 particles, each holding a price guess and a velocity guess. Indeed, every close reweights them by Gaussian likelihood. When the effective sample size falls under half the ensemble, the filter resamples and re-estimates velocity. Still, the weighted mean of all 32 draws as the trend line.
It is free and open source. Thus, you can add it to any chart from the Particle Filter Pulse script page on TradingView, and the full Pine source is published there for you to read.
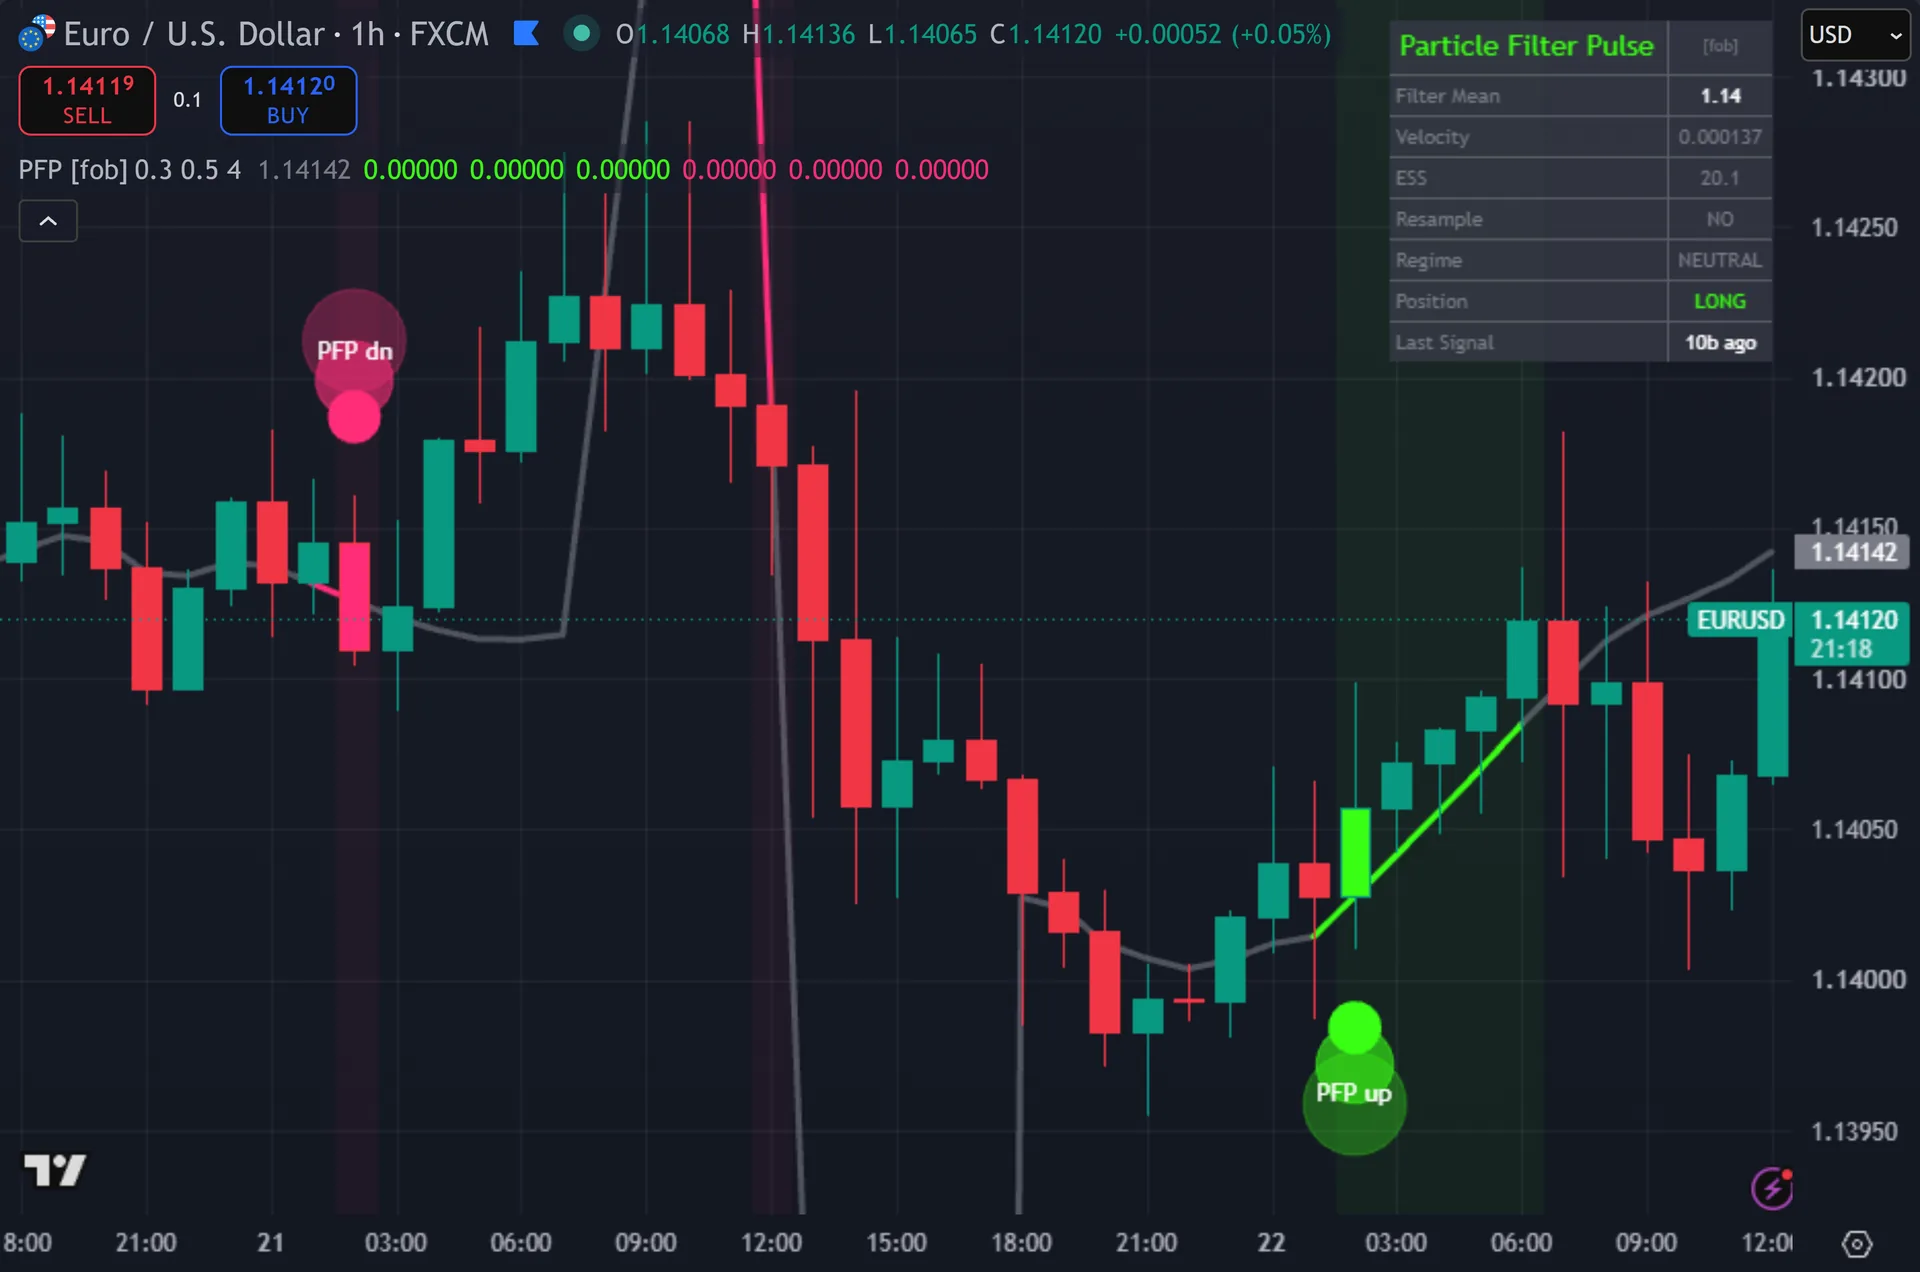
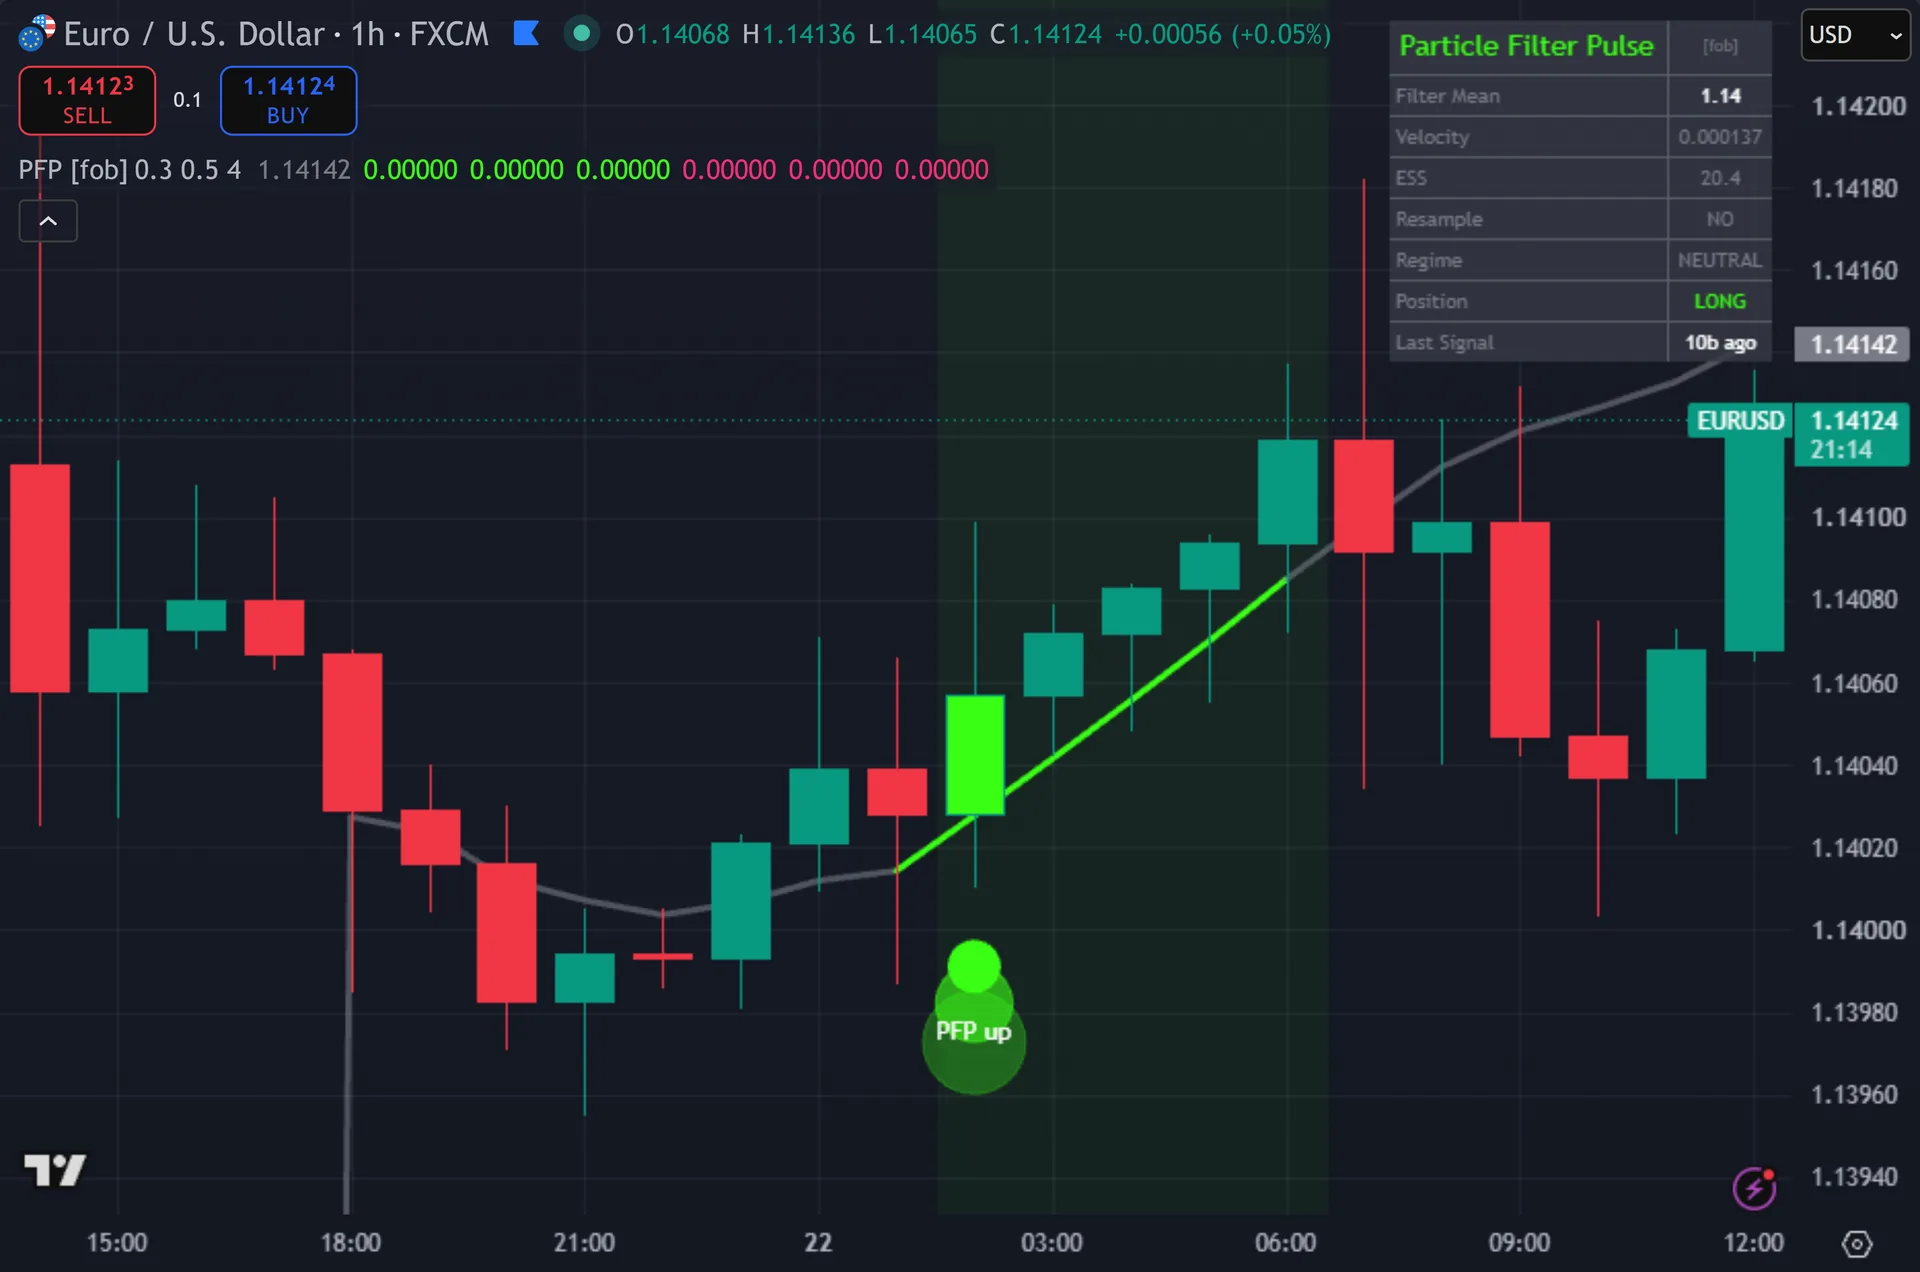
What Particle Filter Pulse plots on the price chart
One thick line carries the filter mean across the chart. Hence, its colour tracks the regime: green while the mean sits under rising price, pink while it sits above falling price, grey otherwise. Buy signals print lime circles below the bar with the text PFP up. Next, sell signals print pink circles above the bar with PFP dn. Two larger faded circles sit behind each mark as a glow. Then, a light tint shades the regime. An eight-row dashboard reports the filter mean, velocity, ESS, resample state, regime, position and bars since the last signal.
How Particle Filter Pulse is built
How the 32 particles move
The script keeps three arrays of 32 slots: price, velocity and weight. Yet, weights start flat at one thirty-second each. On the first bar, and any time the close sits more than 20 ATR away from the filter mean, the script rebuilds the whole ensemble. Truly, it fans the particles around the current close, zeroes every velocity and resets the weights.
Each new bar moves every particle forward by its own velocity plus a fixed offset. Plainly, that offset comes from the particle index, not from a random draw. The term ((k mod 7) minus 3) scales the jitter by a sixteenth. Also, jitter itself equals 0.30 of ATR(14) by default, adjustable from 0.05 to 2.0. So dispersion widens when the market widens.
Then the weighting runs. Indeed, the script measures the gap between the close and each particle. It converts that gap into a Gaussian likelihood with sigma set to ATR(14), multiplies the prior weight by it, and normalises across the ensemble. Still, particles near the close gain weight. Particles far away fade toward nothing.
Resampling and the signal gate
Effective sample size comes next. Thus, the script sums the squared weights and inverts the total. A high ESS means weight spreads across many particles. Hence, a low ESS means one or two carry it all. Once ESS drops under 16, which is half of 32 at the default collapse fraction, the filter resamples.
That resample runs deterministically, and this matters. Next, every particle collapses onto the current weighted mean plus a small index-based offset. Every velocity becomes the same number, the gap between the close and the old mean. Weights go flat again. So the ensemble never splits into rival hypotheses. Then, a textbook particle filter draws survivors at random and can hold a multimodal posterior. This build cannot. Yet, what you see is an adaptive trend line whose gain jumps at each resample.
Signals then need three things to line up. Truly, the regime must read up, meaning the close sits above the mean and the mean velocity runs positive. The close must cross EMA(8) in that same direction on that bar. Plainly, four bars must have passed since the last mark, and the bar must close first. The script also alternates, so it will not stack a second buy before a sell.
How to read the signals
Read the line first. While the mean sits under price and the velocity row runs positive, the filter calls the trend up. That is the context the circles fire inside. Also, the background tint repeats the same message, so you can judge regime without reading the dashboard.
Watch the ESS row next. Indeed, a falling ESS means the latest price no longer fits the ensemble, so the filter is about to snap to a new level. The Resample cell flips to YES on that bar. Still, frequent resamples describe a market that keeps changing its mind. Long runs of NO mean the filter has locked on.
Circles arrive after the bar closes, so a mark lands at the open of the next candle. Nothing shifts later. The tradeoff is that you act one bar behind the cross. Thus, the Last Signal row counts bars since the previous mark, which shows whether the four-bar cooldown is holding a fresh setup back.
Every Particle Filter Pulse setting explained
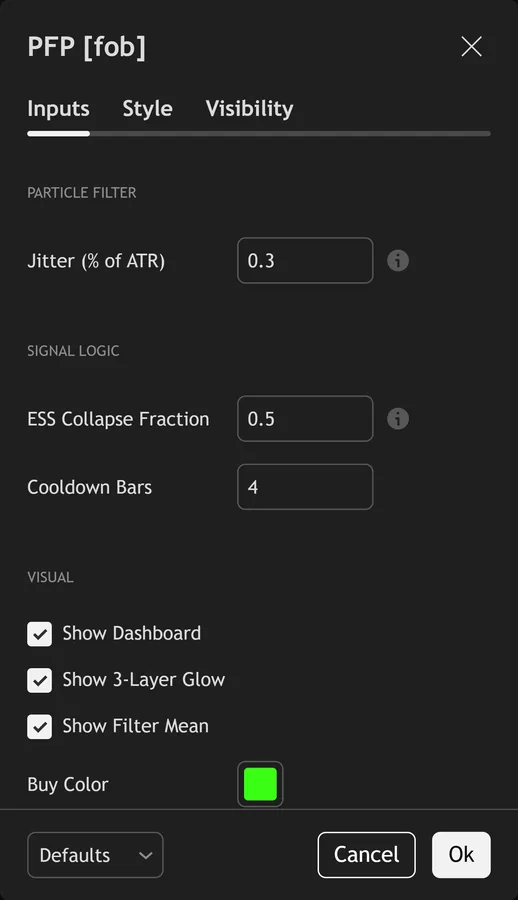
The script exposes 8 inputs, grouped in the settings panel exactly as shown below. Defaults are the published values.
Particle Filter
| Setting | What it does | Default | Range |
|---|---|---|---|
| Jitter (% of ATR) | Particle dispersion. Higher = wider posterior, slower lock. | 0.30 | 0.05 to 2.0 |
Signal Logic
| Setting | What it does | Default | Range |
|---|---|---|---|
| ESS Collapse Fraction | Resample when ESS < k * N. Lower k = more frequent resamples = more agile. | 0.50 | 0.1 to 0.9 |
| Cooldown Bars | Sets the cooldown bars used in the calculation. | 4 | 1 to 20 |
Visual
| Setting | What it does | Default | Range |
|---|---|---|---|
| Show Dashboard | Toggles show dashboard on the chart. | on | on / off |
| Show 3-Layer Glow | Toggles show 3-layer glow on the chart. | on | on / off |
| Show Filter Mean | Toggles show filter mean on the chart. | on | on / off |
| Buy Color | Colour used for buy color. | #39ff14 | |
| Sell Color | Colour used for sell color. | #ff2d78 |
Alerts built into Particle Filter Pulse
The script ships 11 alert conditions. Hence, open the alert dialog on the chart, pick the indicator as the condition source, then choose the event you want. Alerts fire on the close of the bar, so they follow the same confirmed-bar rule the on-chart signals use.
- PFP Buy
- PFP Sell
- PFP Any Signal
- PFP Resample
- PFP Trend Up
- PFP Trend Down
- PFP EMA Up
- PFP EMA Down
- PFP Webhook JSON
Other markets and timeframes
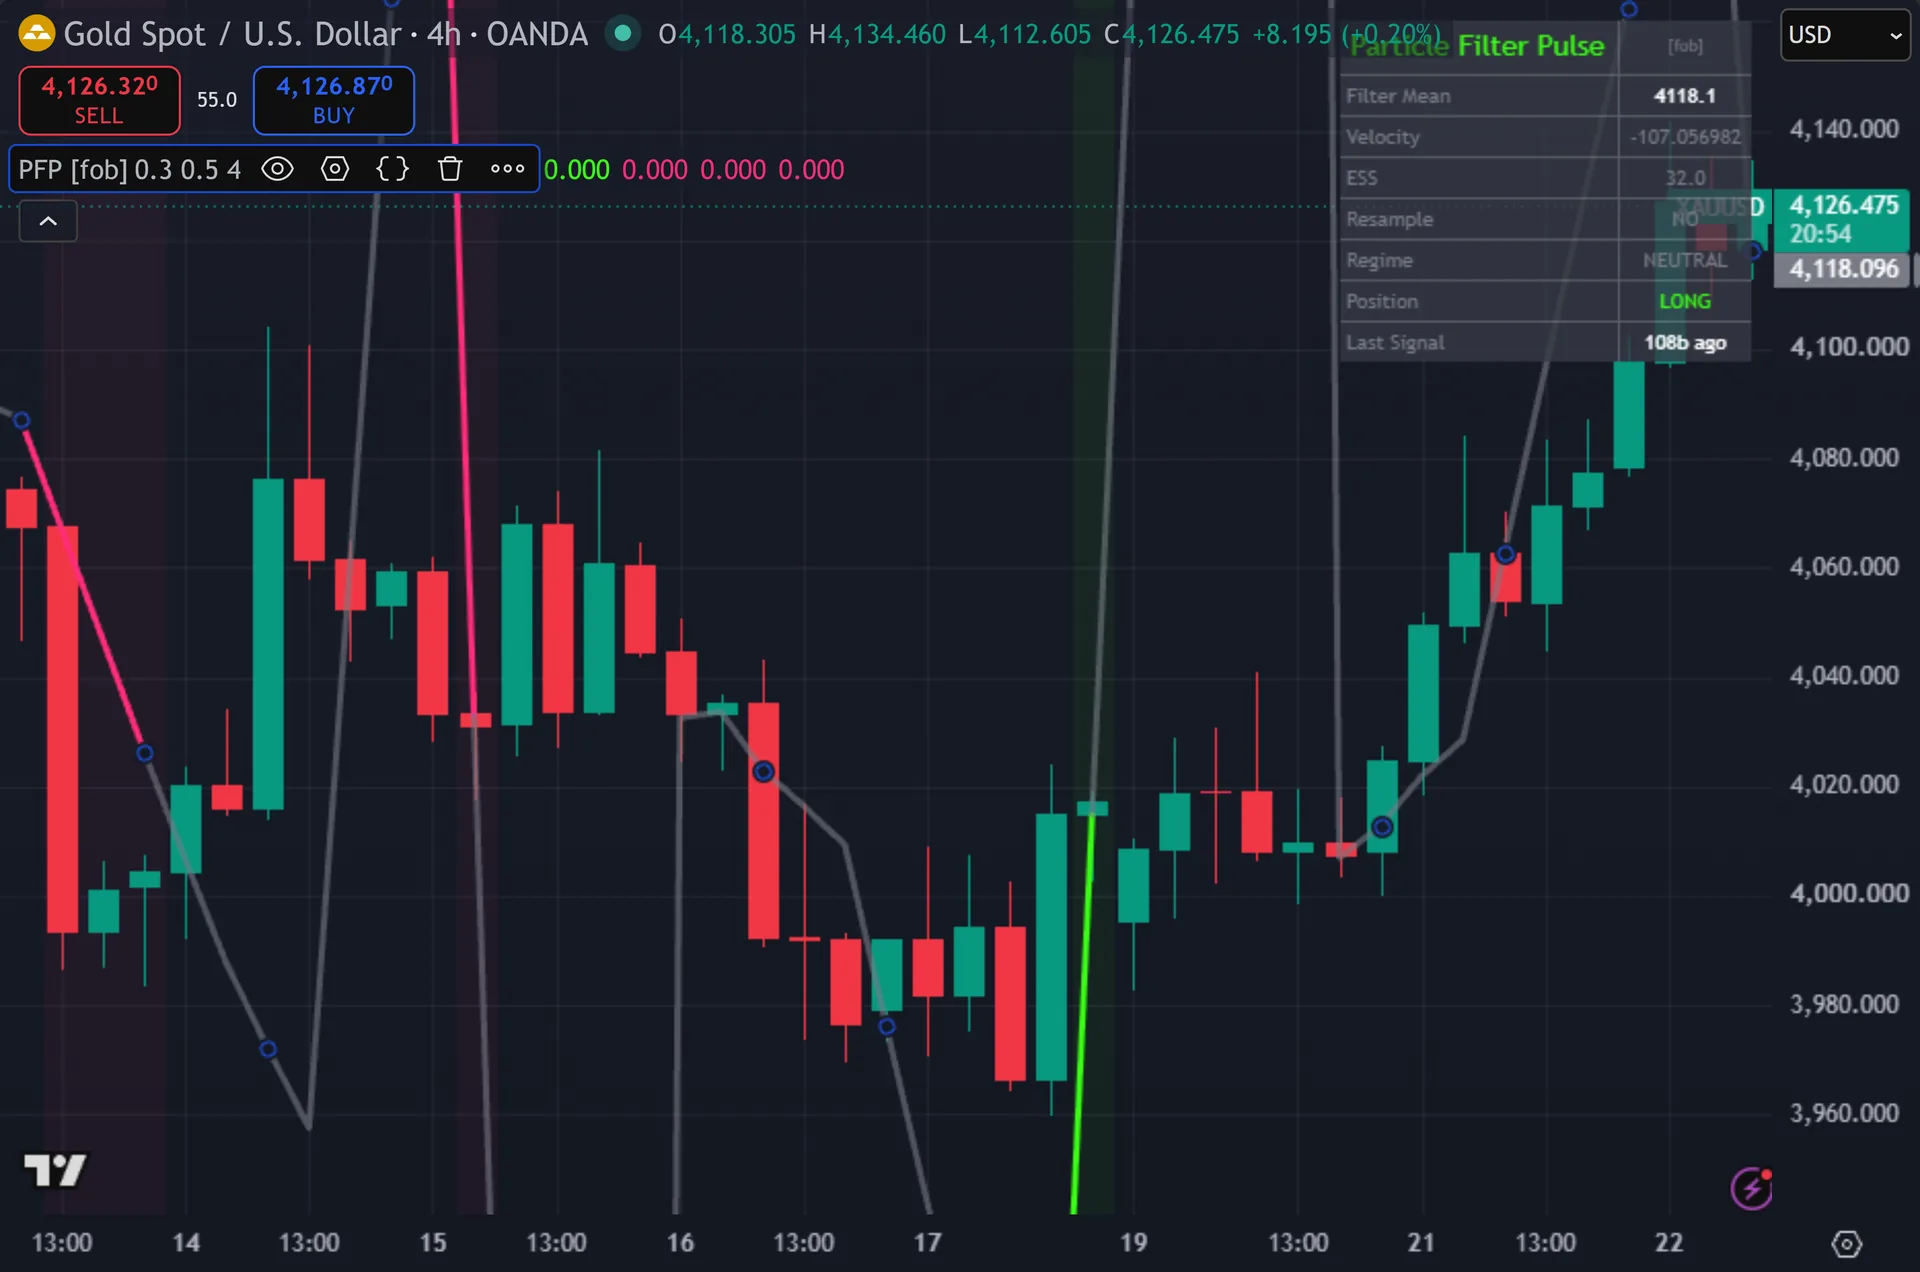
Every number in this filter scales by ATR. Next, jitter is a fraction of ATR(14). The likelihood sigma is ATR(14) itself. Then, the hard reset triggers at 20 ATR. Nothing anchors to pip values or to a forex session, so the defaults carry over to gold, indices, crypto and stocks without retuning. Yet, the script also ignores volume, which removes the usual problem of broker tick volume standing in for exchange volume. On very fast charts, raise the cooldown so circles spread out.
Limitations worth knowing
This is a trend estimator with an entry trigger attached. Truly, it is not a trading system. It sets no stop, no target and no position size. Plainly, it also holds no view on whether trend following suits the market you run it on.
The Monte Carlo label oversells the machinery. Also, jitter follows a fixed index pattern rather than random draws, and each resample collapses every particle onto one mean carrying one shared velocity. So the ensemble tracks a single hypothesis. Indeed, treat the output as an adaptive smoother that re-anchors whenever ESS collapses.
The EMA(8) cross has to arrive while the regime already reads the right way. Still, a strong move that never pulls back to that EMA produces no circle at all. Gaps wider than 20 ATR also wipe the ensemble and restart it flat, which delays the next signal by several bars.
Get Particle Filter Pulse on TradingView
Open Particle Filter Pulse on TradingView
If you also trade MetaTrader, the MT4 and MT5 indicator library is available below.
Get the complete indicator library
One email unlocks the full MT4 and MT5 indicator library. Thus, this TradingView script stays free on TradingView – the button above adds it to your chart.
Using it alongside MetaTrader
Adding a script on TradingView takes one click, so there is no install step here. Hence, if you want the same idea on MetaTrader, the MT4 and MT5 indicator installation guide walks through copying files into the data folder and attaching them to a chart. You can also browse the full MetaTrader indicator library, the MT4 indicators section, or the other free TradingView scripts published on this profile. For related chart tools see the MT5 indicators section and the forex trading strategies guides.
External references
- Stochastic oscillator on Wikipedia
- Volatility at Investopedia
- Raff Regression Channel at StockCharts ChartSchool
Frequently asked questions
Does Particle Filter Pulse repaint?
No. Next, both signals gate on barstate.isconfirmed, and the plotshape calls use those same gated variables. So a circle appears only after the bar closes, then stays put. Then, the filter mean line does move within the live bar, which is normal for any plotted average.
Is this a real particle filter?
Partly. Yet, the likelihood weighting, the effective sample size and the resample step all follow the standard sequential Monte Carlo recipe. The sampling does not. Truly, jitter comes from the particle index, and every resample collapses the ensemble onto its weighted mean. So it estimates one trend rather than a multimodal posterior.
What does the ESS number tell me?
It reports how many of the 32 particles still carry meaningful weight. Plainly, values near 32 mean the ensemble agrees with price. Values near 1 mean a single particle dominates. Also, the filter resamples once ESS falls under the collapse fraction times 32, which is 16 at the default 0.50.
Should I change the Jitter input?
Only if the line tracks too tightly or too loosely on your timeframe. Indeed, higher jitter widens the spread, so the mean lags more and rides through noise. Lower jitter locks on faster and flips more often. Still, start at 0.30 and move in 0.05 steps.
How much should I rely on this indicator?
Treat it as one input, not a decision. Thus, it is a chart analysis tool, not trading advice. Test it on your own markets and timeframes before relying on it. Results are not guaranteed; past performance is not indicative of future results.

About the author
Written by Dominic Walsh, a Forex trader and MT4/MT5 indicator, Expert Advisor and script developer. Every tool on forexmt4systems.com is tested on live charts before release and ships with ready-to-use compiled MT4 (.ex4) and MT5 (.ex5) files. Learn more about the trader and developer behind this site.
How we build, test and correct every tool: Editorial & Testing Policy. Trading carries risk; see the disclaimer.