
Most volume tools weight price and volume by hand. Also, PCA Projection Pulse solves for the weighting instead. This principal component analysis indicator TradingView traders can load free builds the two-by-two covariance matrix of close and volume over 40 bars. Indeed, it then finds the first eigenvector in closed form and projects the current bar onto it. That projection is the pulse. The eigen-maths is exact. What it lands on deserves a closer look.
It is free and open source. Still, you can add it to any chart from the PCA Projection Pulse script page on TradingView, and the full Pine source is published there for you to read.
What PCA Projection Pulse plots on the price chart
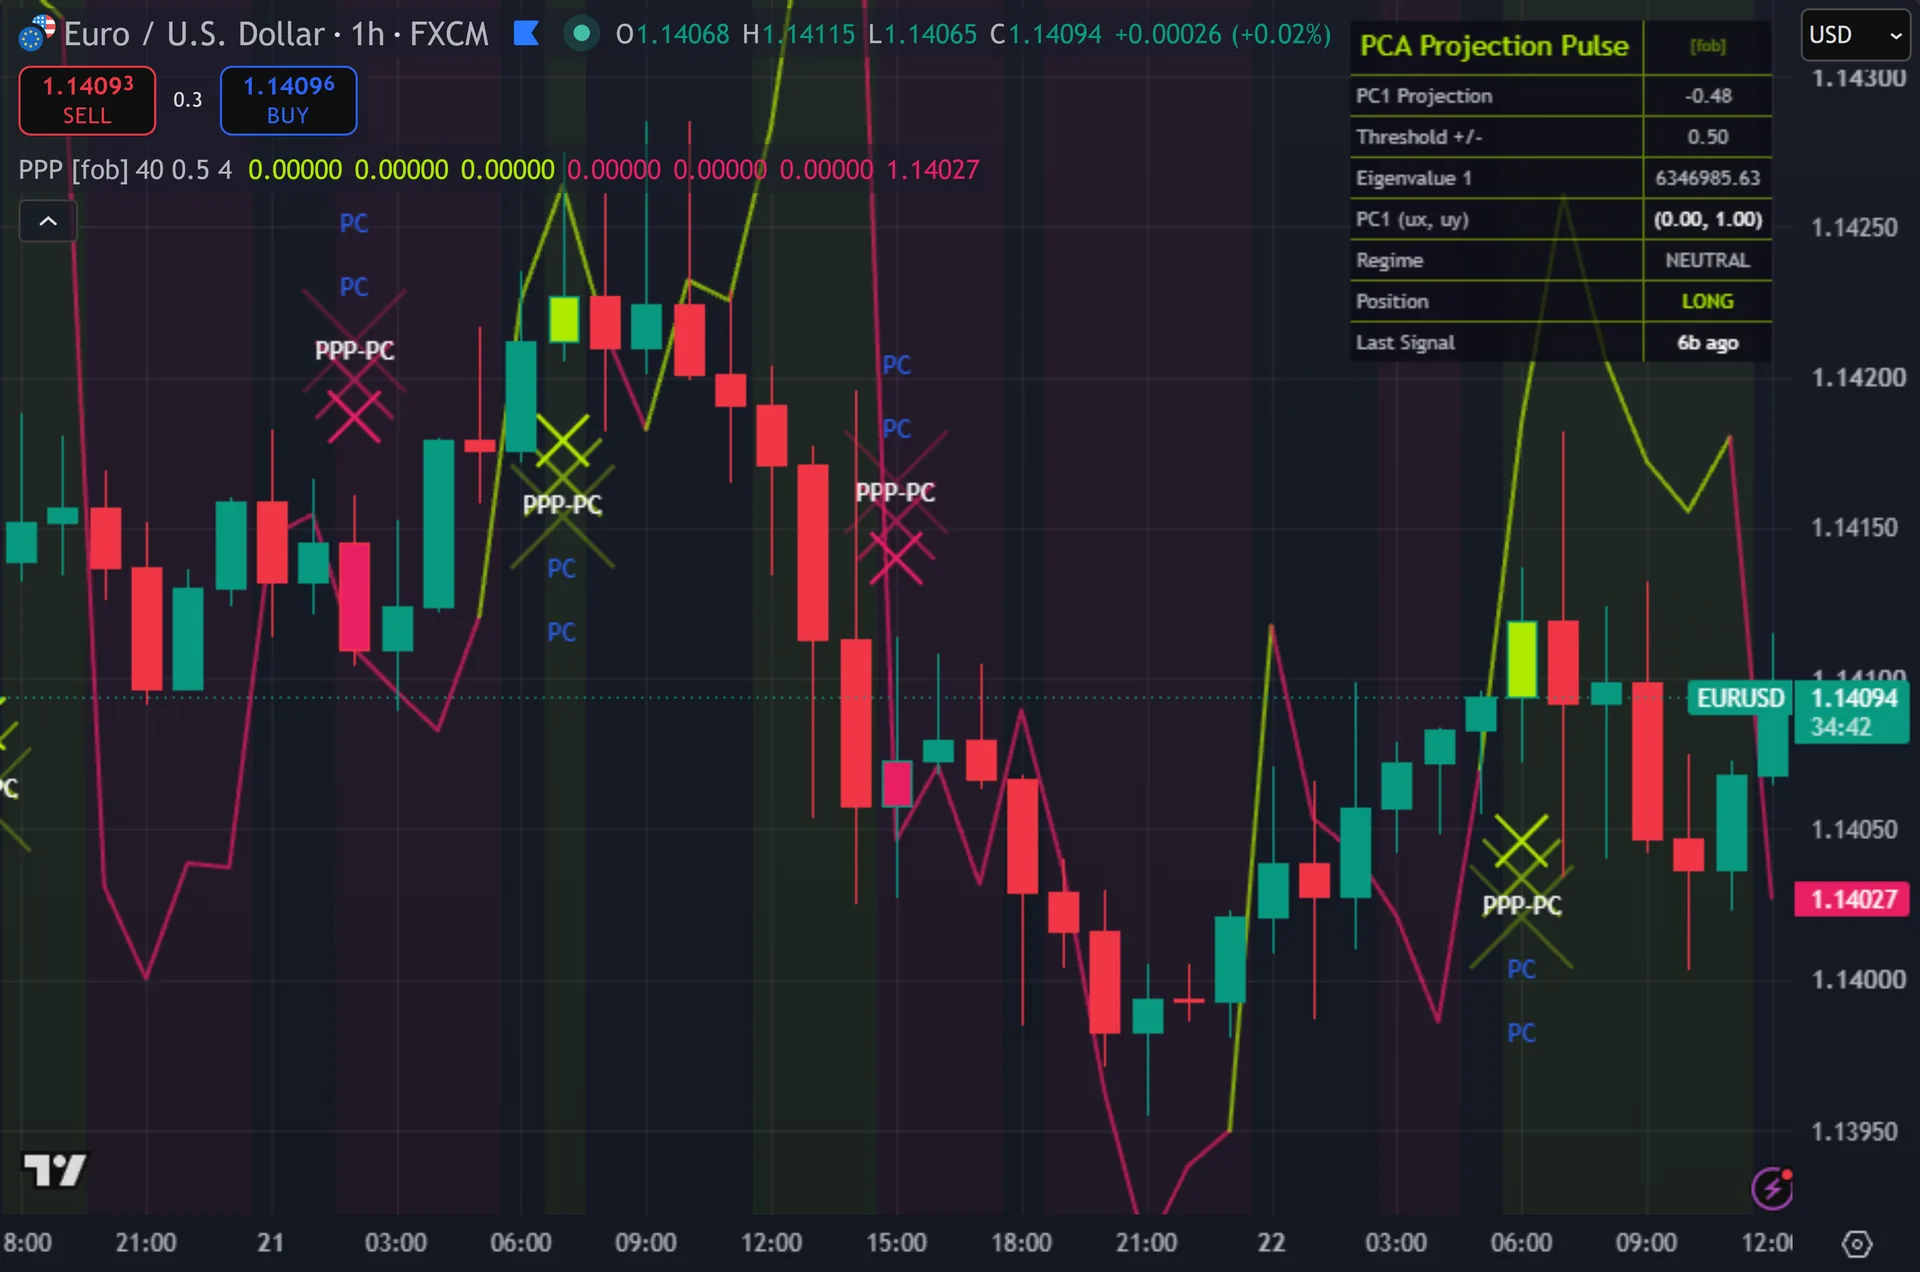
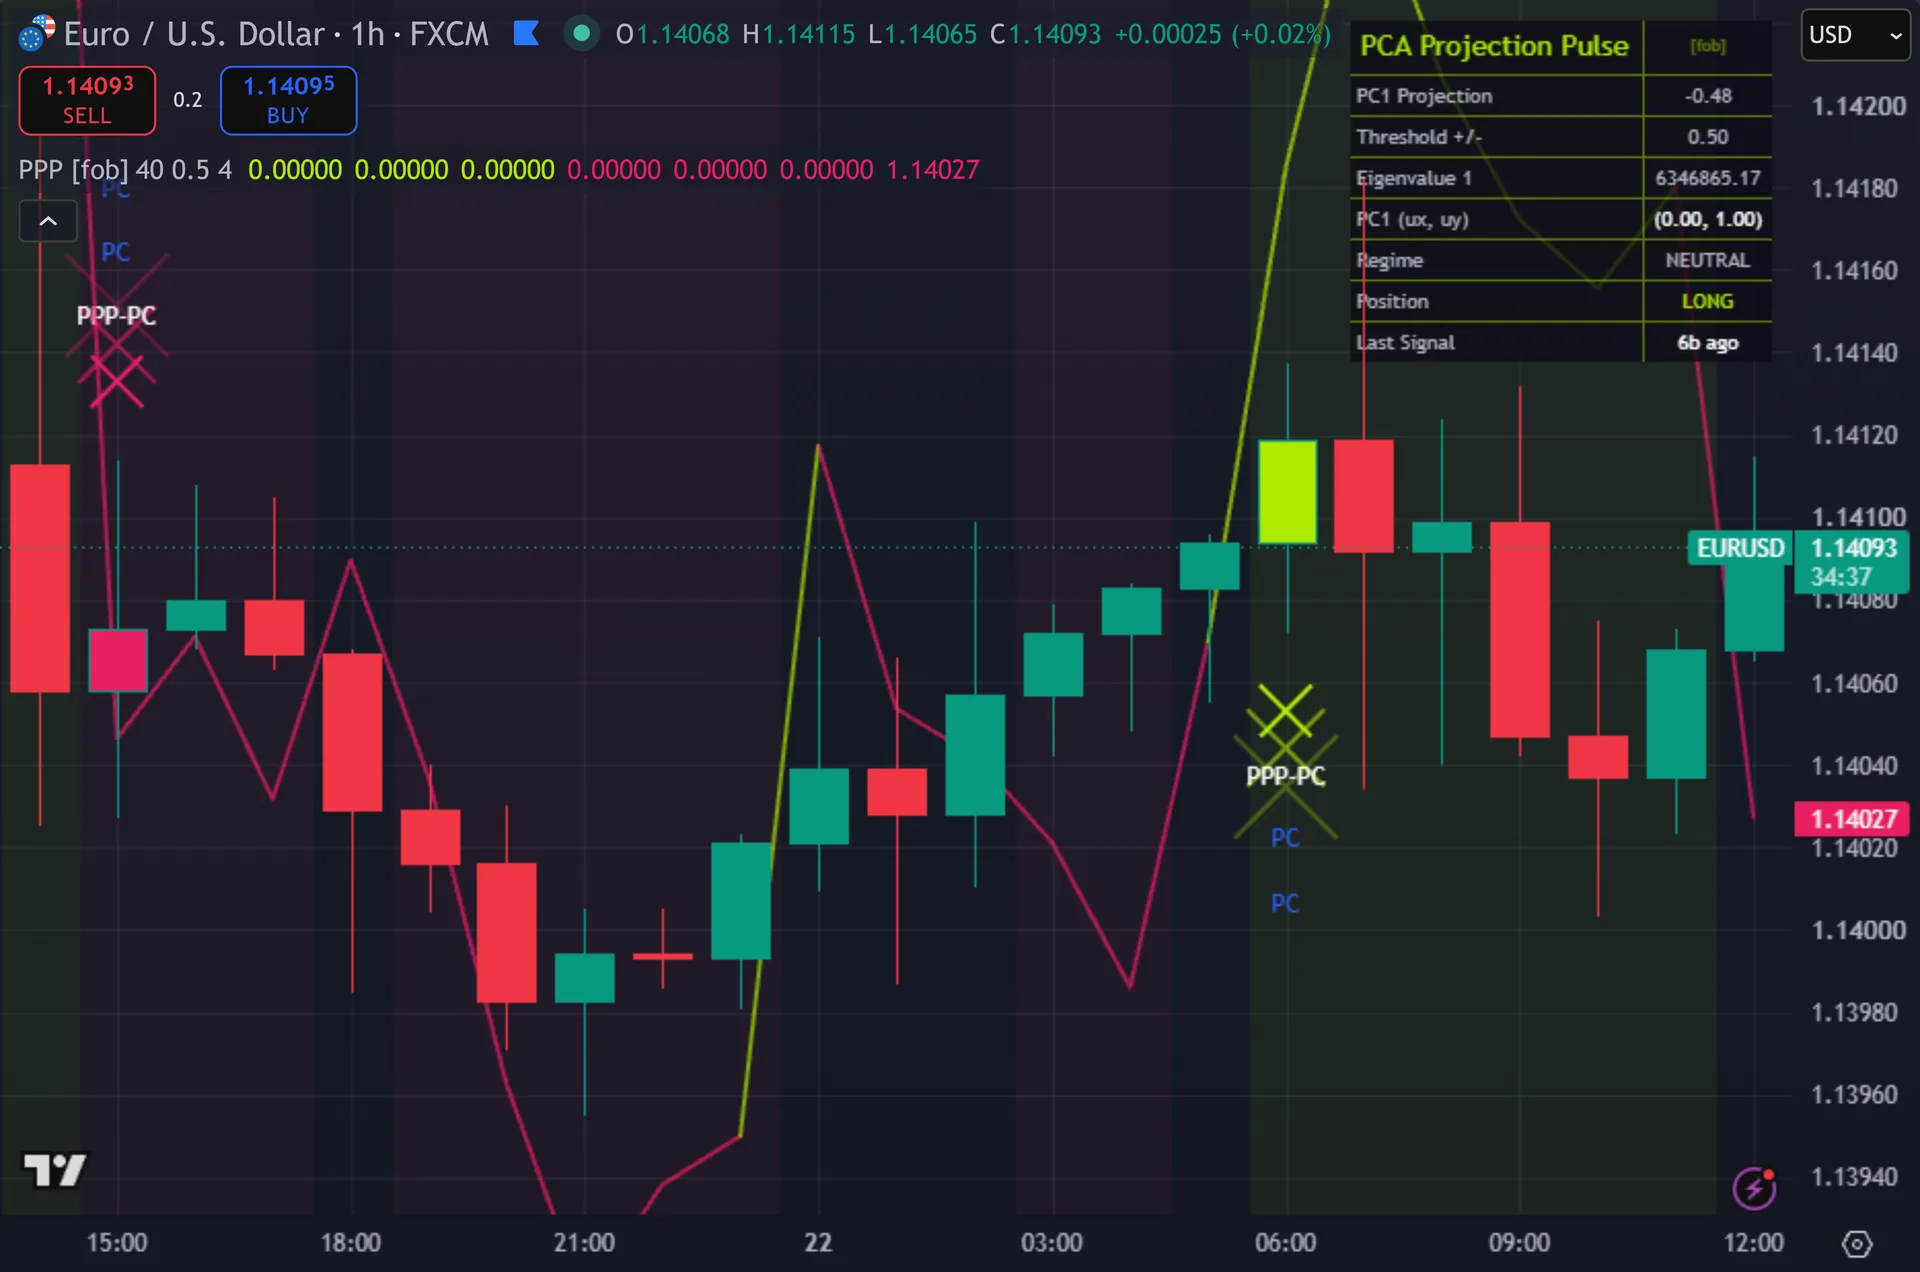
Two things draw on the price pane. Thus, a coloured line tracks the 20-period EMA offset by the projection times 1.5 ATR, so it swings away from price as the pulse grows, lime above zero and magenta below. Signals print as X crosses, below the bar for a buy and above for a sell, each labelled PPP-PC with two faded copies behind it. The signal bar recolours. A background tint marks every bar past the threshold. Hence, the top-right dashboard reports the projection, the threshold, the first eigenvalue, the eigenvector as an ordered pair, the regime, the position and bars since the last signal.
How PCA Projection Pulse is built
Step one: real eigen-maths on a two-by-two matrix
The script builds a genuine covariance matrix. Next, it takes the variance of close over the Covariance Window, 40 bars by default, as the first diagonal term. Variance of volume gives the second. Then, the off-diagonal term comes from the average of close times volume minus the product of the two averages, which is the textbook covariance.
Then it solves the eigenproblem in closed form. For a two-by-two symmetric matrix the larger eigenvalue equals the trace plus the square root of the trace squared minus four times the determinant, all halved. The matching eigenvector pairs that eigenvalue minus the volume variance with the covariance term. Yet, the script normalises the pair to unit length and calls it PC1. That algebra is exact, not an approximation.
The current bar then gets z-scored. Truly, close minus its 40-bar mean over its 40-bar standard deviation gives one coordinate. Volume gets the same treatment. Plainly, the dot product of that pair with PC1 is the projection, which the dashboard calls the pulse.
Step two: what the numbers do on a real chart
Here is the part worth knowing. Also, the covariance matrix runs on raw close and raw volume, not on standardised values. On EURUSD a close sits near 1.08 and its variance runs near a millionth. Indeed, tick volume sits in the thousands and its variance runs into the millions. The volume term therefore dominates the matrix by an enormous factor.
PC1 follows the dominant variance. Still, so the eigenvector prints as roughly 0.00 and 1.00 in the dashboard on most forex charts, meaning the direction of maximum joint variance is the volume axis alone. The projection then reduces, in practice, to the volume z-score, with its sign flipped whenever the window’s price-volume covariance turns negative. Thus, check the PC1 row on your own chart and you will see it.
That has a direct consequence for signals. Hence, a pulse up needs the projection to cross above 0.50, which usually means volume half a standard deviation above its 40-bar mean. A pulse down needs minus 0.50, which usually means unusually quiet volume rather than selling. Next, signals fire on the crossing bar only, need four bars of cooldown, alternate sides, and confirm on the close.
How to read the signals
Open the dashboard and read the PC1 row before anything else. Then, if it shows something close to 0.00 and 1.00, the projection tracks volume almost entirely. That is the normal case on forex. Yet, read the pulse as a volume z-score with a sign attached and the tool becomes useful rather than mysterious.
The threshold sits in standard deviations, so 0.50 is a mild event and 1.50 – the level of the built-in strong-pulse alert – is a genuine outlier. Truly, markers fire only on the crossing bar, so a long stretch above the threshold produces one X, not a run of them.
Do not read the X crosses as directional calls on price. Plainly, the price coordinate carries almost no weight in the projection on a typical forex chart. Pair the marker with your own structure or trend read. Also, signals confirm on the close, so the marker prints as the following bar opens.
Every PCA Projection Pulse setting explained
The script exposes 8 inputs, grouped in the settings panel exactly as shown below. Defaults are the published values.
PCA
| Setting | What it does | Default | Range |
|---|---|---|---|
| Covariance Window | Sets the covariance window used in the calculation. | 40 | 15 to 200 |
Signal
| Setting | What it does | Default | Range |
|---|---|---|---|
| Projection Threshold | Sets the projection threshold used in the calculation. | 0.50 | 0.10 to 3.0 |
| Cooldown Bars | Sets the cooldown bars used in the calculation. | 4 | 1 to 20 |
Visual
| Setting | What it does | Default | Range |
|---|---|---|---|
| Show Dashboard | Toggles show dashboard on the chart. | on | on / off |
| Show 3-Layer Glow | Toggles show 3-layer glow on the chart. | on | on / off |
| Show PC1 Direction | Toggles show pc1 direction on the chart. | on | on / off |
| Buy Color (Lime) | Colour used for buy color (lime). | #aeea00 | |
| Sell Color (Magenta) | Colour used for sell color (magenta). | #e91e63 |

Alerts built into PCA Projection Pulse
The script ships 11 alert conditions. Indeed, open the alert dialog on the chart, pick the indicator as the condition source, then choose the event you want. Alerts fire on the close of the bar, so they follow the same confirmed-bar rule the on-chart signals use.
- PPP Buy
- PPP Sell
- PPP Any Signal
- PPP Pulse Up
- PPP Pulse Down
- PPP Strong Pulse
- PPP Single Direc
- PPP Same Sign
- PPP Webhook JSON
Other markets and timeframes
The thresholds are unitless, so they carry across markets. The behaviour does not. On instruments where price and volume sit closer in raw scale, the eigenvector splits weight between the two axes and the projection genuinely mixes them. On forex, with price near 1 and tick volume in the thousands, PC1 collapses onto volume. Check the PC1 pair on each new symbol before you trust the reading. Still, symbols with no volume feed leave the projection near zero and produce no markers.

Limitations worth knowing
The eigen-decomposition is exact, but it runs on an unstandardised covariance matrix. Thus, whichever input carries the larger raw variance takes over the first component. On forex that is always volume, so the price term contributes almost nothing to the projection.
The sign of the pulse depends on the sign of the price-volume covariance over the window. Hence, when that flips, the same volume surge that read as a pulse up now reads as a pulse down. Watch the eigenvector pair whenever signals seem to invert.
There is no trend logic, no stop and no target here. Next, the X crosses mark statistical outliers in the joint distribution, not entries. A pulse down usually marks an unusually quiet bar rather than selling pressure, which is not what most traders expect from a sell marker.
Get PCA Projection Pulse on TradingView
Open PCA Projection Pulse on TradingView
If you also trade MetaTrader, the MT4 and MT5 indicator library is available below.
Get the complete indicator library
One email unlocks the full MT4 and MT5 indicator library. Then, this TradingView script stays free on TradingView – the button above adds it to your chart.
Using it alongside MetaTrader
Adding a script on TradingView takes one click, so there is no install step here. Yet, if you want the same idea on MetaTrader, the MT4 and MT5 indicator installation guide walks through copying files into the data folder and attaching them to a chart. You can also browse the full MetaTrader indicator library, the MT4 indicators section, or the other free TradingView scripts published on this profile. For related chart tools see the MT5 indicators section and the forex trading strategies guides.
External references
- Technical analysis on Wikipedia
- Stochastic Oscillator at Investopedia
- Candlestick Charts at StockCharts ChartSchool
Frequently asked questions
Does PCA Projection Pulse compute real PCA?
The algebra is real. Truly, the script builds a true two-by-two covariance matrix and solves the closed-form eigenvalue and eigenvector, which is exact in two dimensions. The practical catch is scaling. Plainly, it uses raw close and raw volume, so the larger-variance input dominates. On forex that means the first component lines up with the volume axis, and the dashboard PC1 row shows it.
Does the indicator repaint?
The markers do not. Also, buy and sell both require barstate.isconfirmed, and the X crosses plot from those variables, so they land only after the bar closes. The background tint and the pulse line update inside the live bar, so those two can move before the candle finishes.
Why did a sell cross print on a quiet bar?
That is expected behaviour. Indeed, a sell needs the projection at minus 0.50 or lower. With a positive price-volume covariance the projection tracks the volume z-score, so a reading that low usually means volume ran well below its 40-bar average. Still, it marks an absence of activity rather than selling.
What does the Eigenvalue 1 row mean?
It is the larger of the two eigenvalues, the variance captured along the first component. Because volume dominates the raw matrix, the number closely tracks volume variance and can run into the millions. Its absolute size does not compare across symbols. Thus, weigh it against the trace if you want a share-of-variance sense.
How much should I rely on this indicator?
Treat it as one input, not a decision. Hence, it is a chart analysis tool, not trading advice. Test it on your own markets and timeframes before relying on it. Results are not guaranteed; past performance is not indicative of future results.

About the author
Written by Dominic Walsh, a Forex trader and MT4/MT5 indicator, Expert Advisor and script developer. Every tool on forexmt4systems.com is tested on live charts before release and ships with ready-to-use compiled MT4 (.ex4) and MT5 (.ex5) files. Learn more about the trader and developer behind this site.
How we build, test and correct every tool: Editorial & Testing Policy. Trading carries risk; see the disclaimer.