
Averages chase spikes. Order statistics do not. Quantile Drift Engine is an interquartile range indicator TradingView traders can use to read direction without that distortion. It ranks the last 40 closes, takes the 25th and 75th percentiles, and plots the midpoint between them. One outlier bar barely moves that midpoint, because it shifts the ordering rather than the sum.
It is free and open source. You can add it to any chart from the Quantile Drift Engine script page on TradingView, and the full Pine source is published there for you to read.
What Quantile Drift Engine plots on the price chart
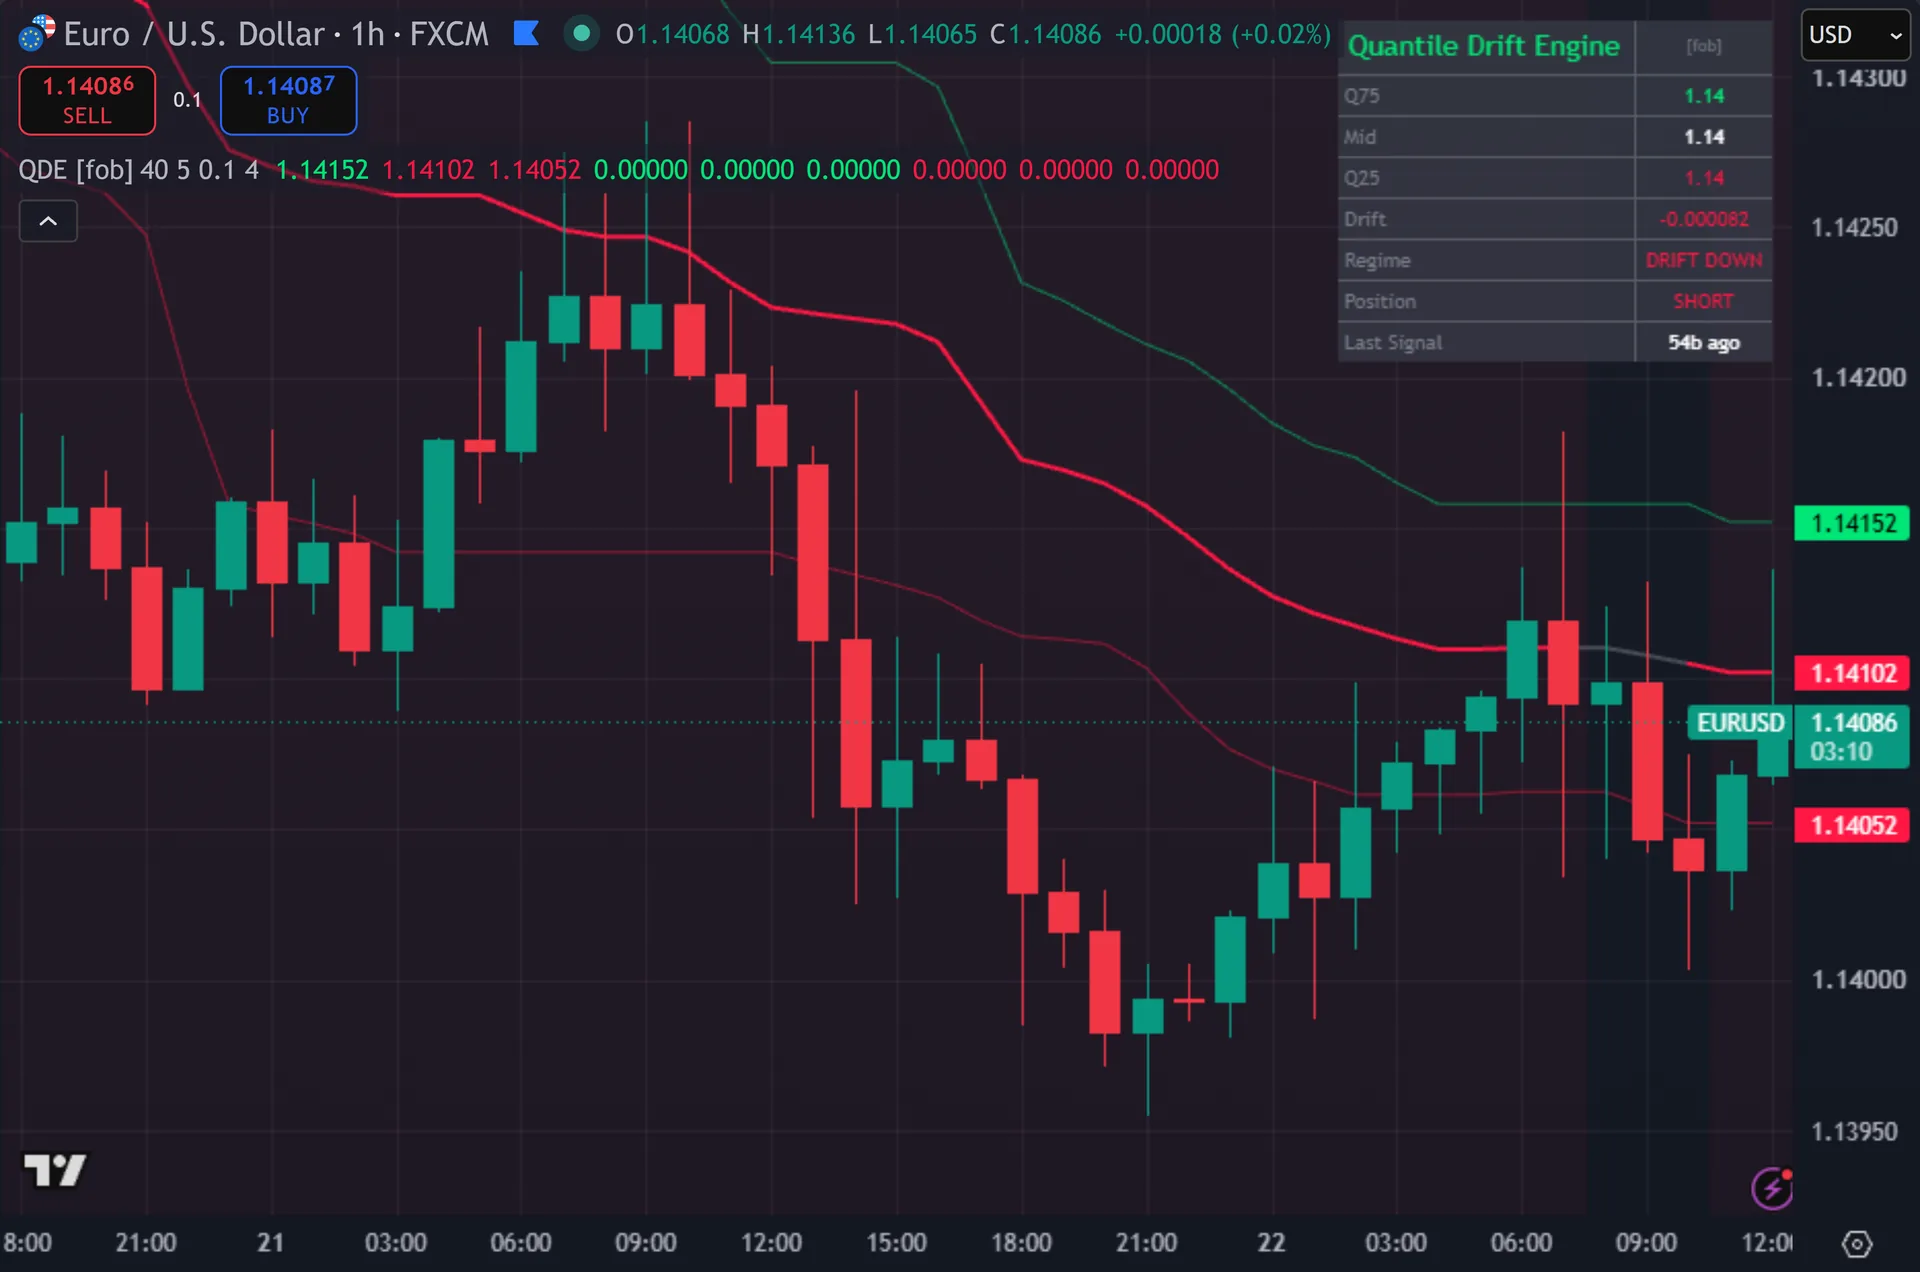
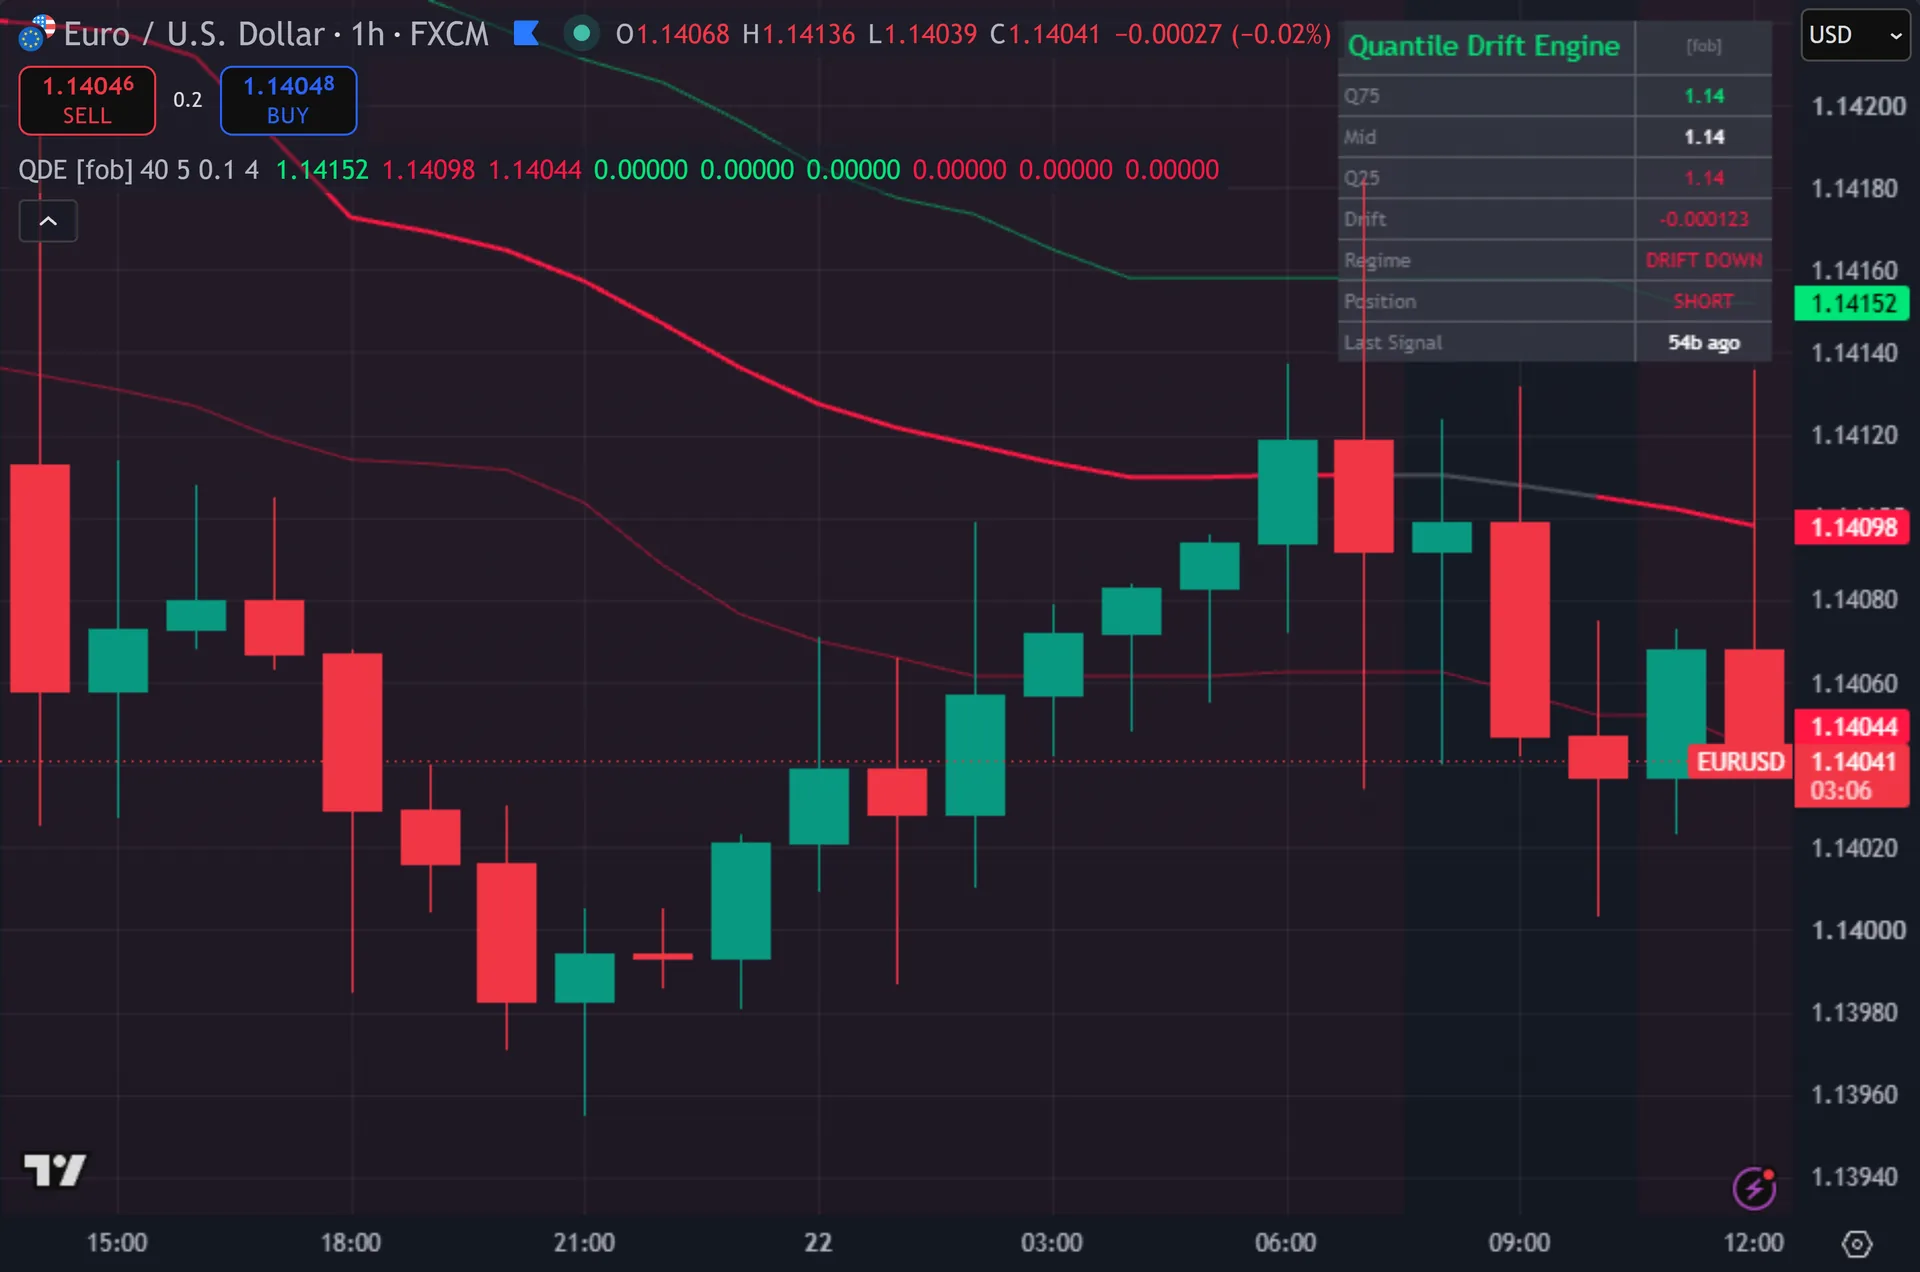
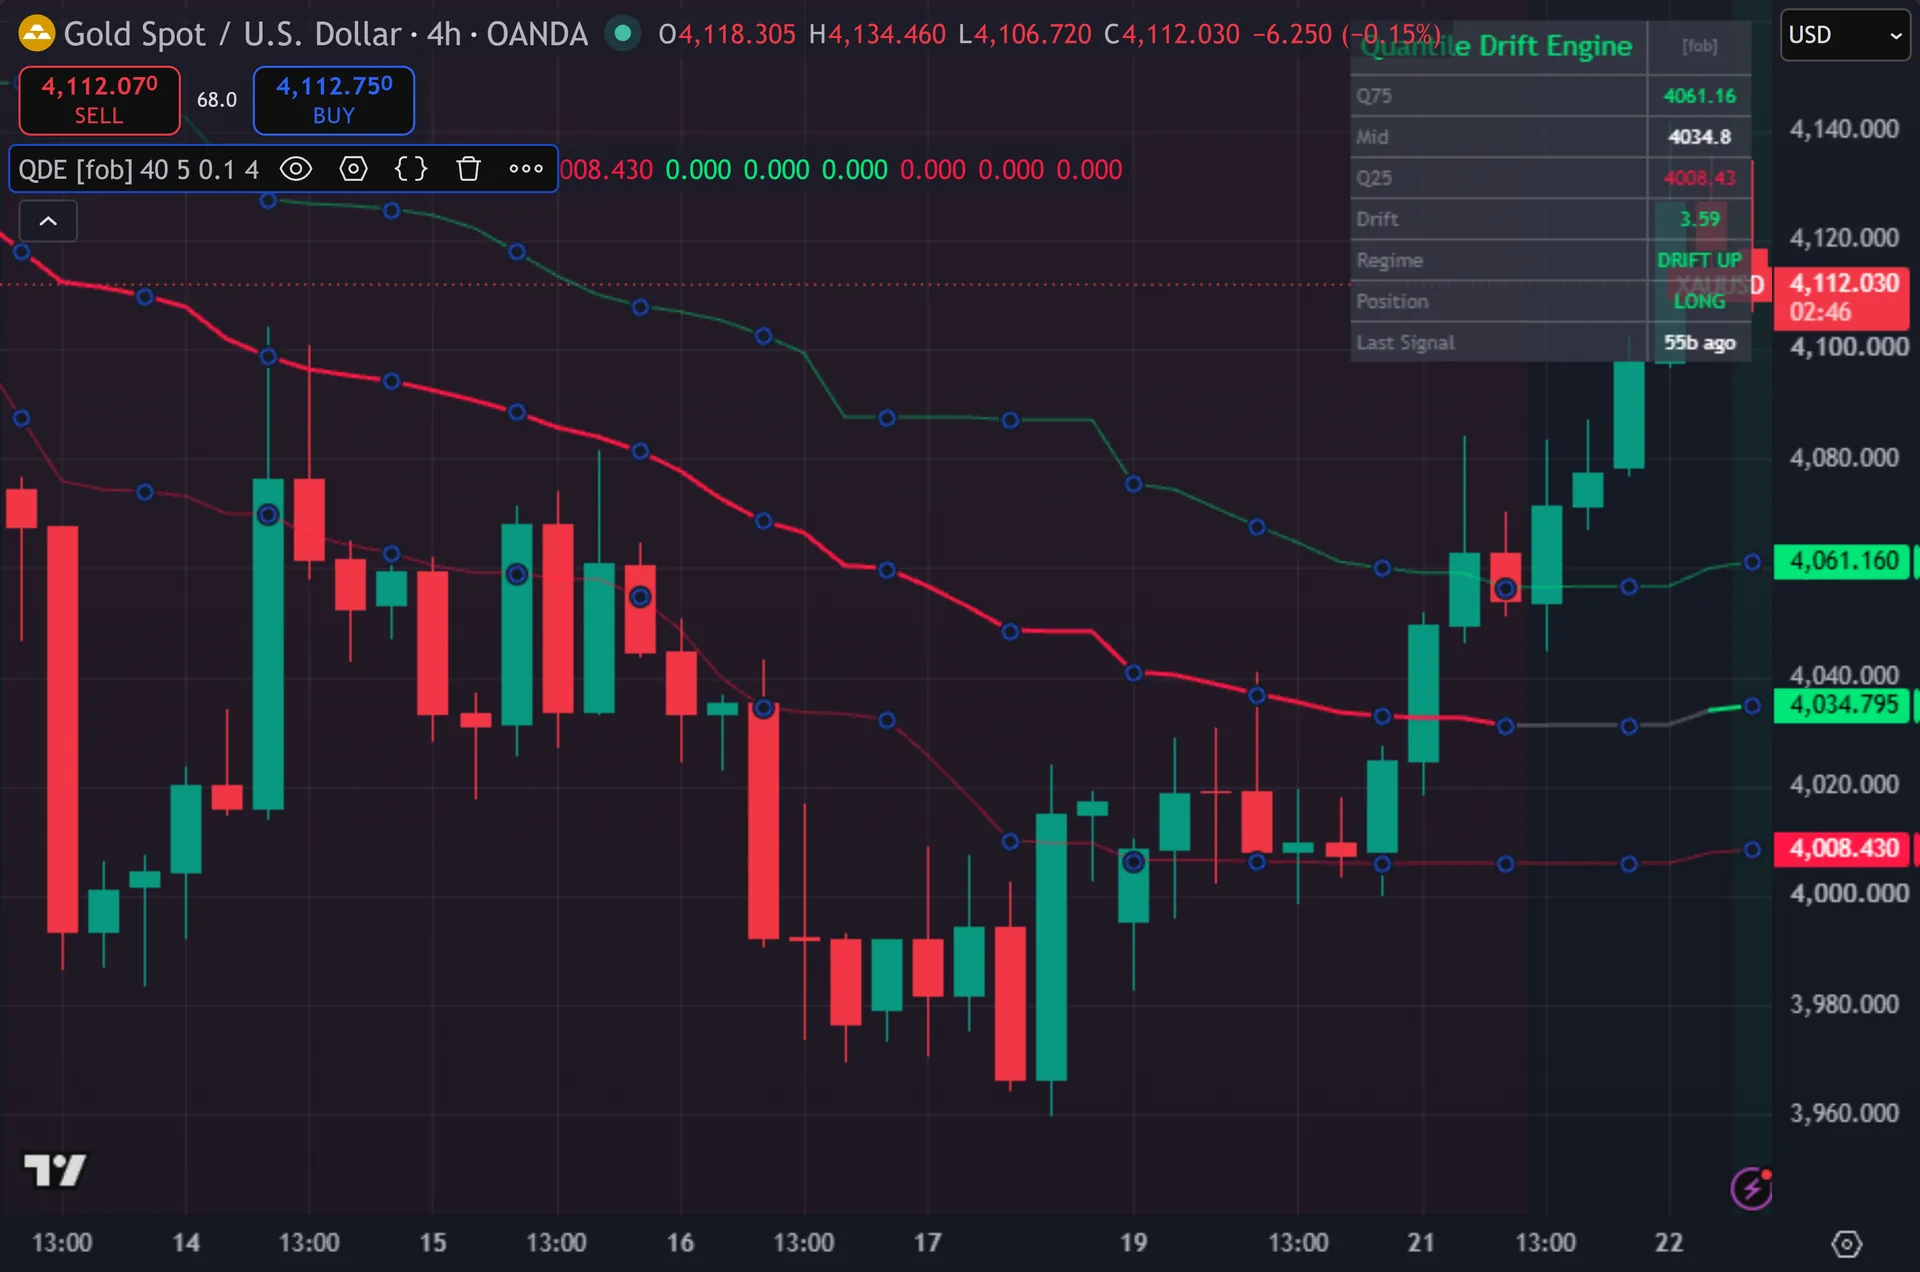
Three lines cover the chart. The 75th percentile runs on top in a faded buy colour, the 25th percentile below in a faded sell colour, and the midpoint sits between them at double thickness. The midpoint changes colour with the drift regime – buy colour on positive drift, sell colour on negative, grey when flat. Triangles mark signals with the text QDE up or QDE dn. The background carries a light regime tint. An eight-row dashboard prints Q75, mid, Q25, the raw drift value, the regime name, position and bars since the last signal.
How Quantile Drift Engine is built
Building the quantile bands
The script calls ta.percentile_linear_interpolation on close over a 40-bar window, once at 25 and once at 75. That function sorts the window and interpolates between the two nearest ranks. So the two bands mark the boundaries of the middle half of recent closes.
The midpoint is the plain average of those two levels, sometimes called the midhinge. It is not a moving average and it is not the median. Because it depends only on rank order, a single spike bar moves it far less than it moves an SMA over the same window.
Bands built this way step rather than glide. A level holds flat until the sorted window shifts a rank, then it jumps. Expect a staircase look instead of a smooth curve, especially on higher timeframes with a long window.
Measuring drift and firing signals
Drift is the midpoint minus its own value five bars ago. That produces a raw price change, which means little on its own across markets. So the script scales it by ATR. The threshold sits at 0.10 times ATR(14), and the 14 is hard-coded – there is no ATR length input on the settings panel.
Drift above the threshold sets the up regime. Drift below the negative threshold sets the down regime. Between the two the script reads flat, prints no background tint and blocks every signal.
A buy needs the up regime plus a close crossing over the midpoint on the same bar. A sell needs the down regime plus a close crossing under it. Three gates then run. The position state must not already read long, four bars must have passed since the last signal, and barstate.isconfirmed must be true. So arrows appear on closed bars only.
How to read the signals
The band pair works as a range map. A close above Q75 sits in the top quarter of the last 40 closes. A close below Q25 sits in the bottom quarter. The gap between the bands shows how spread out recent closes have been.
Signals need a pullback by design. In a strong trend price can hold above Q75 for dozens of bars and never touch the midpoint, so no arrow prints. The script wants a drifting midline plus a close that comes back and crosses it. Read the quiet stretches as the filter working.
Check the Drift row against the regime. A drift value hovering near the threshold flips the regime on and off, and the midline colour flickers with it. Raise Drift Threshold x ATR above the 0.10 default to demand a firmer slope before any signal can fire.
Every Quantile Drift Engine setting explained
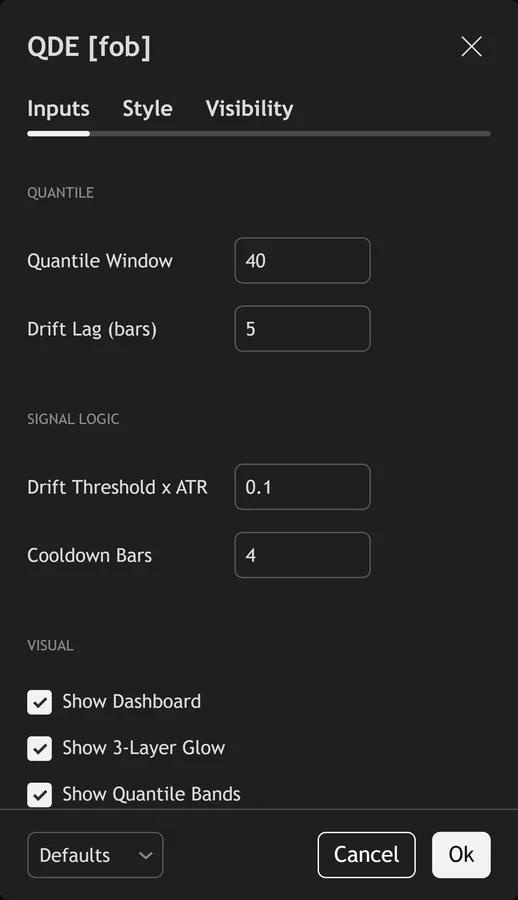
The script exposes 9 inputs, grouped in the settings panel exactly as shown below. Defaults are the published values.
Quantile
| Setting | What it does | Default | Range |
|---|---|---|---|
| Quantile Window | Sets the quantile window used in the calculation. | 40 | 10 to 200 |
| Drift Lag (bars) | Sets the drift lag (bars) used in the calculation. | 5 | 1 to 20 |
Signal Logic
| Setting | What it does | Default | Range |
|---|---|---|---|
| Drift Threshold x ATR | Sets the drift threshold x atr used in the calculation. | 0.10 | 0.01 to 2.0 |
| Cooldown Bars | Sets the cooldown bars used in the calculation. | 4 | 1 to 20 |
Visual
| Setting | What it does | Default | Range |
|---|---|---|---|
| Show Dashboard | Toggles show dashboard on the chart. | on | on / off |
| Show 3-Layer Glow | Toggles show 3-layer glow on the chart. | on | on / off |
| Show Quantile Bands | Toggles show quantile bands on the chart. | on | on / off |
| Buy Color | Colour used for buy color. | #00e676 | |
| Sell Color | Colour used for sell color. | #ff1744 |
Alerts built into Quantile Drift Engine
The script ships 11 alert conditions. Open the alert dialog on the chart, pick the indicator as the condition source, then choose the event you want. Alerts fire on the close of the bar, so they follow the same confirmed-bar rule the on-chart signals use.
- QDE Buy
- QDE Sell
- QDE Any Signal
- QDE Drift Up
- QDE Drift Down
- QDE Mid Cross Up
- QDE Mid Cross Dn
- QDE Outside IQR
- QDE Webhook JSON
Other markets and timeframes
Both the bands and the gate use relative measures. Percentiles come from the symbol’s own closes, and the drift gate divides by ATR, so nothing is quoted in pips. The defaults carry across gold, indices, crypto and equities untouched. It reads no volume anywhere, so instruments with a thin or missing volume feed behave identically. The window is the input worth revisiting: 40 bars means something quite different on a 1-minute chart than on a daily one.
Limitations worth knowing
This is a direction filter with a midline trigger. It does no risk work at all – no stop, no target, no sizing – and the dashboard position row simply records the side of the last signal.
The name suggests more than the code delivers. There is no quantile regression, no distribution fitting and no forecast. It is a rolling percentile band pair, a lagged difference of the midpoint and two threshold comparisons.
The midpoint lags. It comes from a 40-bar window and the drift spans five bars, so turns register late. In a sharp reversal the regime can still read up while price has already broken down, and the script keeps blocking sells until drift crosses the threshold.
The bands step in jumps rather than moving smoothly, so a midpoint cross can trigger from a band shift rather than from real momentum.
Get Quantile Drift Engine on TradingView
Open Quantile Drift Engine on TradingView
If you also trade MetaTrader, the MT4 and MT5 indicator library is available below.
Get the complete indicator library
One email unlocks the full MT4 and MT5 indicator library. This TradingView script stays free on TradingView – the button above adds it to your chart.
Using it alongside MetaTrader
Adding a script on TradingView takes one click, so there is no install step here. If you want the same idea on MetaTrader, the MT4 and MT5 indicator installation guide walks through copying files into the data folder and attaching them to a chart. You can also browse the full MetaTrader indicator library, the MT4 indicators section, or the other free TradingView scripts published on this profile. For related chart tools see the MT5 indicators section and the forex trading strategies guides.
External references
- Average true range on Wikipedia
- Historicalvolatility at Investopedia
- Raff Regression Channel at StockCharts ChartSchool
Frequently asked questions
Does the Quantile Drift Engine repaint?
No. Both signal booleans include barstate.isconfirmed, and the triangles, glow layers and bar colouring key off those same booleans. A signal therefore appears only after the bar closes, so the historical chart matches what a live chart would have shown.
How does the midpoint differ from a 40-period moving average?
A moving average sums every close, so one spike drags it. The midpoint averages the 25th and 75th percentiles instead, and those come from rank order. An extreme bar simply lands at the end of the sorted window and leaves the middle half largely untouched.
Why do the bands look like stairs?
Percentiles change only when the sorted window changes rank. Between those shifts a level holds perfectly flat, then steps. Widen the Quantile Window for smoother, slower levels, or shorten it for quicker, choppier ones.
Can I change the ATR length?
No. The script fixes ATR at 14 bars in code and exposes no input for it. You can still tune sensitivity through Drift Threshold x ATR, which multiplies that ATR value and defaults to 0.10.
How much should I rely on this indicator?
Treat it as one input, not a decision. It is a chart analysis tool, not trading advice. Test it on your own markets and timeframes before relying on it. Results are not guaranteed; past performance is not indicative of future results.

About the author
Written by Dominic Walsh, a Forex trader and MT4/MT5 indicator, Expert Advisor and script developer. Every tool on forexmt4systems.com is tested on live charts before release and ships with ready-to-use compiled MT4 (.ex4) and MT5 (.ex5) files. Learn more about the trader and developer behind this site.
How we build, test and correct every tool: Editorial & Testing Policy. Trading carries risk; see the disclaimer.