
Trend systems bleed in ranges. Range systems bleed in trends. Regime Compass answers which one you face. Also, this trend or range indicator TradingView traders can run free reads four measures – ADX, Bollinger band width, ATR percentile and a Hurst estimate – and lets them vote. The winner sets the regime: Strong Trend, Weak Trend, Ranging or Volatile. Indeed, a dashboard shows every measure, the verdict and how the last 100 bars split.
It is free and open source. Still, you can add it to any chart from the Regime Compass script page on TradingView, and the full Pine source is published there for you to read.
What Regime Compass plots on the price chart
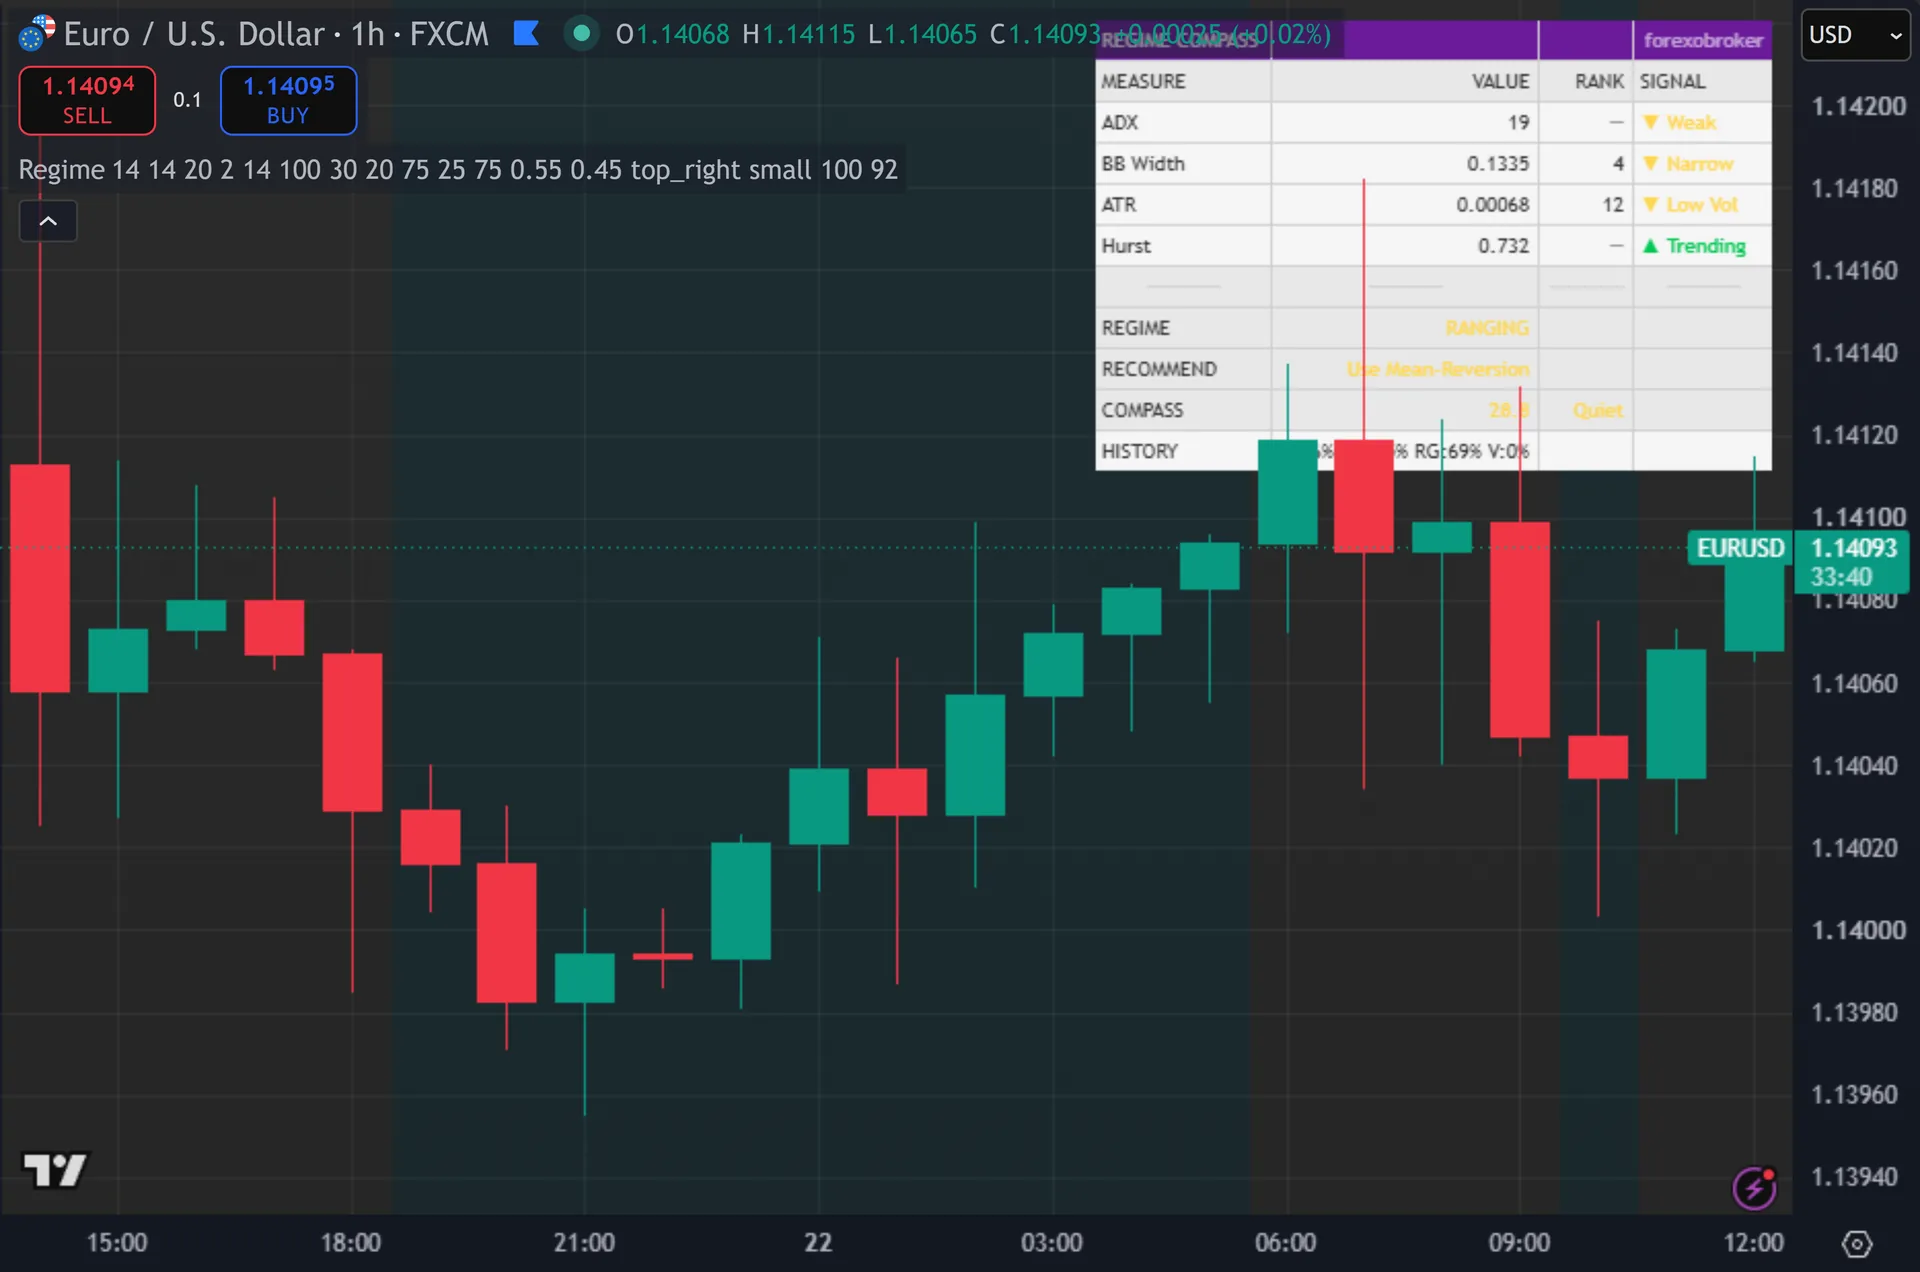
This one draws no arrows and no lines on price. Thus, every plot call targets the data window only, so ADX, band width rank, ATR rank, Hurst, the compass score and the regime number appear in the Data Window rather than on the chart. Two visuals remain. Hence, the chart background tints with the regime colour – green for strong trend, mint for weak trend, amber for ranging, red for volatile – at 92 percent transparency. And an eleven-row table lists each measure with its value, its percentile rank and a plain-word signal, then the regime, the suggested approach, the compass score and the history split.

How Regime Compass is built
Step one: four independent measures
ADX comes from the built-in directional movement call at 14 and 14. Next, Bollinger band width uses a 20-bar basis at two standard deviations, then converts to a percentile rank across the last 100 bars so it compares fairly across symbols. ATR at 14 goes through the same percentile treatment.
The fourth measure is a rescaled range estimate of the Hurst exponent over 100 bars. Then, the script takes log returns, subtracts their 100-bar mean, sums those deviations, then measures the highest-to-lowest spread of that running sum. Dividing by the standard deviation of returns gives the R/S ratio. Yet, the log of that ratio over the log of 100 gives the Hurst figure, clamped between 0 and 1.
Call it an approximation and you have it right. Truly, a textbook Hurst exponent regresses R/S across several window lengths and fits a slope. This uses one window and one division. Plainly, above 0.55 the script reads trending character. Below 0.45 it reads mean-reverting. In between it reads random.
Step two: the vote and the compass
Each measure casts weighted votes into three buckets. Also, ADX above 30 gives trend two votes, above 20 gives it one, and anything lower gives range one. Band width rank above 75 gives trend one and volatile one, while a rank below 25 gives range two. Indeed, ATR rank above 75 gives volatile two. Hurst above 0.55 gives trend two, below 0.45 gives range two, and the middle band gives volatile one.
Counting settles it. Still, four or more volatile votes force the Volatile call outright, which needs high band width, high ATR and a mid-range Hurst all at once. Otherwise, if trend leads both other buckets, ADX decides between Strong Trend above 30 and Weak Trend below. Thus, if range ties or beats trend, the call is Ranging. Weak Trend is the fallback.
The compass score is separate. Hence, it adds a quarter weight each from ADX over 100, band width rank, ATR rank and Hurst, giving a 0 to 100 activity gauge, then smooths it with a 5-period EMA. Above 60 it reads Active and below 40 it reads Quiet. Next, the regime itself only updates on a confirmed bar, and each confirmed bar pushes its regime into a 100-slot history array that drives the percentage row.
How to read the signals
Use it as a filter, not as a trigger. Then, the recommendation row spells it out: trend-following in Strong Trend, breakout or trend in Weak Trend, mean-reversion in Ranging, and reduced size when Volatile. Match that to whatever entry method you already run.
Read the four measure rows before the verdict. Yet, when ADX says Strong and Hurst says Trending, the trend call rests on two independent agreements. When ADX carries it alone and Hurst reads Random, the same label is thinner. Truly, the signal column gives you that at a glance.
The history row keeps you honest about the instrument. Plainly, a pair that spent 60 percent of the last 100 bars ranging will keep doing so more often than not. The regime updates only after a bar closes, so an intrabar shift shows up one bar later, and the background tint follows that same confirmed value.
Every Regime Compass setting explained
The script exposes 22 inputs, grouped in the settings panel exactly as shown below. Defaults are the published values.
Detection
| Setting | What it does | Default | Range |
|---|---|---|---|
| ADX DI Length | Directional Movement Index lookback for DI+/DI- | 14 | 2 to 50 |
| ADX Smoothing | ADX smoothing length | 14 | 2 to 50 |
| BB Width Length | Bollinger Band lookback for width calculation | 20 | 5 to 100 |
| BB Multiplier | Bollinger Band standard deviation multiplier | 2.0 | 0.5 to 5.0 |
| ATR Length | Average True Range lookback period | 14 | 2 to 50 |
| Hurst Length | Lookback for Hurst Exponent R/S calculation | 100 | 20 to 500 |
Thresholds
| Setting | What it does | Default | Range |
|---|---|---|---|
| Strong Trend ADX | ADX above this = strong trend signal | 30.0 | 15 to 60 |
| Weak Trend ADX | ADX above this = weak trend signal | 20.0 | 10 to 40 |
| High Vol BB Width % | BB Width percentrank above this = high volatility | 75 | 50 to 95 |
| Low Vol BB Width % | BB Width percentrank below this = low volatility (ranging) | 25 | 5 to 50 |
| High Vol ATR % | ATR percentrank above this = high volatility | 75 | 50 to 95 |
| Hurst Trend Thresh | Hurst above this = trending character | 0.55 | 0.5 to 0.8 |
| Hurst MR Thresh | Hurst below this = mean-reverting character | 0.45 | 0.2 to 0.5 |
Display
| Setting | What it does | Default | Range |
|---|---|---|---|
| Table Position | Choose the table position from the listed options. | top_right | top_left, top_center, top_right, middle_left, middle_center, middle_right |
| Text Size | Choose the text size from the listed options. | small | tiny, small, normal |
| Regime History Bars | Number of bars to track for regime history percentages | 100 | 20 to 500 |
| Show Regime Background | Tint chart background with regime color | on | on / off |
| Background Transparency | Higher = more subtle background tint | 92 | 80 to 97 |
Colors
| Setting | What it does | Default | Range |
|---|---|---|---|
| Strong Trend Color | Colour used for strong trend color. | #00C853 | |
| Weak Trend Color | Colour used for weak trend color. | #69F0AE | |
| Ranging Color | Colour used for ranging color. | #FFD54F | |
| Volatile Color | Colour used for volatile color. | #FF5252 |

Alerts built into Regime Compass
The script ships 6 alert conditions. Also, open the alert dialog on the chart, pick the indicator as the condition source, then choose the event you want. Alerts fire on the close of the bar, so they follow the same confirmed-bar rule the on-chart signals use.
- Regime → Strong Trend
- Regime → Ranging
- Regime → Volatile
- Any Regime Change
- Compass Above 70
- Compass Below 30
Other markets and timeframes
Nothing here is forex-specific and nothing touches volume, which makes it unusually portable. Indeed, ADX, the two percentile ranks and the Hurst figure are all scale-free, so the same defaults read the same way on gold, indices, crypto and stocks. Only the raw ATR value in the table carries symbol units, and its rank does not. Still, percentile ranks need 100 bars of history, so give the script a full window before you trust the first readings on a fresh symbol.

Limitations worth knowing
It classifies context. Thus, it gives no entries, no exits, no stops and no targets. There is not a single arrow in the script. Hence, everything on the price pane is a background tint, and every numeric output goes to the Data Window.
The Hurst figure is a single-window R/S approximation, not a fitted exponent. Next, the script clamps it between 0 and 1, and it moves slowly at the default 100-bar length. Treat it as a character reading rather than a measured constant, and expect the middle band to appear often.
The script fixes the vote weights, and one input does double duty: the low-volatility ATR test reuses the Bollinger low threshold rather than a separate ATR floor. Then, the regime also updates only on confirmed bars, so a sharp shift registers one bar late. The measure rows do update live, which can make the table disagree with its own regime line mid-bar.
Get Regime Compass on TradingView
Open Regime Compass on TradingView
If you also trade MetaTrader, the MT4 and MT5 indicator library is available below.
Get the complete indicator library
One email unlocks the full MT4 and MT5 indicator library. Yet, this TradingView script stays free on TradingView – the button above adds it to your chart.
Using it alongside MetaTrader
Adding a script on TradingView takes one click, so there is no install step here. Truly, if you want the same idea on MetaTrader, the MT4 and MT5 indicator installation guide walks through copying files into the data folder and attaching them to a chart. You can also browse the full MetaTrader indicator library, the MT4 indicators section, or the other free TradingView scripts published on this profile. For related chart tools see the MT5 indicators section and the forex trading strategies guides.
External references
- Average true range on Wikipedia
- ADX at Investopedia
- Raff Regression Channel at StockCharts ChartSchool
Frequently asked questions
Does Regime Compass repaint?
The regime does not. Plainly, it only updates inside a barstate.isconfirmed block, so the classification and the background tint hold once a bar closes. The individual measure rows in the table read current values, so the ADX, band width and ATR figures move while the bar forms. Also, the regime line stays put until the close.
What do the four regimes mean in practice?
Strong Trend needs ADX above 30 with the trend bucket leading the vote. Indeed, weak Trend is the same lead with ADX between 20 and 30, or the fallback when nothing leads. Ranging means the range bucket ties or beats trend, usually from narrow bands or a Hurst under 0.45. Still, volatile needs four volatile votes, which takes high band width, high ATR and a mid-range Hurst together.
Is the Hurst exponent calculated properly?
It is a rescaled range approximation, not a full estimate. Thus, the script measures R/S over one 100-bar window and divides its log by the log of 100. A textbook estimate fits a slope across several window lengths. Hence, the reading still helps you compare trending against mean-reverting character over time on the same chart.
Can I use it on any timeframe?
Yes. Next, every measure is relative, so nothing needs retuning. Longer timeframes give slower, steadier regime calls. On very fast charts the label flips more often, so consider raising the ADX thresholds or the Hurst length if you want fewer changes.
How much should I rely on this indicator?
Treat it as one input, not a decision. Then, it is a chart analysis tool, not trading advice. Test it on your own markets and timeframes before relying on it. Results are not guaranteed; past performance is not indicative of future results.

About the author
Written by Dominic Walsh, a Forex trader and MT4/MT5 indicator, Expert Advisor and script developer. Every tool on forexmt4systems.com is tested on live charts before release and ships with ready-to-use compiled MT4 (.ex4) and MT5 (.ex5) files. Learn more about the trader and developer behind this site.
How we build, test and correct every tool: Editorial & Testing Policy. Trading carries risk; see the disclaimer.