
Raw volume tells you little on its own. Also, relative Volume Heat, a relative volume indicator TradingView traders can add to any symbol with a volume feed, divides each bar’s volume by its own 20-bar average. It then z-scores that ratio over 50 bars. Indeed, a z of 1.0 or more marks a HOT regime. Entries only fire while the tape runs hot, which keeps marks out of dead sessions.
It is free and open source. Still, you can add it to any chart from the Relative Volume Heat script page on TradingView, and the full Pine source is published there for you to read.
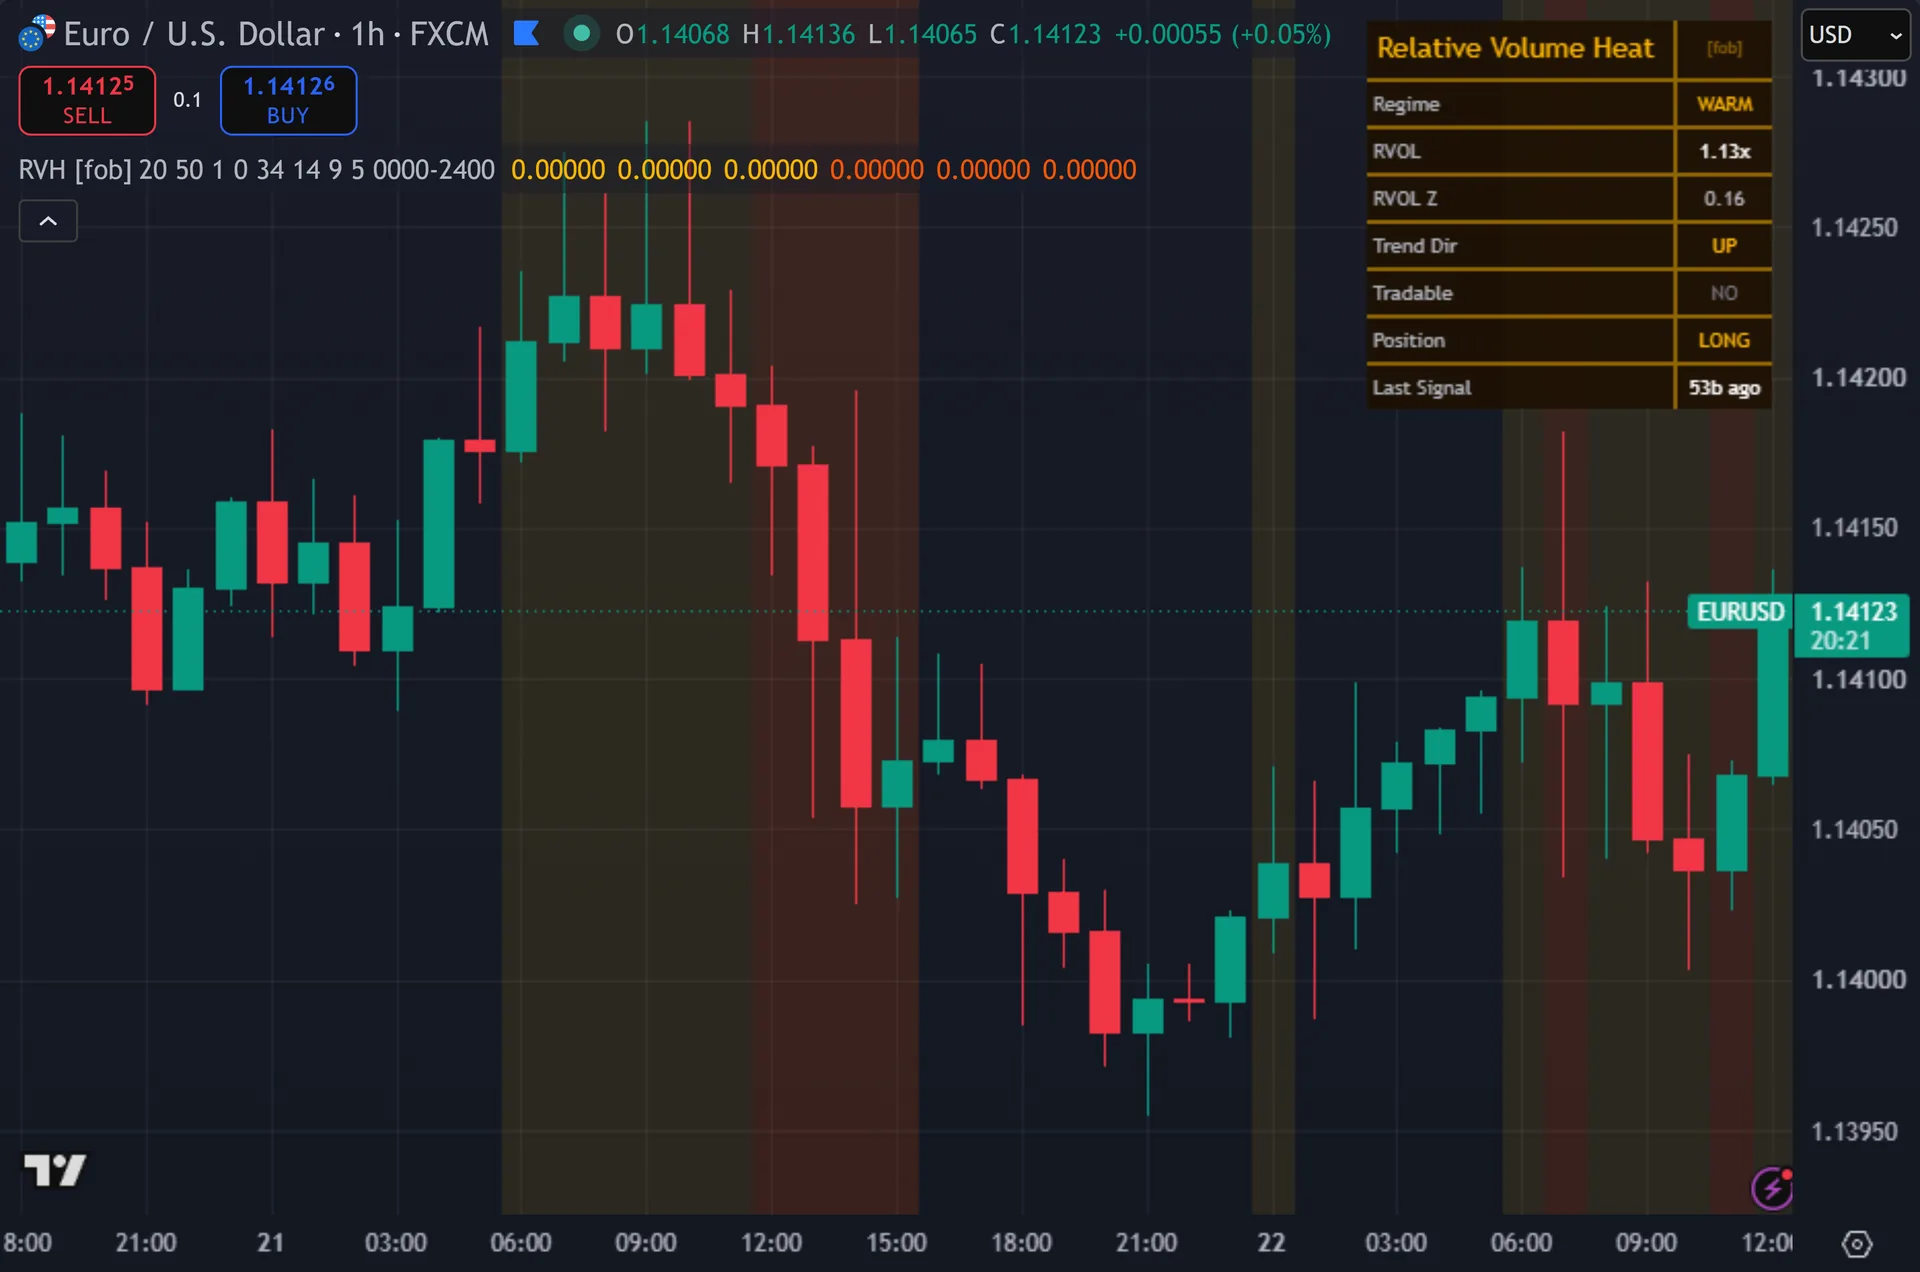
What Relative Volume Heat plots on the price chart
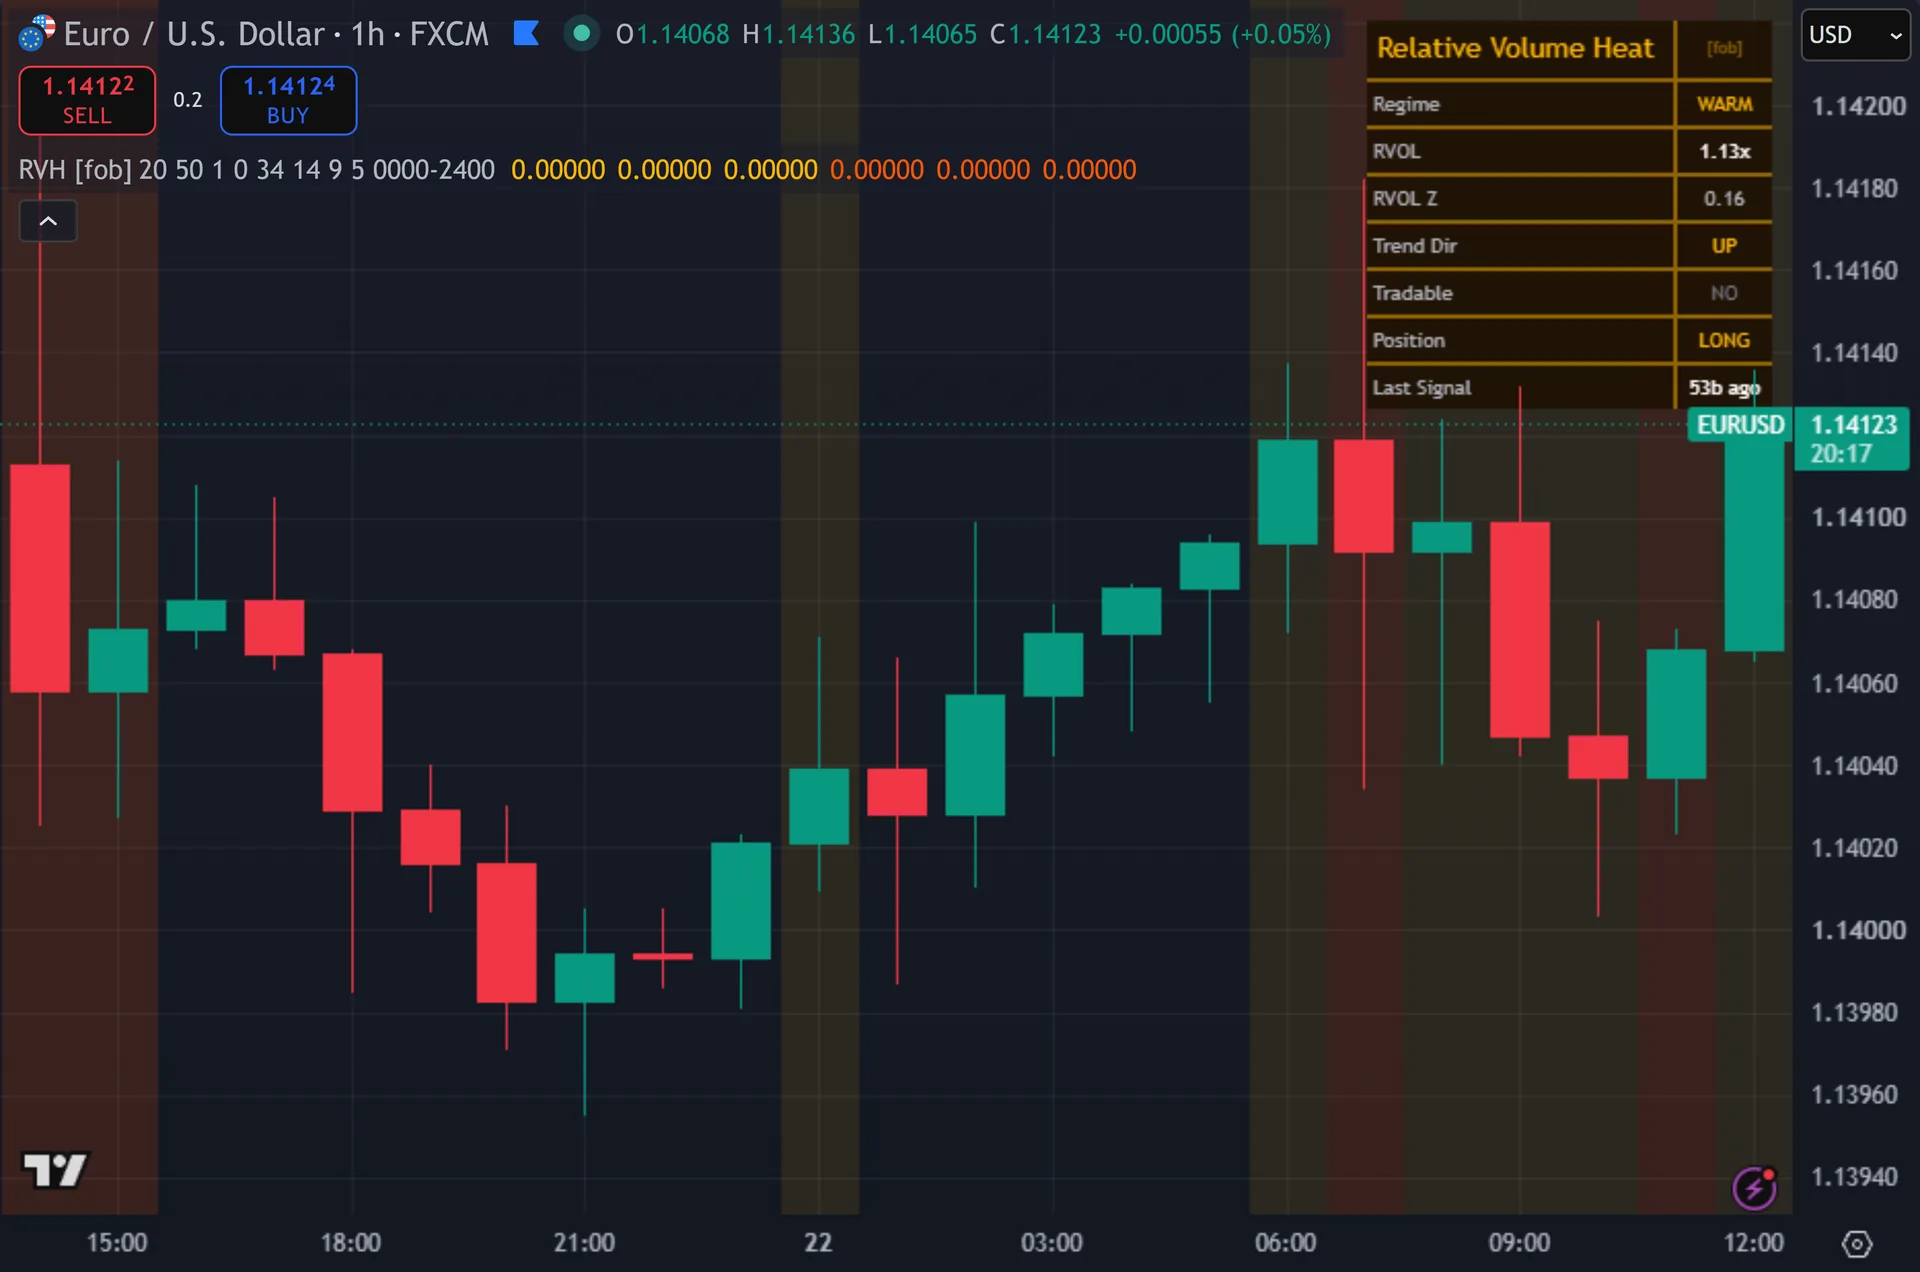
This one tints the background rather than drawing a line. Thus, a hot regime paints a warm orange wash. A warm regime paints a lighter amber. Cold bars stay clear. Buy signals print an amber triangle under the bar, sell signals an orange triangle above it, both labelled RVH and both backed by two faded glow layers. The signal bar itself recolours. An eight-row dashboard reports the regime word, the raw RVOL multiple, the z-score, trend direction, whether the regime is tradable, current position and bars since the last signal.
How Relative Volume Heat is built
From raw volume to a regime word
First the script builds a ratio. Hence, it takes a 20-bar simple average of volume and divides the current bar’s volume by it. A reading of 2.00x means this bar traded twice its recent norm. That ratio drifts, though. Quiet hours push it down and news pushes it up, so a fixed cutoff would not hold across a full day.
So the ratio gets standardised. Next, the script takes a 50-bar mean and a 50-bar standard deviation of the ratio, then converts the current value to a z-score. That answers a sharper question. How unusual is this participation against the last 50 bars? Three regimes follow. Then, a z of 1.0 or more reads HOT. A z from 0.0 up to 1.0 reads WARM. Yet, anything under 0.0 reads COLD. Both thresholds sit in the inputs.
The Trade Only When Hot switch decides which regimes arm the signals. Left on, only HOT counts. Turned off, WARM passes too, which roughly doubles the number of tradable bars.
Direction and timing
Participation says when, not which way. Truly, direction comes from a 34-period EMA. A close above it reads up and a close below reads down. Plainly, that single test fixes the only side the script will take while the regime stays armed.
Timing comes from a faster 9-period EMA. Also, a long needs a close crossing above that EMA while the 34 EMA already reads up and the regime is tradable. A short needs the mirror image. Indeed, so the script waits for a pullback and reclaim inside busy tape rather than chasing the first hot bar.
Three more gates apply. Still, the bar must close, so nothing flashes mid-candle. Five bars must have passed since the last mark. Thus, and the script alternates direction, so it never prints two buys in a row. An optional session window can restrict everything to set hours, though it covers the full day by default.
How to read the signals
Read the background first. Hence, orange means the market trades well above its own norm, so moves carry participation behind them. A clear background means quiet tape and the script will not arm at all. Next, that is by design, not a fault.
Then read the RVOL and RVOL Z rows together. Then, RVOL gives the plain multiple, such as 2.4x. The z-score tells you whether 2.4x counts as rare for this symbol and timeframe. Yet, a 2.4x bar on an instrument that regularly prints 3x is not the same event.
Triangles land at the open of the following candle, because the script waits for the close. Truly, use the Tradable and Trend Dir rows to see why a setup did or did not fire. A NO in Tradable means the regime cooled before the EMA cross arrived.
Every Relative Volume Heat setting explained
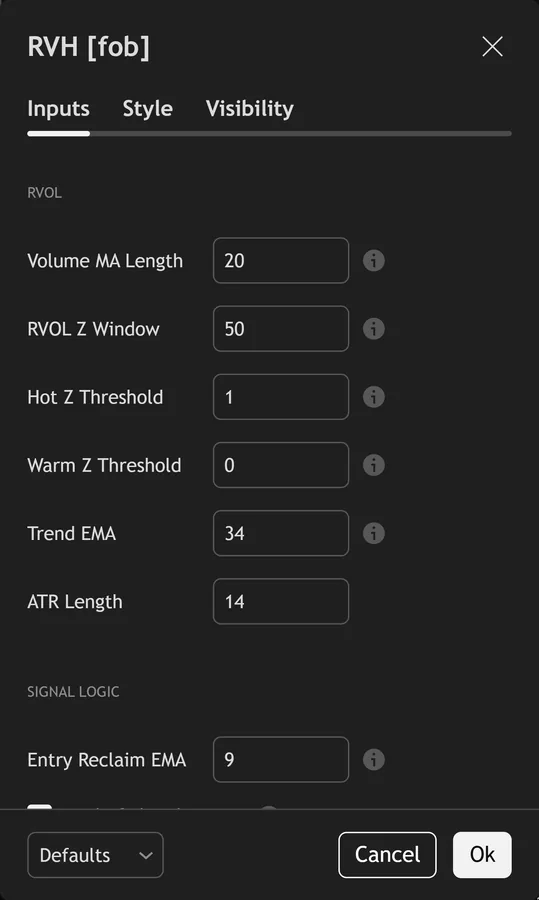
The script exposes 17 inputs, grouped in the settings panel exactly as shown below. Defaults are the published values.
RVOL
| Setting | What it does | Default | Range |
|---|---|---|---|
| Volume MA Length | Baseline for the relative-volume ratio. | 20 | 5 to 100 |
| RVOL Z Window | Window the RVOL ratio is z-scored over. | 50 | 10 to 200 |
| Hot Z Threshold | RVOL z-score above this = HOT regime (trading enabled). | 1.0 | 0.0 to 4.0 |
| Warm Z Threshold | Z above this but below Hot = WARM. | 0.0 | -2.0 to 2.0 |
| Trend EMA | Defines directional bias inside a hot regime. | 34 | 5 to 200 |
| ATR Length | Sets the atr length used in the calculation. | 14 | 5 to 50 |
Signal Logic
| Setting | What it does | Default | Range |
|---|---|---|---|
| Entry Reclaim EMA | Close-cross of this EMA in the trend direction times the entry while HOT. | 9 | 2 to 50 |
| Trade Only When Hot | On = require HOT regime; Off = also allow WARM. | on | on / off |
| Cooldown Bars | Sets the cooldown bars used in the calculation. | 5 | 1 to 40 |
Filters
| Setting | What it does | Default | Range |
|---|---|---|---|
| Restrict to Session | Toggles restrict to session on the chart. | off | on / off |
| Session Window | Controls session window. | 0000-2400 |
Visual
| Setting | What it does | Default | Range |
|---|---|---|---|
| Show Dashboard | Toggles show dashboard on the chart. | on | on / off |
| Show 3-Layer Glow | Toggles show 3-layer glow on the chart. | on | on / off |
| Show Heat Background | Toggles show heat background on the chart. | on | on / off |
| Buy Color | Colour used for buy color. | #ffb703 | |
| Sell Color | Colour used for sell color. | #fb5607 | |
| Dashboard BG | Colour used for dashboard bg. | color.new(#1d0f00, 14) |
Alerts built into Relative Volume Heat
The script ships 15 alert conditions. Plainly, open the alert dialog on the chart, pick the indicator as the condition source, then choose the event you want. Alerts fire on the close of the bar, so they follow the same confirmed-bar rule the on-chart signals use.
- RVH Buy
- RVH Sell
- RVH Any Signal
- RVH Hot On
- RVH Hot Off
- RVH Warm
- RVH Cold
- RVH EMA Up
- RVH EMA Down
- RVH Trend Cross
- RVH Hot Now
- RVH Armed
Other markets and timeframes
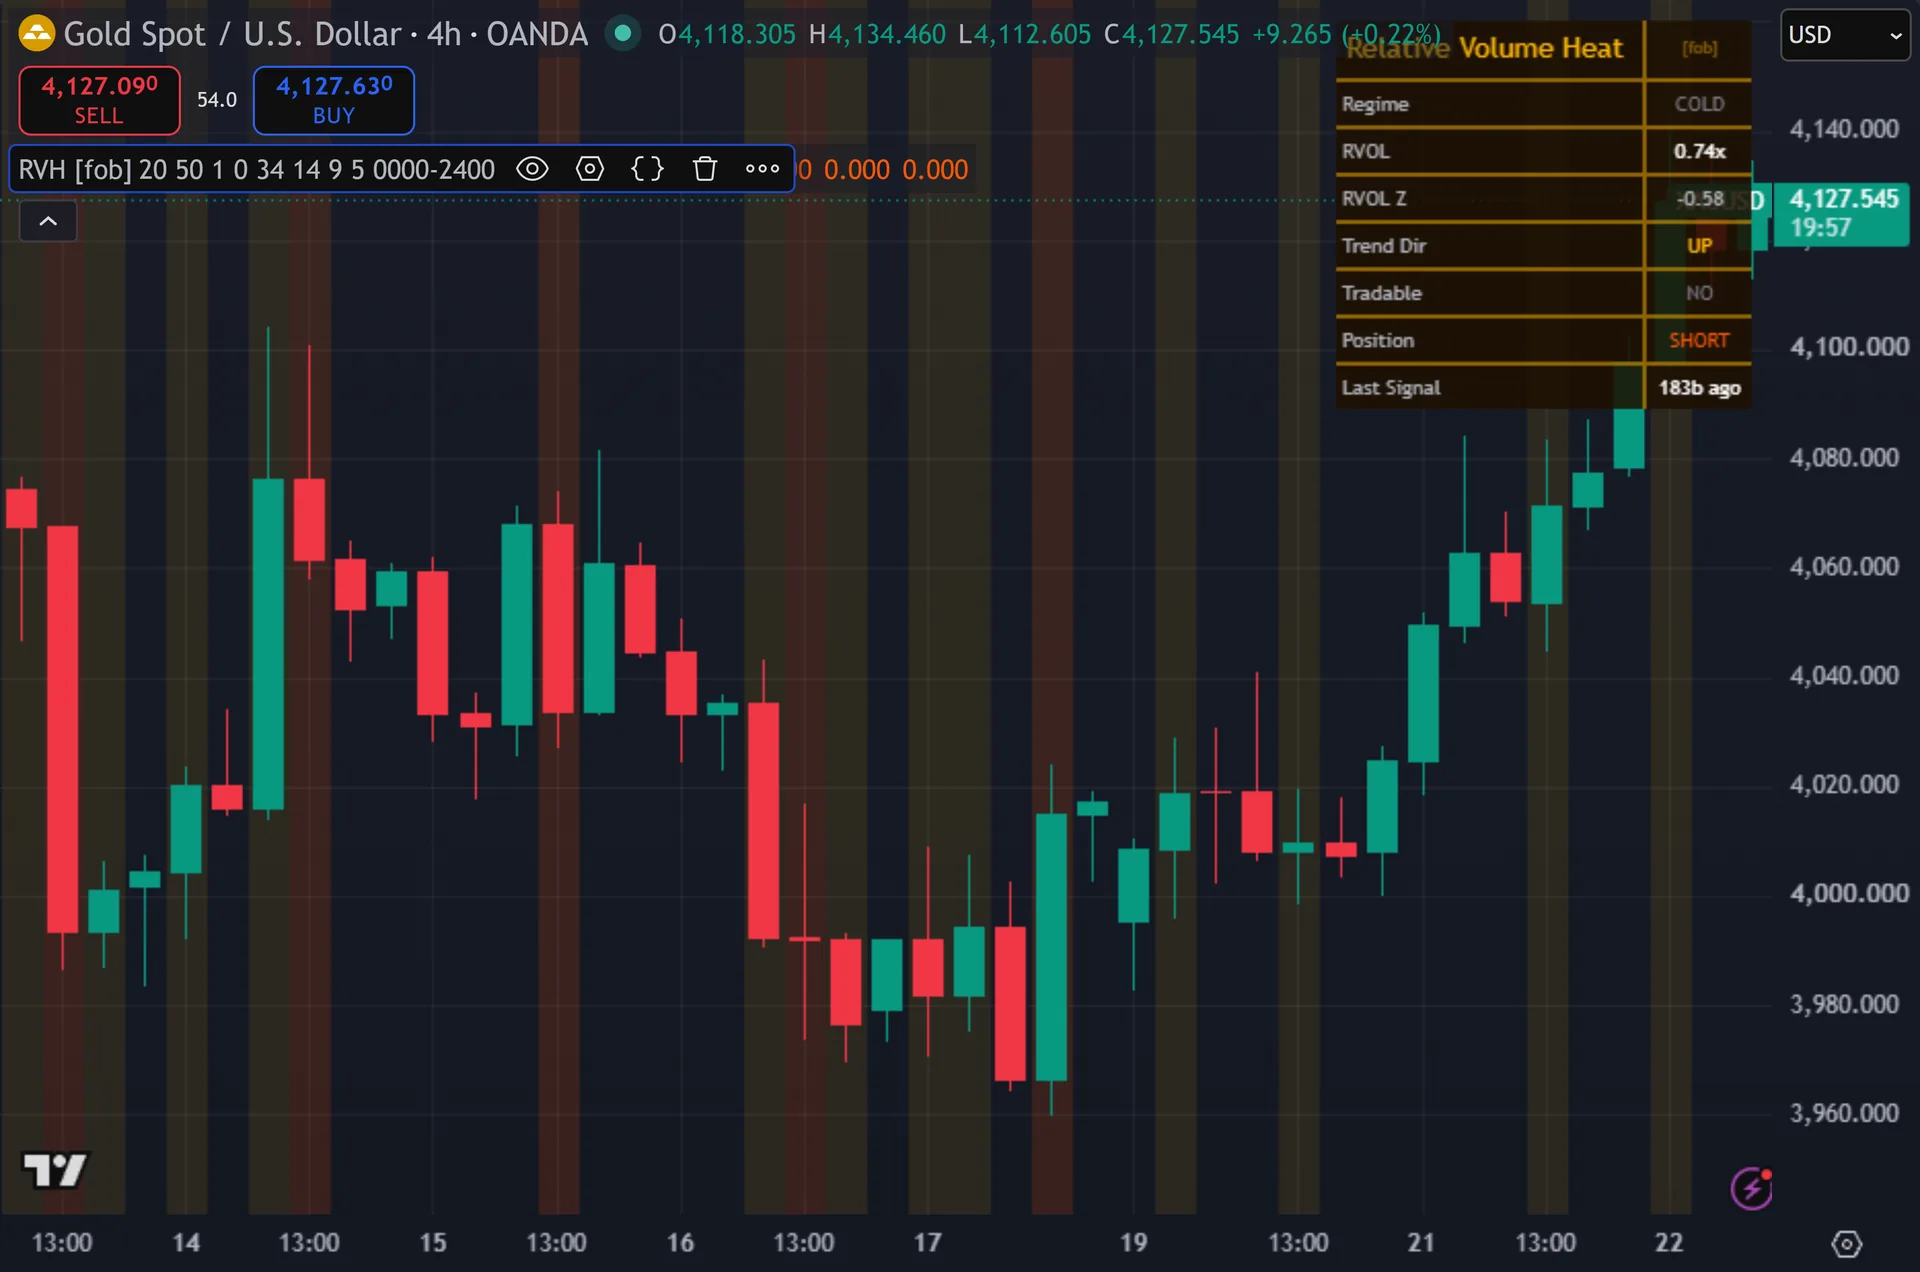
The maths stays relative throughout. Also, volume divides by its own average, and that ratio z-scores against its own recent history, so nothing is tuned to one instrument. The same defaults run on indices, crypto and stocks. Indeed, the catch sits in the feed, not the formula. Spot forex volume comes from your broker’s tick count rather than a central exchange, so the ratio measures activity at that broker. On symbols with no volume data the script never arms.
Limitations worth knowing
This is a filter plus a trigger, nothing more. Still, it sets no stop, no target and no size. A hot regime tells you that people are trading. Thus, it does not tell you the move continues.
The whole tool rests on the volume feed. Hence, Forex tick volume is a proxy and it varies between brokers, so the same pair on two feeds can produce different z-scores. Futures and crypto volume stays more consistent. Next, thin symbols with sparse volume give a noisy standard deviation and unstable regimes.
The ATR Length input appears in the settings, but no part of the signal path uses the ATR value in this build. Then, changing it will not alter your marks. The regime can also cool between the trend read and the EMA reclaim, so obvious pullbacks in busy tape sometimes pass without a triangle.
Get Relative Volume Heat on TradingView
Open Relative Volume Heat on TradingView
If you also trade MetaTrader, the MT4 and MT5 indicator library is available below.
Get the complete indicator library
One email unlocks the full MT4 and MT5 indicator library. Yet, this TradingView script stays free on TradingView – the button above adds it to your chart.
Using it alongside MetaTrader
Adding a script on TradingView takes one click, so there is no install step here. Truly, if you want the same idea on MetaTrader, the MT4 and MT5 indicator installation guide walks through copying files into the data folder and attaching them to a chart. You can also browse the full MetaTrader indicator library, the MT4 indicators section, or the other free TradingView scripts published on this profile. For related chart tools see the MT5 indicators section and the forex trading strategies guides.
External references
- Money flow index on Wikipedia
- On-Balance Volume at Investopedia
- CandleVolume at StockCharts ChartSchool
Frequently asked questions
Does Relative Volume Heat repaint?
No. Plainly, both signals gate on barstate.isconfirmed, and the plotshape calls use the same gated variables, so triangles print only after the bar closes. The background tint does update live, since the regime recalculates on every tick until that bar finishes.
What counts as a hot regime?
A z-score of 1.0 or higher on the relative volume ratio, measured over the last 50 bars. Also, that is roughly a one standard deviation surge in participation. Lower the Hot Z Threshold for more signals or raise it toward 2.0 for fewer.
Does it work on forex?
Yes, with one caveat. Indeed, spot forex has no central volume, so your platform reports tick volume from the broker feed. That still tracks activity well enough for a relative measure, but the absolute numbers mean less than they do on futures or crypto.
Why did a huge volume bar produce no signal?
Volume arms the script, it does not fire it. Still, you also need the close on the correct side of the 34 EMA and a fresh cross of the 9 EMA in that direction, with the five-bar cooldown elapsed. The dashboard shows which of those was missing.
How much should I rely on this indicator?
Treat it as one input, not a decision. Thus, it is a chart analysis tool, not trading advice. Test it on your own markets and timeframes before relying on it. Results are not guaranteed; past performance is not indicative of future results.

About the author
Written by Dominic Walsh, a Forex trader and MT4/MT5 indicator, Expert Advisor and script developer. Every tool on forexmt4systems.com is tested on live charts before release and ships with ready-to-use compiled MT4 (.ex4) and MT5 (.ex5) files. Learn more about the trader and developer behind this site.
How we build, test and correct every tool: Editorial & Testing Policy. Trading carries risk; see the disclaimer.