
Session timing drives most intraday currency moves. Also, session Sniper Map is a free forex session indicator TradingView traders can drop on any intraday chart. It boxes the Asian, London, New York AM and New York PM windows in UTC, highlights the London to New York overlap, marks six ICT killzone and Silver Bullet windows, and tracks each session’s range, breakout rate and volume across the last 20 completed sessions.
It is free and open source. Indeed, you can add it to any chart from the Session Sniper Map script page on TradingView, and the full Pine source is published there for you to read.
What Session Sniper Map plots on the price chart
The script draws one shaded box per session and stretches each box to the running high and low. Still, a tiny label tags every box ASIA, LON, NYAM or NYPM. Solid lines mark the session open price. Thus, dotted lines carry the prior session high and low forward. Killzone boxes sit inside the session boxes with a solid border, while Silver Bullet windows use a dashed border. Hence, a seven-column dashboard reports status, live range, average range, breakout percentage, average volume and a volatility rank for all four sessions.
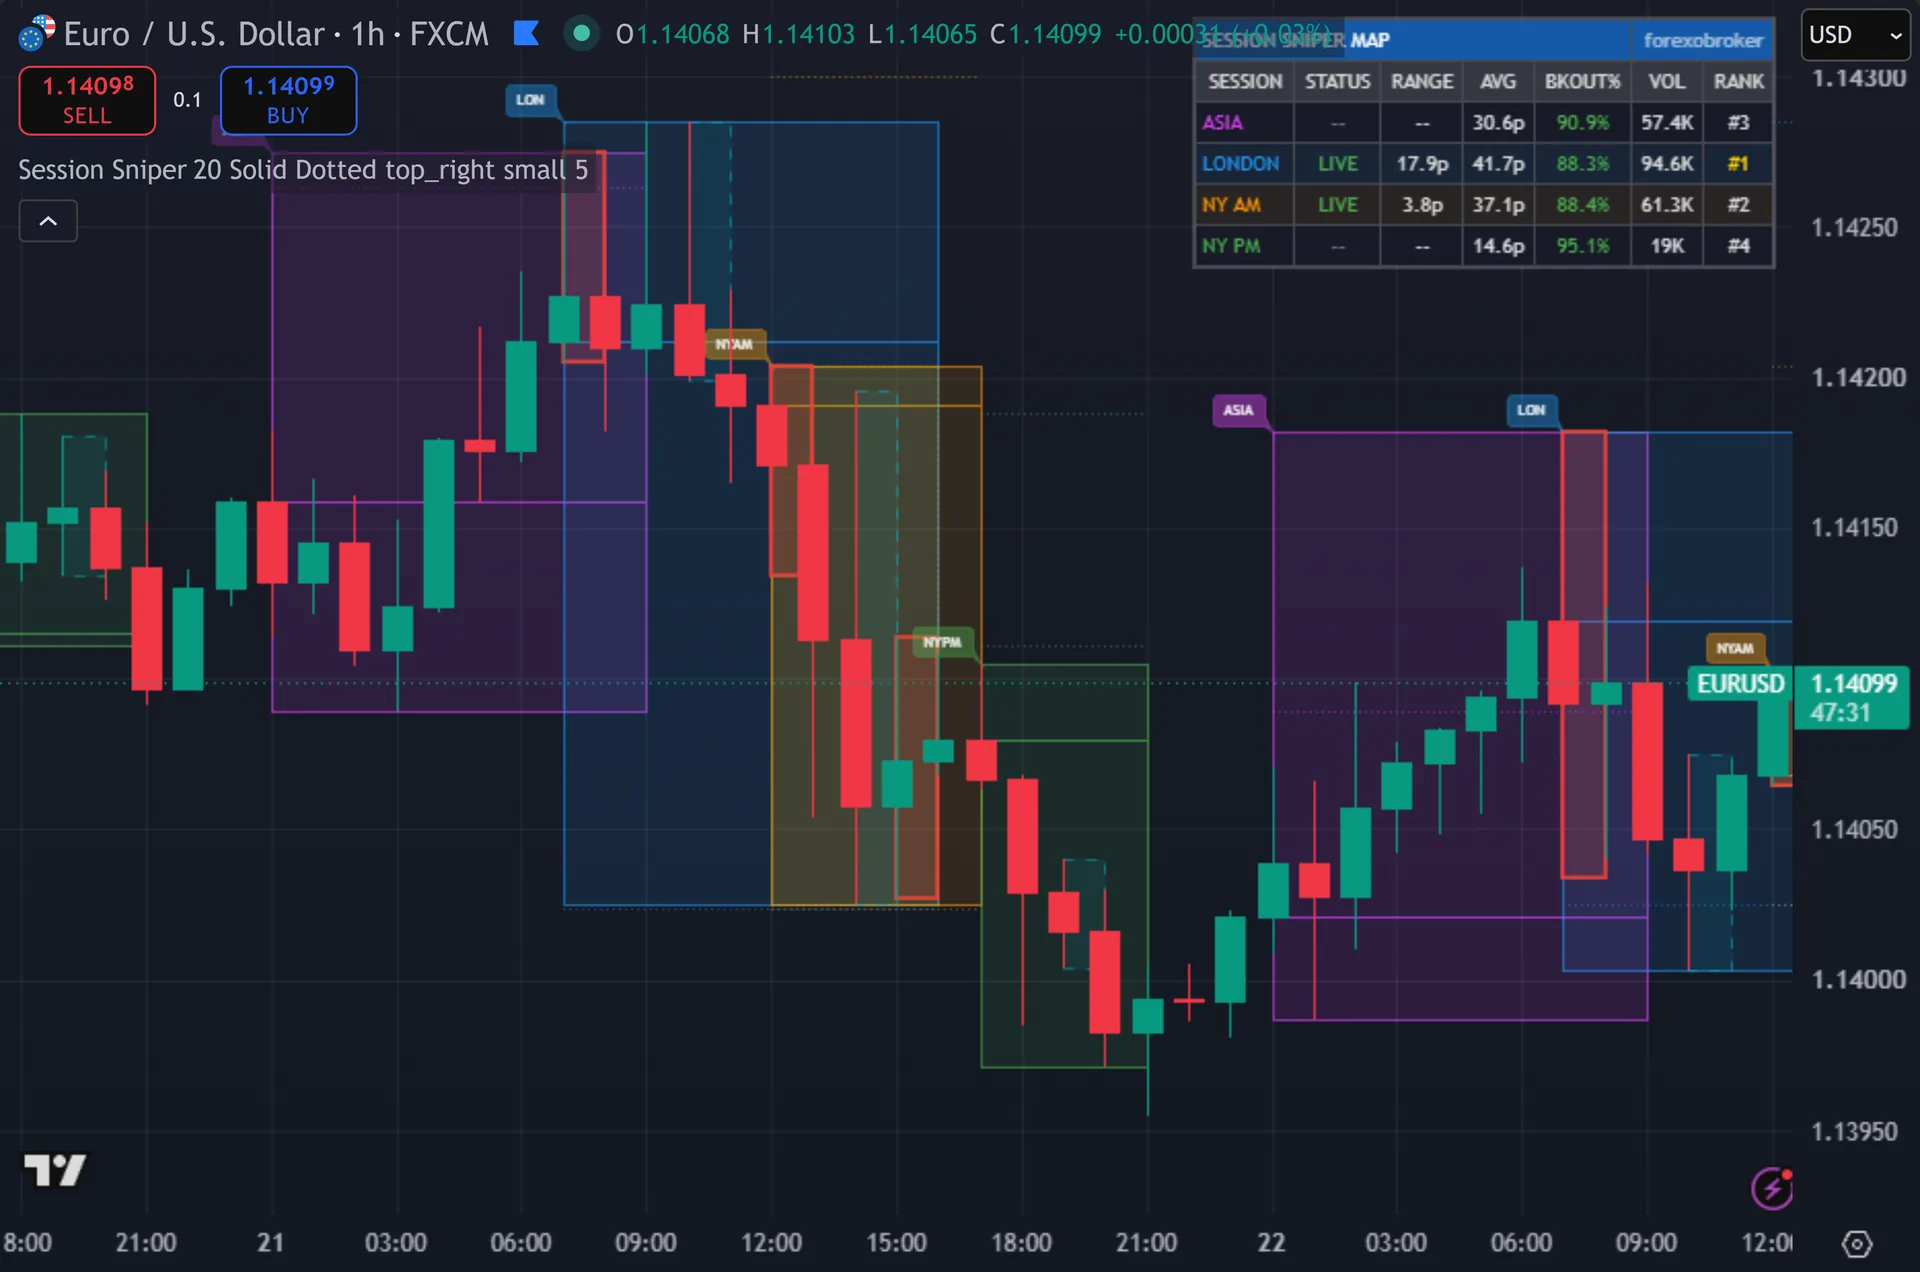
How Session Sniper Map is built
Session windows and killzones
The script maps time, not price. Next, it calls the time function with hard-coded UTC session strings, then checks the result for na. Asian runs 00:00 to 09:00. Then, london runs 07:00 to 16:00. New York AM runs 12:00 to 17:00. Yet, new York PM runs 17:00 to 21:00. Every string ends in 23456, so the windows apply Monday through Friday only. Truly, the overlap block covers 12:00 to 16:00.
Six sub-windows sit inside those blocks. Plainly, the three ICT killzones cover London Open 07:00 to 08:00, New York Open 12:00 to 13:00 and London Close 15:00 to 16:00. The three Silver Bullet windows cover 10:00 to 11:00, 14:00 to 15:00 and 19:00 to 20:00. Also, killzone boxes take a solid two-pixel border. Silver Bullet boxes take a thin dashed border and heavier transparency, so both layers stay readable at once.
All times stay fixed in UTC. Indeed, the script exposes no timezone input, so it never shifts for daylight saving. It also needs an intraday chart. On a daily or higher timeframe every session check fails and the script prints a red warning label instead of boxes.
Statistics and level tracking
Each session object stores its open, high, low, close, cumulative volume and start bar. On the first bar inside a window the script creates the box, the name label and the open line. On every later bar it stretches the box right and pushes the top and bottom out to the running extremes.
When a window ends, the script pushes that session’s range and volume into rolling arrays. Still, history Lookback caps both arrays at 20 entries by default, with a range of 5 to 100. It then compares the finished high and low against the stored prior high and low. Thus, any break of either counts one breakout. The breakout percentage is that count divided by completed sessions.
The dashboard averages both arrays and ranks the four sessions by average range, so rank one marks the widest session on your symbol. Hence, breakout cells turn green above 70 percent and amber above 50. The script keeps five past boxes per session type by default, then deletes the oldest to stay inside the 500-box drawing limit.
How to read the signals
Start with the rank column. Next, it tells you which session has moved your symbol most across the last 20 completed sessions. On most majors London and the New York AM block take ranks one and two. Then, trade the sessions your own chart pays for, not the ones a generic guide names.
Then use the levels. Yet, the prior session high and low ride forward as dotted lines, and the breakout percentage tells you how often that session has taken one of them. A high figure argues for continuation setups. Truly, a low figure argues for fades back into the box.
Boxes grow live. Plainly, the top and bottom track the running high and low, so the box you watch mid-session is not the box you see once it closes. Killzone shading is the exception, since those windows are pure clock time and never move. Also, read the alerts the same way: the prior-level break conditions test the raw bar high and low, so they can fire before a bar closes.
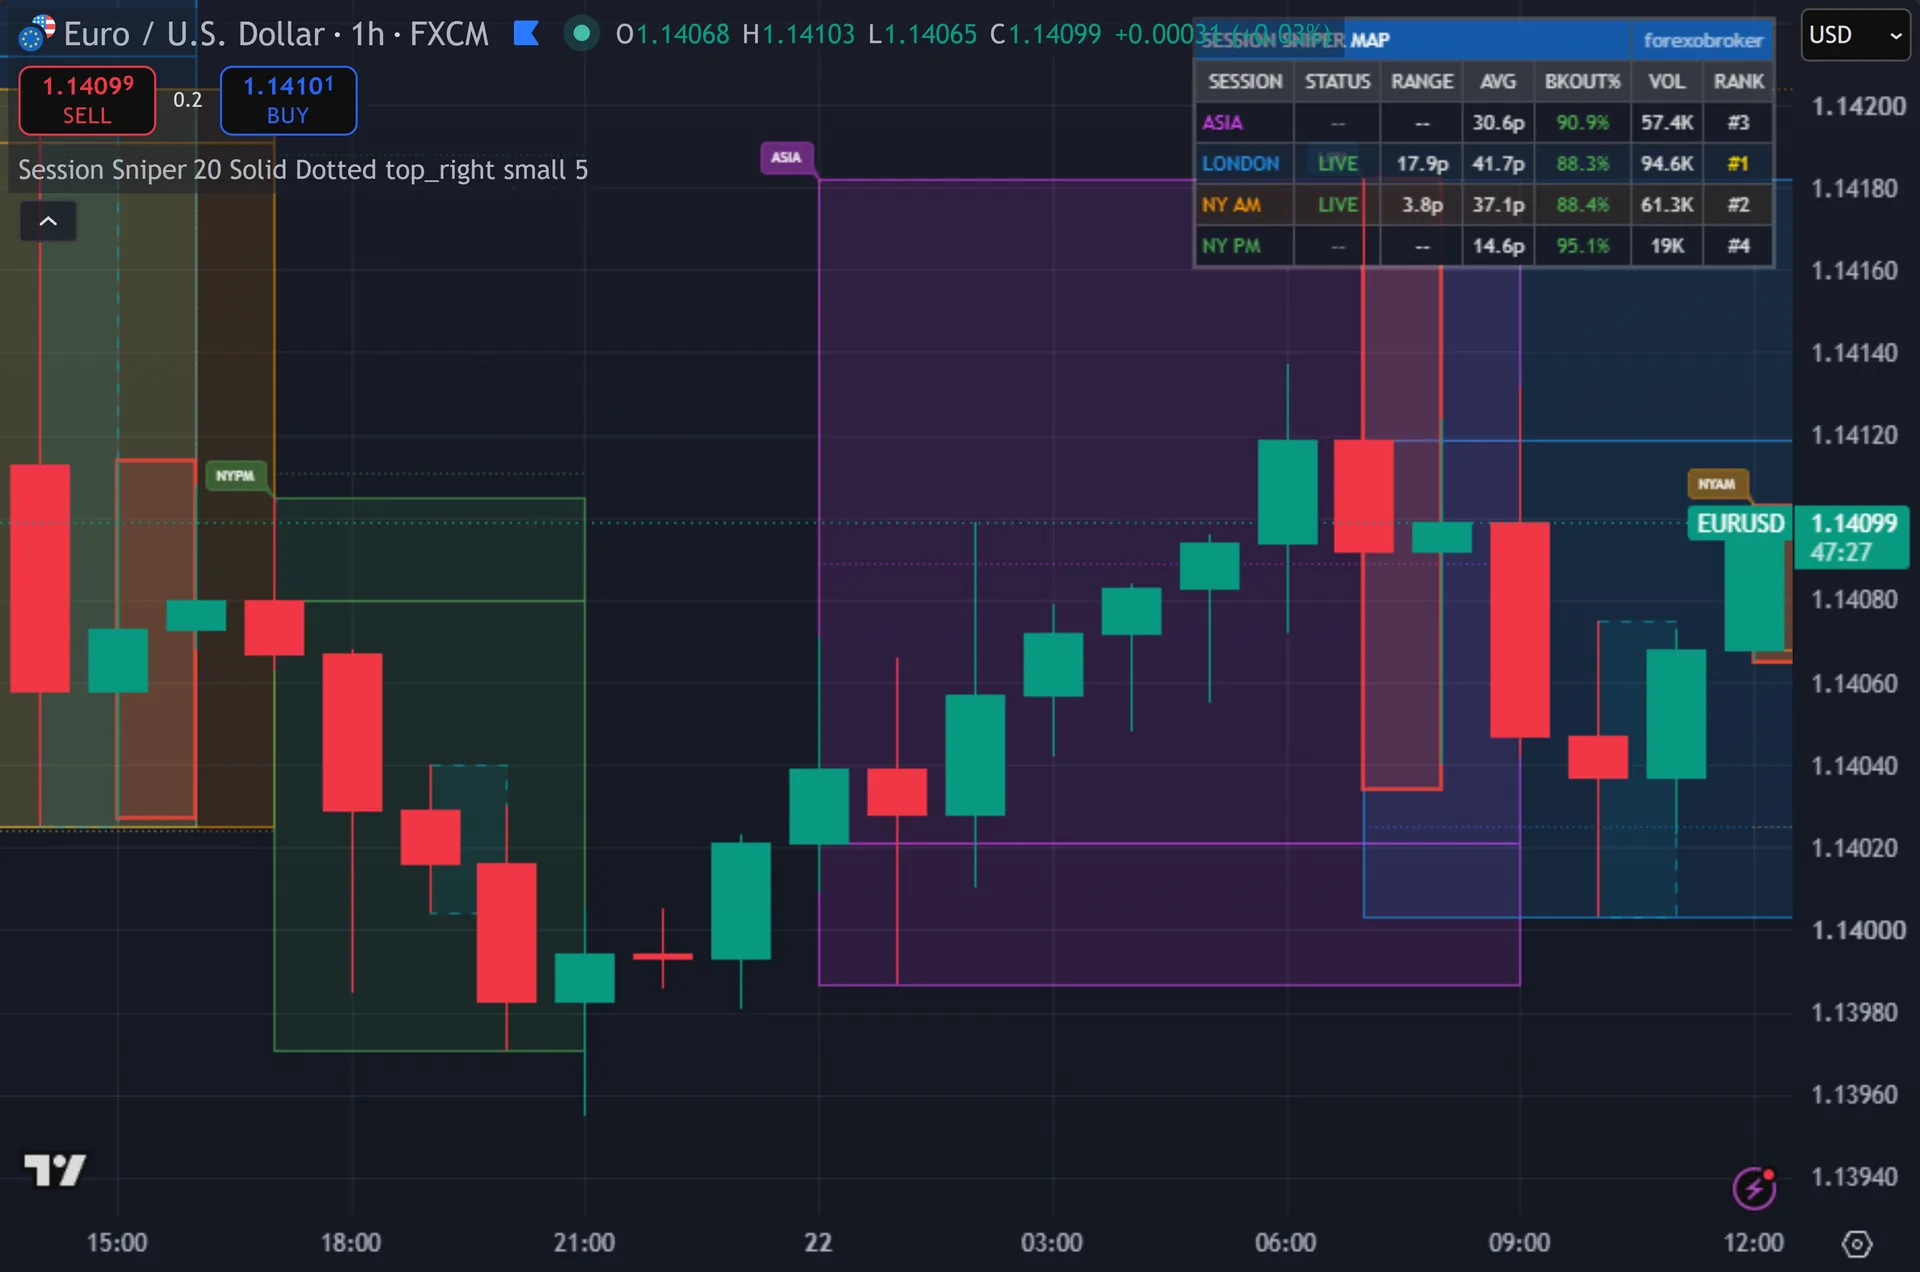
Every Session Sniper Map setting explained
The script exposes 23 inputs, grouped in the settings panel exactly as shown below. Defaults are the published values.
Sessions
| Setting | What it does | Default | Range |
|---|---|---|---|
| Show Asian Session | Display the Asian/Tokyo session box (00:00-09:00 UTC) | on | on / off |
| Show London Session | Display the London session box (07:00-16:00 UTC) | on | on / off |
| Show NY AM Session | Display the New York AM session box (12:00-17:00 UTC) | on | on / off |
| Show NY PM Session | Display the New York PM session box (17:00-21:00 UTC) | on | on / off |
| Show London-NY Overlap | Highlight the London-NY overlap window (12:00-16:00 UTC) | on | on / off |
ICT Killzones
| Setting | What it does | Default | Range |
|---|---|---|---|
| Show Killzones | Display ICT killzone windows: London Open (07-08), NY Open (12-13), London Close (15-16) UTC | on | on / off |
| Show Silver Bullet Windows | Display ICT Silver Bullet time windows: London (10-11), NY AM (14-15), NY PM (19-20) UTC | on | on / off |
Statistics
| Setting | What it does | Default | Range |
|---|---|---|---|
| History Lookback | Number of completed sessions to average for statistics | 20 | 5 to 100 |
| Show Stats Dashboard | Display the per-session statistics table | on | on / off |
Levels
| Setting | What it does | Default | Range |
|---|---|---|---|
| Show Session Open Levels | Draw horizontal lines at each session’s opening price | on | on / off |
| Show Prior Session H/L | Draw dotted lines for the previous session’s high and low | on | on / off |
| Open Line Style | Line style for session open levels | Solid | Solid, Dashed, Dotted |
| Prior Session Line Style | Line style for prior session high/low reference lines | Dotted | Solid, Dashed, Dotted |
Display
| Setting | What it does | Default | Range |
|---|---|---|---|
| Table Position | Choose the table position from the listed options. | top_right | top_left, top_center, top_right, bottom_left, bottom_center, bottom_right |
| Text Size | Choose the text size from the listed options. | small | tiny, small, normal |
| Max Visible Sessions | How many past session boxes to keep visible on the chart per session type | 5 | 1 to 20 |
Colors
| Setting | What it does | Default | Range |
|---|---|---|---|
| Asian Color | Color for Asian/Tokyo session | #E040FB | |
| London Color | Color for London session | #2196F3 | |
| NY AM Color | Color for New York AM session | #FF9800 | |
| NY PM Color | Color for New York PM session | #4CAF50 | |
| Overlap Color | Color for London-NY overlap highlight | #FFD600 | |
| Killzone Color | Color for ICT killzone windows | #F44336 | |
| Silver Bullet Color | Color for ICT Silver Bullet windows | #00BCD4 |
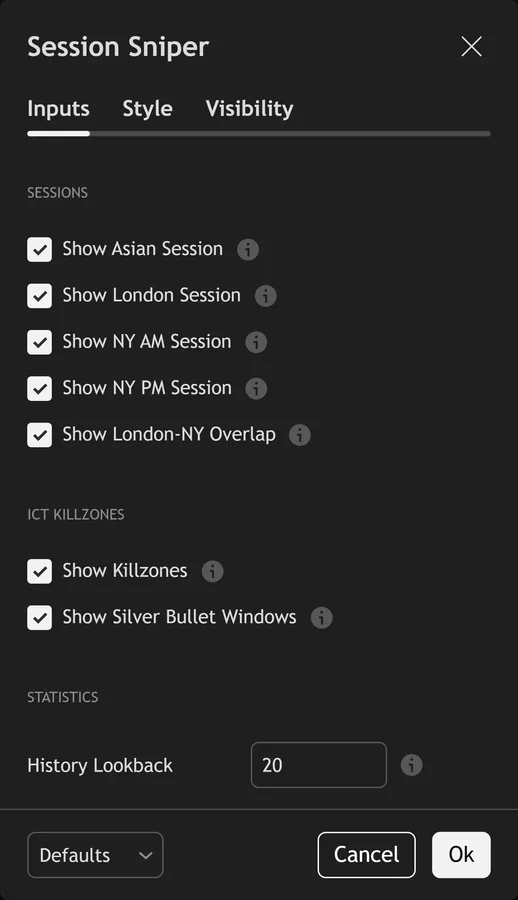
Alerts built into Session Sniper Map
The script ships 8 alert conditions. Indeed, open the alert dialog on the chart, pick the indicator as the condition source, then choose the event you want. Alerts fire on the close of the bar, so they follow the same confirmed-bar rule the on-chart signals use.
- London Killzone Open
- NY Killzone Open
- London Close Killzone
- Any Killzone Open
- Session Open Break
- Prior Session High Break
- Prior Session Low Break
- Any Session Level Break
Other markets and timeframes
Sessions are absolute clock windows, so this tool is not market-agnostic. Still, the four blocks describe the currency day. They also line up well with gold, indices and crude oil, which trade the same London and New York liquidity. Thus, crypto runs around the clock and ignores the Monday to Friday filter, so boxes simply gap over weekends. Range and volume statistics stay symbol-relative and work anywhere. Hence, the killzone windows carry meaning only where you accept the ICT session framework.
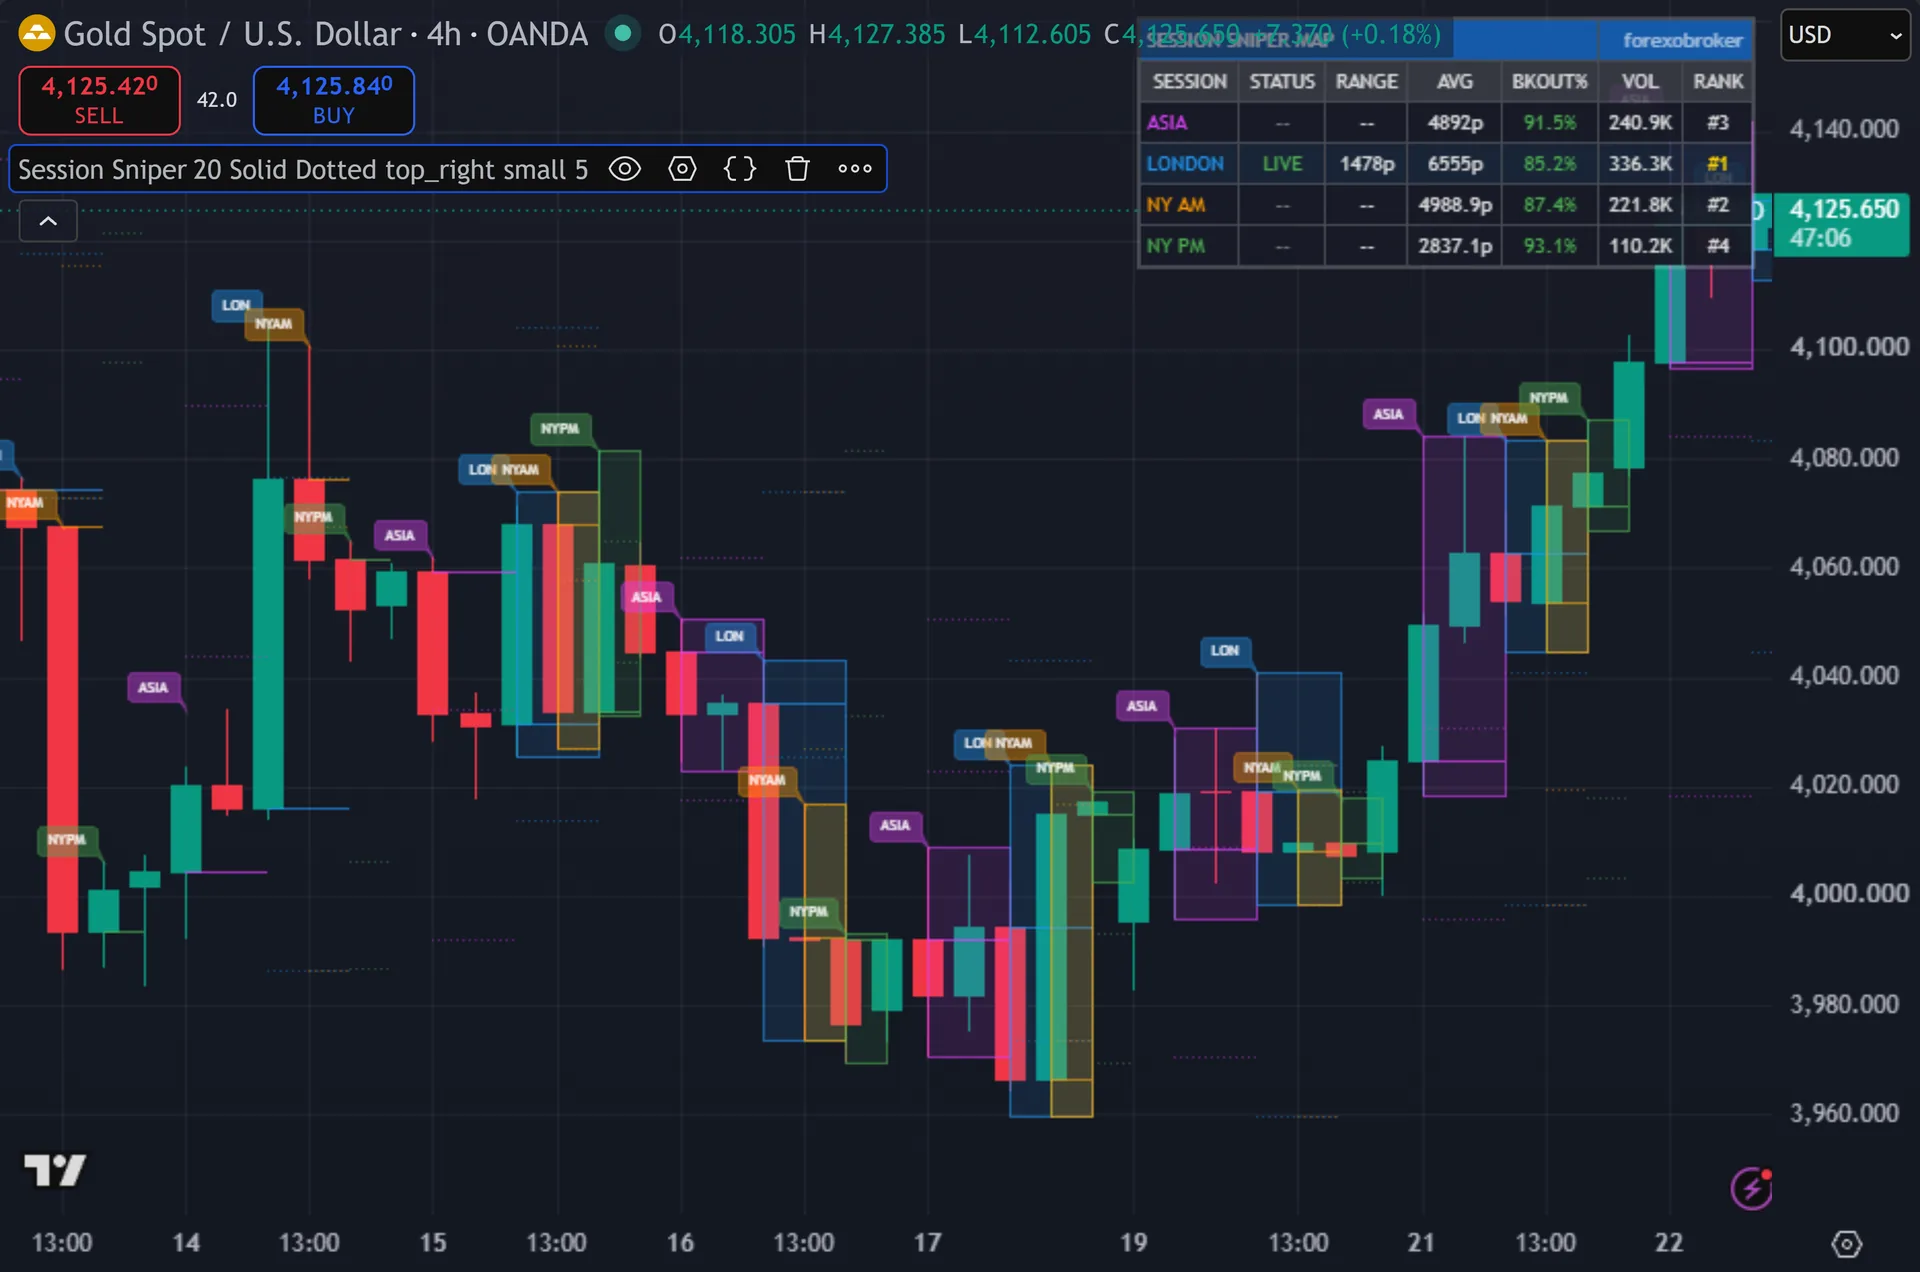
Limitations worth knowing
The tool maps time and prints statistics. It gives no directional call. There is no arrow, no bias and no entry logic. Next, the breakout percentage is a descriptive count over the last 20 sessions, not a forecast of the next one.
Times are hard-coded in UTC with no timezone input. Then, daylight saving in London and New York shifts local exchange hours by an hour twice a year, and these boxes do not follow. Check the offset yourself each March and again in the autumn.
The volume column reads whatever the feed supplies. Yet, spot forex volume comes from broker tick counts rather than an exchange, so treat it as relative activity between sessions on one broker’s data. The script also needs an intraday timeframe. On daily charts it draws nothing but a warning.
Get Session Sniper Map on TradingView
Open Session Sniper Map on TradingView
If you also trade MetaTrader, the MT4 and MT5 indicator library is available below.
Get the complete indicator library
One email unlocks the full MT4 and MT5 indicator library. Truly, this TradingView script stays free on TradingView – the button above adds it to your chart.
Using it alongside MetaTrader
Adding a script on TradingView takes one click, so there is no install step here. Plainly, if you want the same idea on MetaTrader, the MT4 and MT5 indicator installation guide walks through copying files into the data folder and attaching them to a chart. You can also browse the full MetaTrader indicator library, the MT4 indicators section, or the other free TradingView scripts published on this profile. For related chart tools see the MT5 indicators section and the forex trading strategies guides.
External references
- Price action trading on Wikipedia
- Forex at Investopedia
- Support and Resistance at StockCharts ChartSchool
Frequently asked questions
Does Session Sniper Map repaint?
Session boxes are fixed by the clock, so their start and end never move. Also, the height does change while a session runs, because the box tracks the live high and low. Once the window closes the box is final. Indeed, the script prints no entry signals, so there is nothing to repaint in the usual sense.
Which timeframe should I use?
Any intraday timeframe. Still, the script recommends 15 minutes or lower, and one-minute to fifteen-minute charts show the killzone windows clearly. On a daily or weekly chart every session check fails and the script prints a warning label instead of boxes.
Why do the boxes not match my broker clock?
The windows are hard-coded in UTC and the script offers no timezone input. Thus, your broker server time may sit two or three hours ahead, and daylight saving moves local hours twice a year. Compare a known open, such as 07:00 UTC for London, against your chart clock once and apply that offset.
What does the breakout percentage mean?
It counts how often a session finished with a high above, or a low below, the previous same-session high or low. Hence, the script divides that count by completed sessions. It describes the last 20 sessions on your symbol and says nothing about the next one.
How much should I rely on this indicator?
Treat it as one input, not a decision. Next, it is a chart analysis tool, not trading advice. Test it on your own markets and timeframes before relying on it. Results are not guaranteed; past performance is not indicative of future results.

About the author
Written by Dominic Walsh, a Forex trader and MT4/MT5 indicator, Expert Advisor and script developer. Every tool on forexmt4systems.com is tested on live charts before release and ships with ready-to-use compiled MT4 (.ex4) and MT5 (.ex5) files. Learn more about the trader and developer behind this site.
How we build, test and correct every tool: Editorial & Testing Policy. Trading carries risk; see the disclaimer.