
Zone tools often mark every base on the chart. This supply and demand zones indicator TradingView script stays picky. It waits for three consecutive same-direction candles that each trade above 1.2 times the 20-bar volume average. Only then does it box the candle that launched the move. Each zone keeps its own touch counter, fades as traders use it up, and turns grey once price closes clean through it.
It is free and open source. You can add it to any chart from the Supply Demand Fortress script page on TradingView, and the full Pine source is published there for you to read.
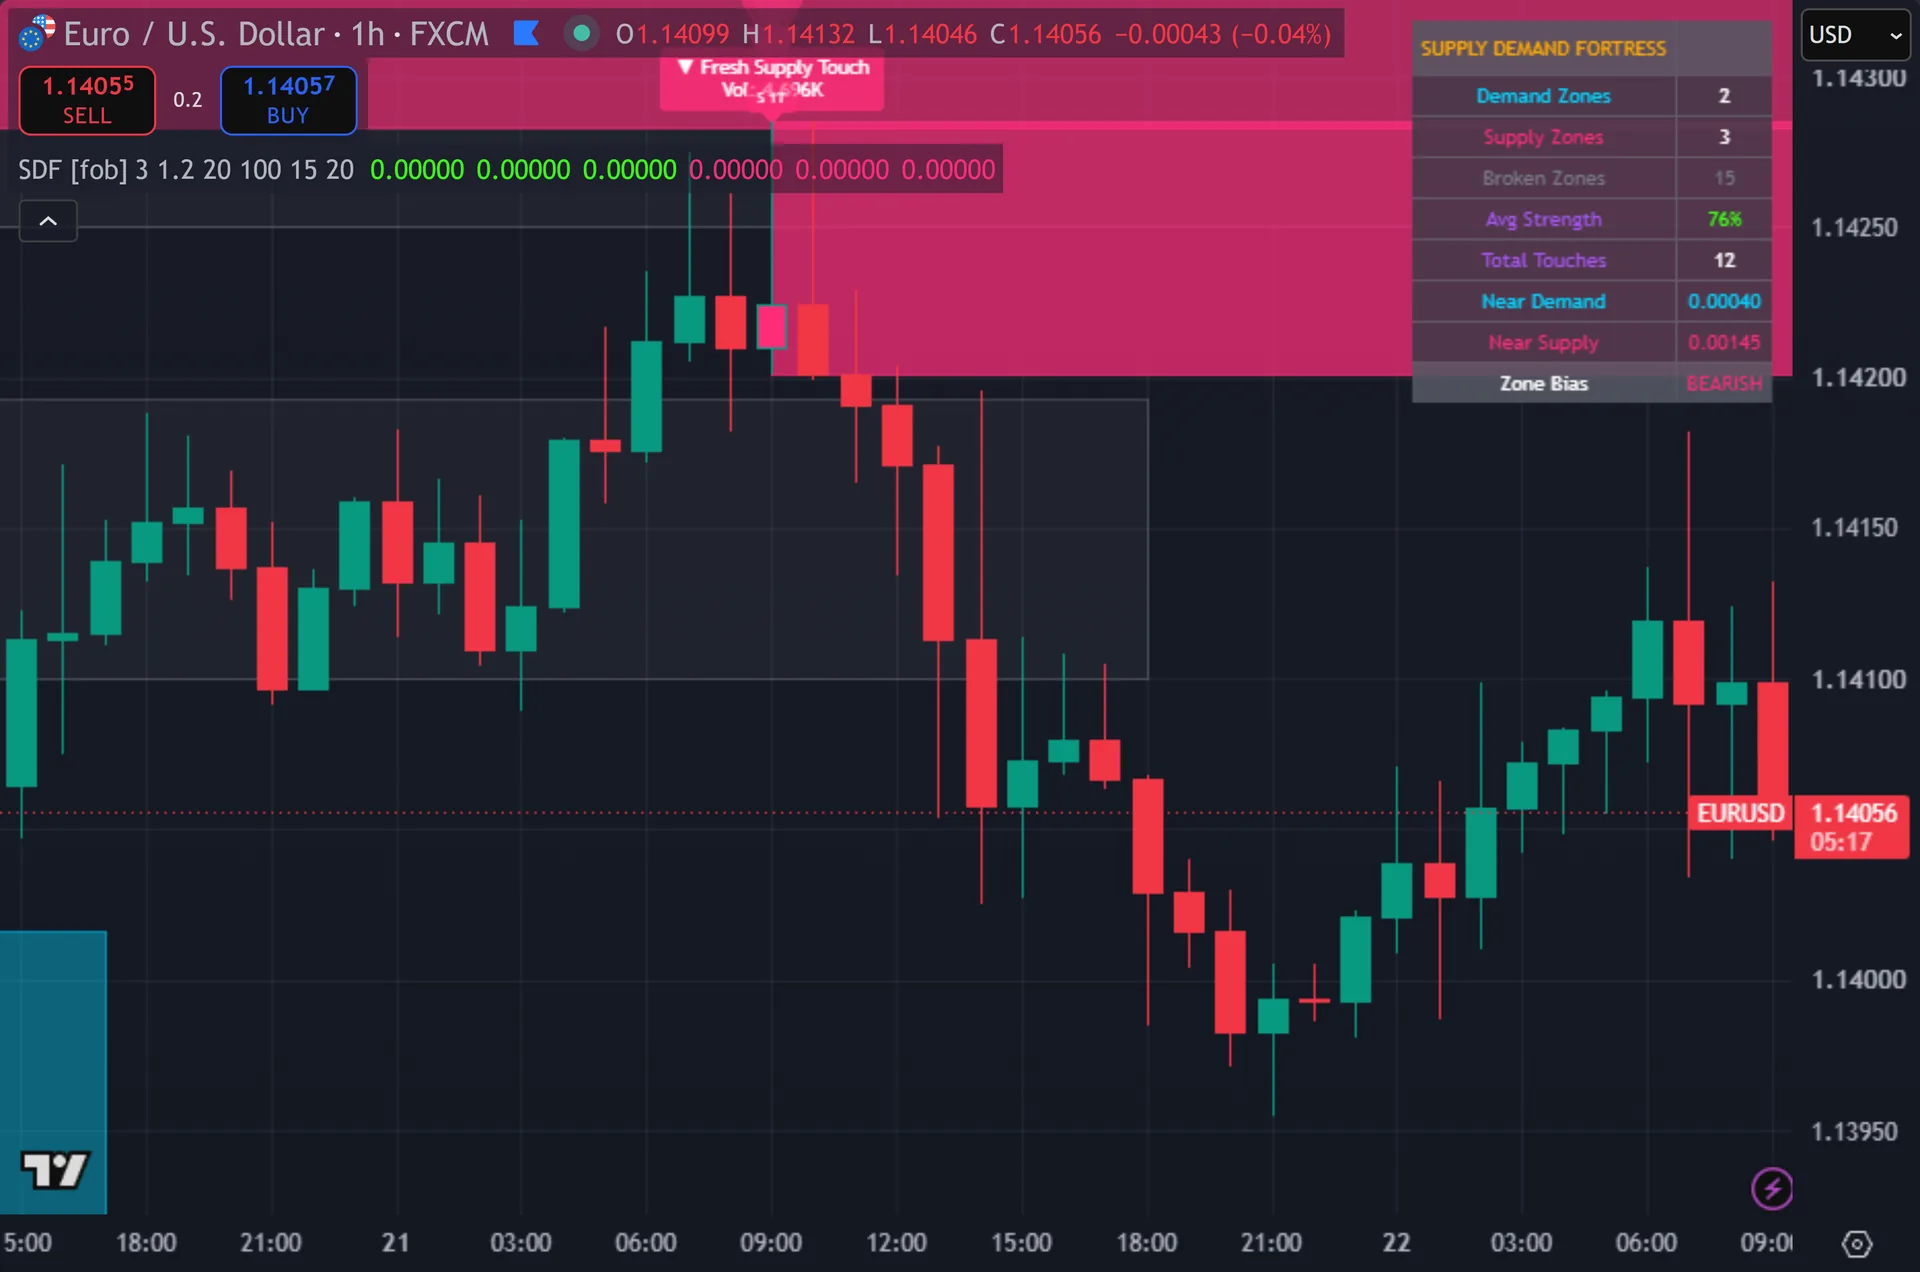
What Supply Demand Fortress plots on the price chart
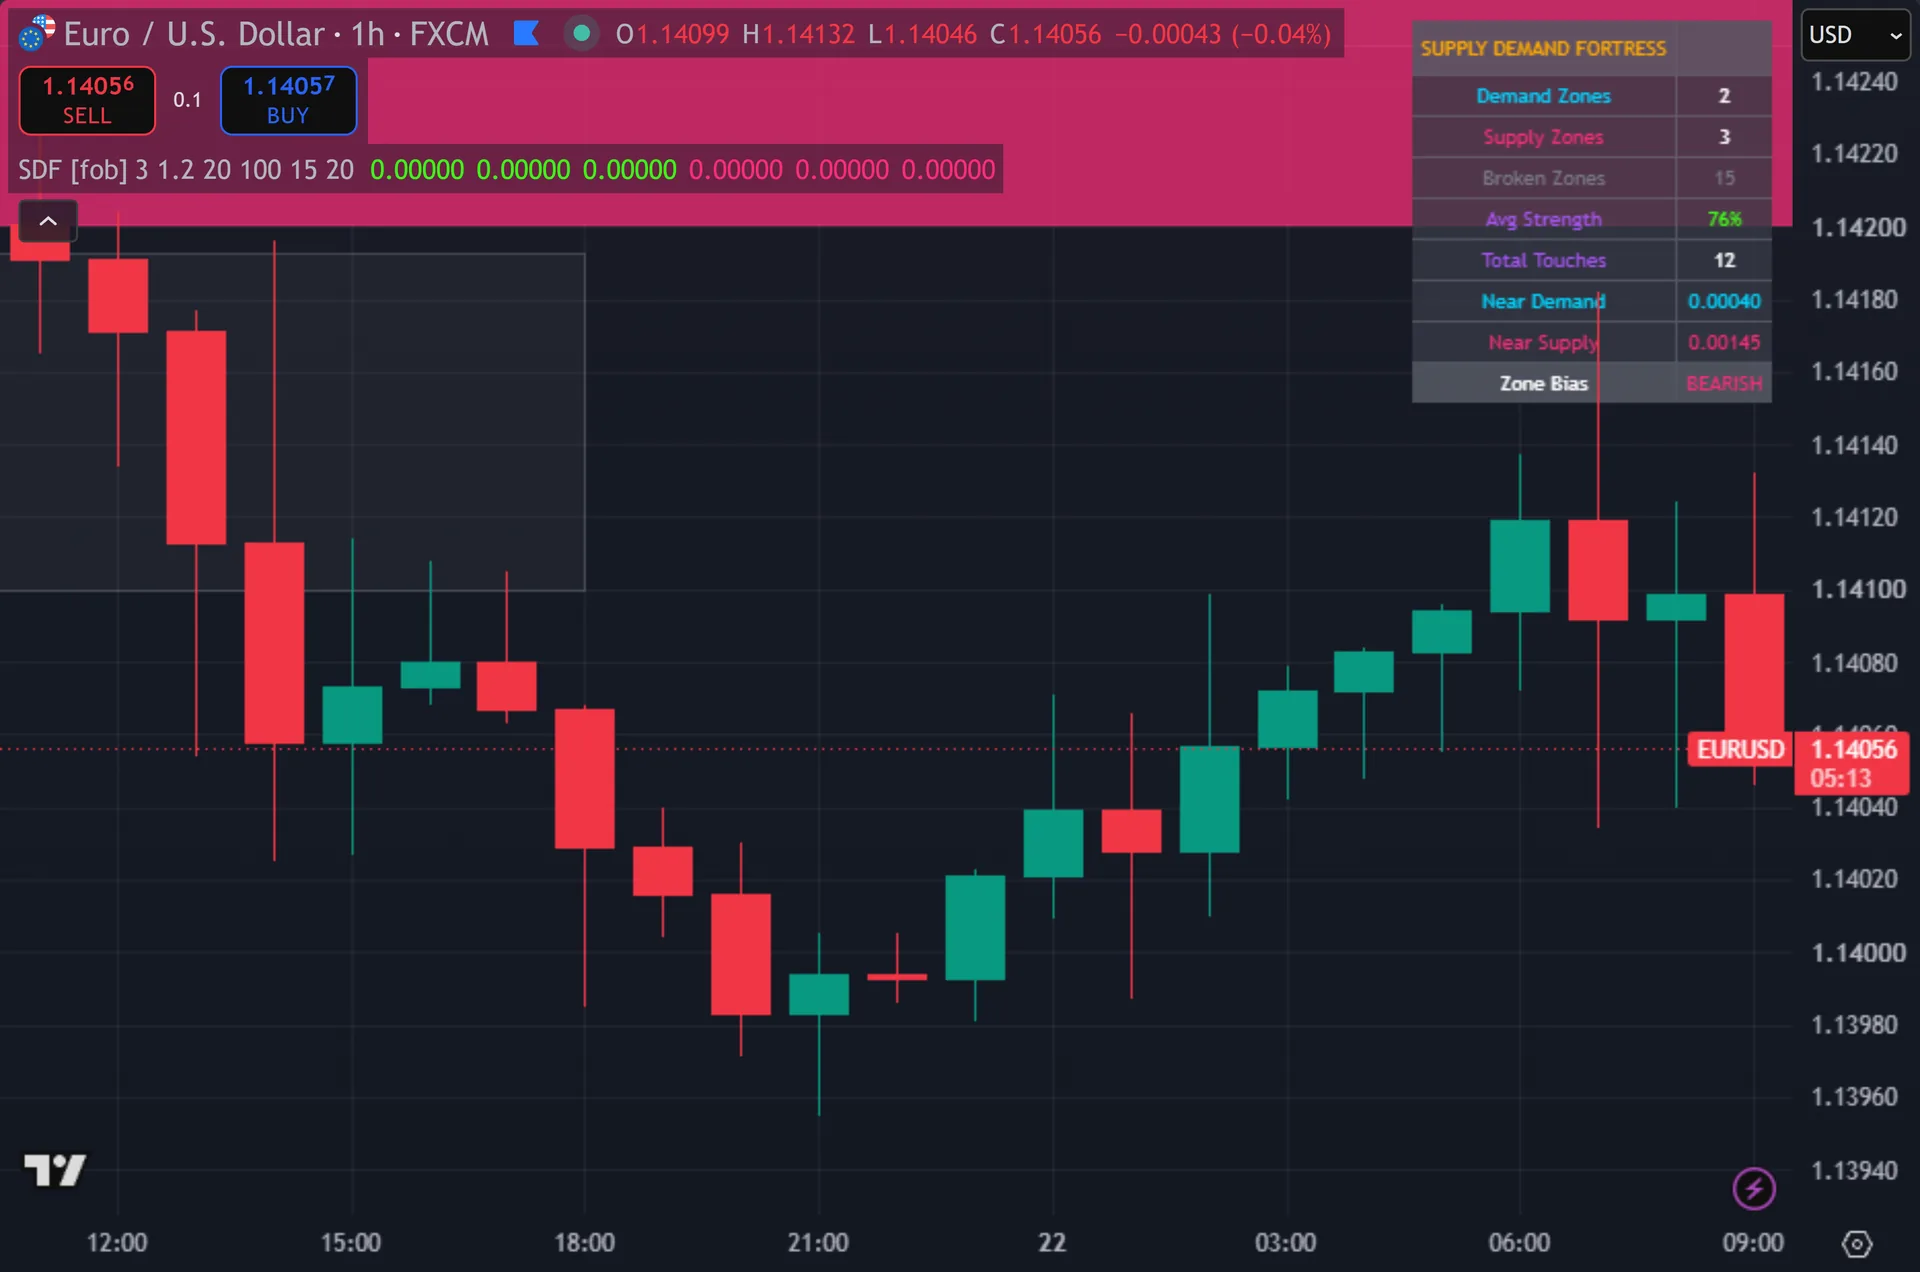
Demand zones draw as cyan boxes, supply zones as pink. Each box starts at the origin candle and runs 100 bars to the right. A small label sits on the near edge and reads D 0T or S 0T, the running touch count. Broken zones fade to grey. A first touch prints three stacked triangles below or above the bar, tagged BUY or SELL, plus a text label carrying that bar’s volume. Signal bars change color. A nine-row table tracks zone counts, strength, touches, distances and bias.
How Supply Demand Fortress is built
Impulse detection and zone creation
Volume gates everything. The script builds a 20-period SMA of volume, then marks a bar as expanded when volume clears that average times 1.2. A running counter adds one for each bullish candle that clears the test, and resets to zero the moment a candle fails. A separate counter does the same job for bearish candles.
An impulse fires when the counter first reaches the Min Impulse Candles setting, three by default. The code checks that the prior bar’s run sat below the threshold, so one impulse creates one zone rather than a new zone on every extra candle. You can demand up to eight candles, or push the volume factor as high as 3.0.
On a confirmed impulse the script reads high[3] and low[3], the candle right before the run, and draws the box between them. It stores top, bottom, direction, touch count, a strength of 100, a broken flag, the box and the label in a Zone object. The array holds 20 zones by default. When it overflows, the oldest zone shifts out and its box and label get deleted.
Touches, strength decay and signals
A demand touch needs the bar low inside the box and the close back above the box top. A supply touch needs the high inside the box and the close back below the bottom. Each touch adds one to the counter, updates the label text, and cuts strength by 10 with a floor of 10.
Strength drives the fill. Transparency equals 100 minus strength times 0.8, so a fresh zone paints at 20 transparency and a worn zone drifts out to 92. Used-up zones therefore fade off the chart on their own. The table averages strength across all live zones.
Signals fire on the first touch only. The script needs touches equal to 1, volume above its plain 20-bar SMA, a clear 15-bar cooldown, and barstate.isconfirmed. So triangles print at bar close and do not repaint. A demand zone breaks when a bar closes below its bottom, and a supply zone breaks when a bar closes above its top. Broken zones grey out, stop signalling, and leave the bias count. Eleven alerts cover signals, impulses, volume spikes and JSON webhooks.
How to read the signals
Judge a zone by its color depth. A bright, solid box is fresh at strength 100. A washed-out box has taken several touches and lost strength down toward the floor of 10. Grey means price closed through it and the script wrote it off. The label on the edge gives the exact count, so D 2T means a demand zone that has already handled two tests.
Use the triangles as the trade trigger and the boxes as the map. A BUY triangle means price dipped into a fresh demand box, closed back above it, and did so on above-average volume. The 15-bar cooldown then blocks a second arrow, which keeps a single volatile session from stacking signals.
The table sets the wider context. Demand Zones and Supply Zones count what is still live, and Zone Bias compares the two. Near Demand and Near Supply give the distance from the current close to the closest untouched edge on each side. Those two numbers help you size a stop and see how much room the next move has.
Every Supply Demand Fortress setting explained
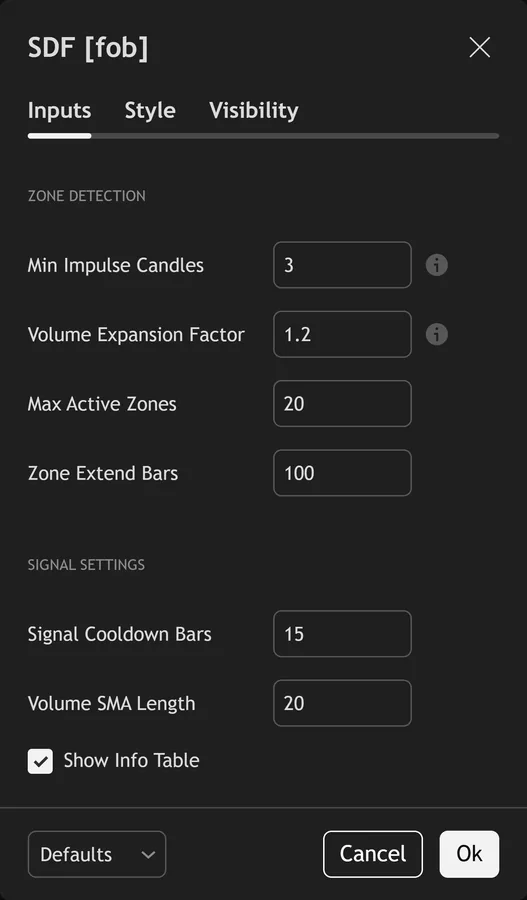
The script exposes 7 inputs, grouped in the settings panel exactly as shown below. Defaults are the published values.
Zone Detection
| Setting | What it does | Default | Range |
|---|---|---|---|
| Min Impulse Candles | Minimum consecutive candles for impulse move | 3 | 2 to 8 |
| Volume Expansion Factor | Volume must exceed SMA * this factor during impulse | 1.2 | 1.0 to 3.0 |
| Max Active Zones | Sets the max active zones used in the calculation. | 20 | 5 to 50 |
| Zone Extend Bars | Sets the zone extend bars used in the calculation. | 100 | 20 to 500 |
Signal Settings
| Setting | What it does | Default | Range |
|---|---|---|---|
| Signal Cooldown Bars | Sets the signal cooldown bars used in the calculation. | 15 | 5 to 50 |
| Volume SMA Length | Sets the volume sma length used in the calculation. | 20 | 5 to 50 |
| Show Info Table | Toggles show info table on the chart. | on | on / off |
Alerts built into Supply Demand Fortress
The script ships 11 alert conditions. Open the alert dialog on the chart, pick the indicator as the condition source, then choose the event you want. Alerts fire on the close of the bar, so they follow the same confirmed-bar rule the on-chart signals use.
- SDF Demand Signal
- SDF Supply Signal
- SDF Bull Impulse
- SDF Bear Impulse
- SDF Any Touch Signal
- SDF Volume Above Avg
- SDF Strong Demand
- SDF Strong Supply
- SDF Any Impulse
Other markets and timeframes
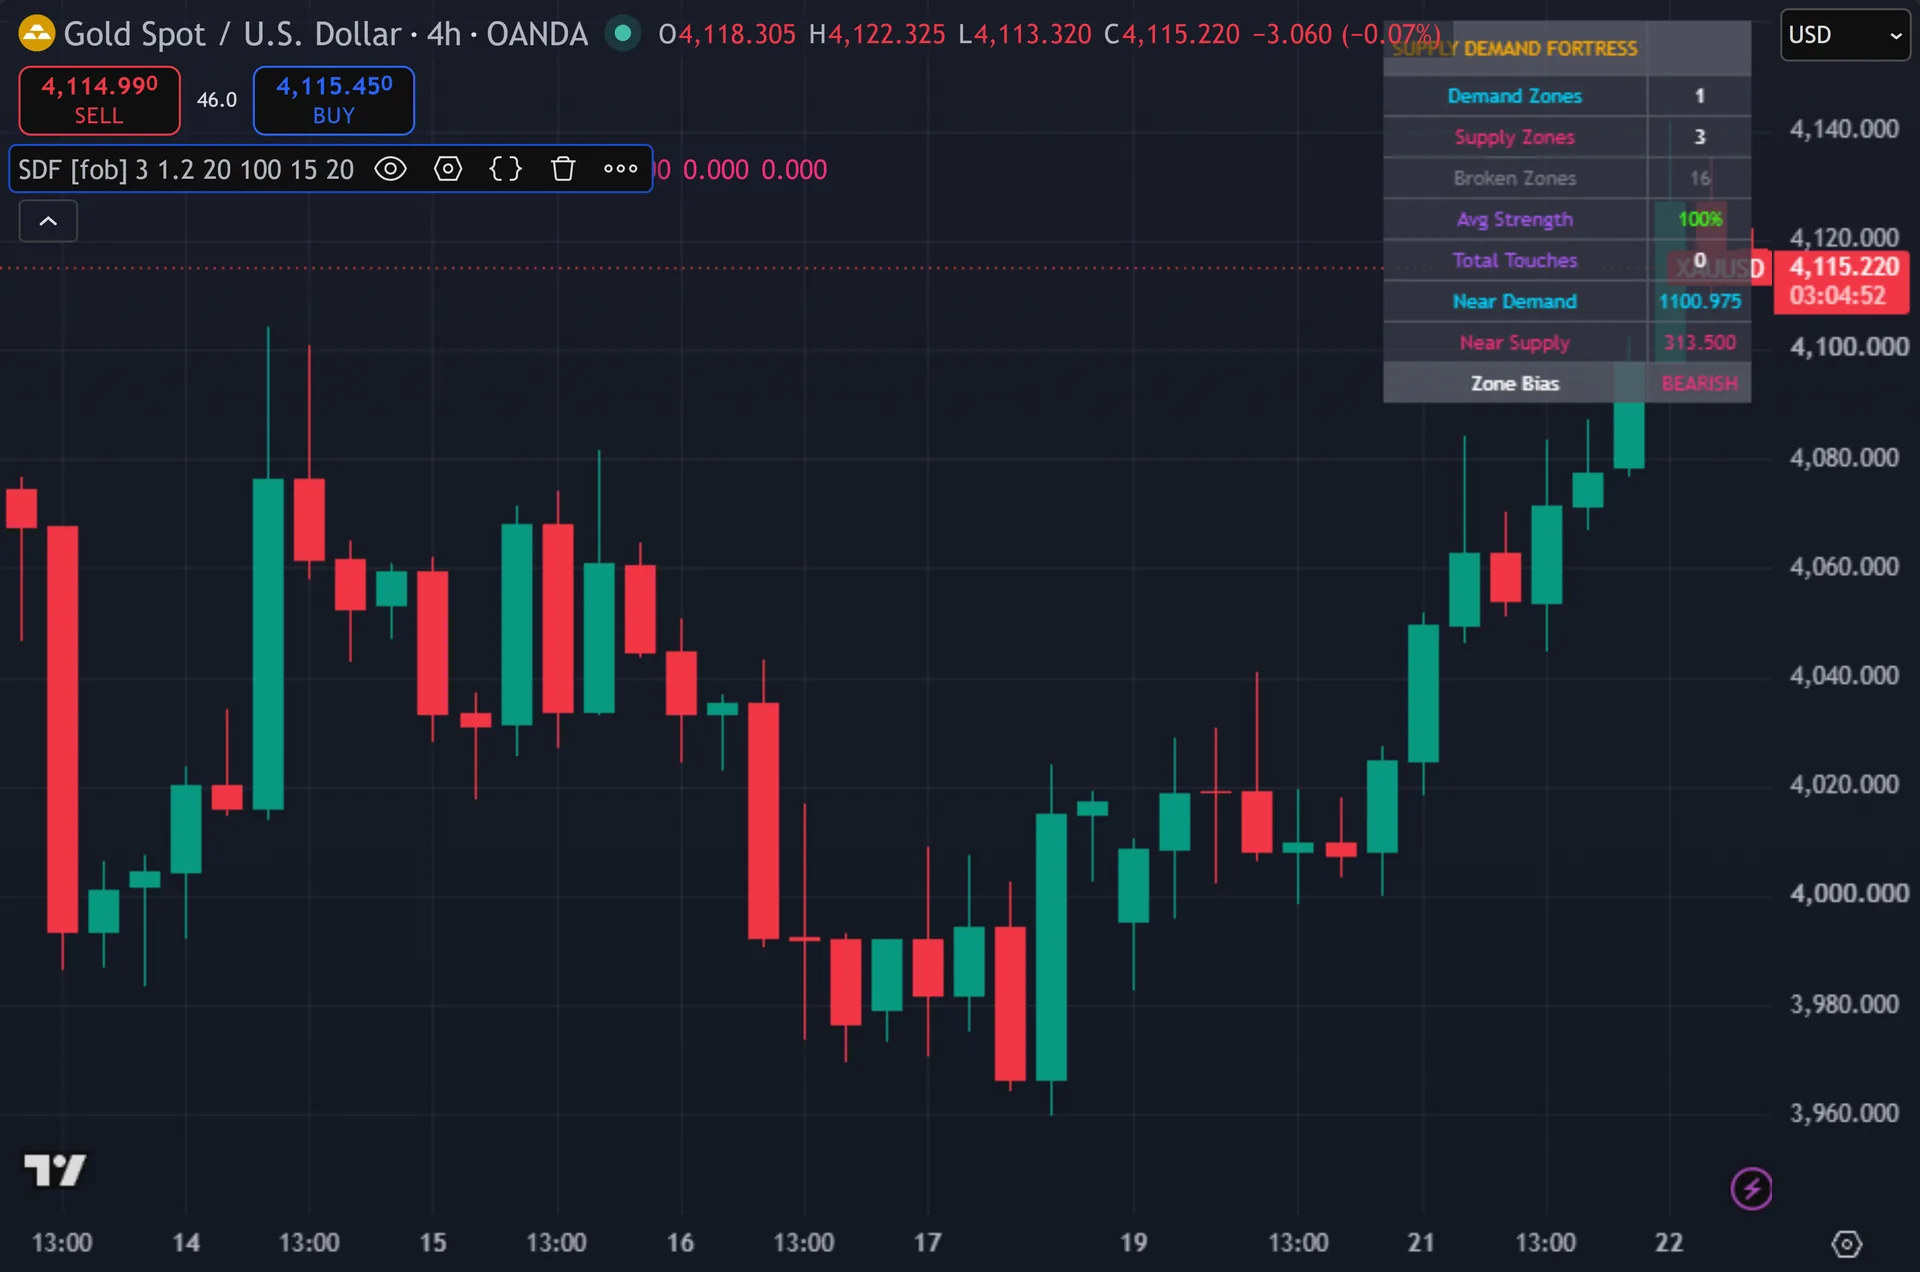
Zone geometry is fully relative. Box edges come from real highs and lows, and the volume test is a multiple of the symbol’s own average, so no pip or dollar constant appears. Futures, crypto, indices and single stocks all suit the script well. Spot forex works too, though TradingView reports broker tick volume there rather than traded contracts, which measures activity instead of size. On any symbol with no volume feed the impulse test never passes and no zones appear at all.
Limitations worth knowing
The script signals the first touch only. Later touches still update the label and fade the box, yet they never fire an arrow. Plenty of traders prefer the second test of a level, and this tool will not flag it for them.
Zone edges come from one candle, the bar before the run. The code never merges overlapping zones, never widens a box to cover the whole base, and never checks a level on a higher timeframe, since it makes no request.security call. It also keeps just 20 live zones by default, so older levels drop off the chart.
Touch counters update while a bar still forms, so a label can advance before the close even though arrows wait for the bar to confirm. The tool also plots no stop, no target and no position size. Volume filters mislead on illiquid symbols and around session opens. Past performance does not predict future results.
Get Supply Demand Fortress on TradingView
Open Supply Demand Fortress on TradingView
If you also trade MetaTrader, the MT4 and MT5 indicator library is available below.
Get the complete indicator library
One email unlocks the full MT4 and MT5 indicator library. This TradingView script stays free on TradingView – the button above adds it to your chart.
Using it alongside MetaTrader
Adding a script on TradingView takes one click, so there is no install step here. If you want the same idea on MetaTrader, the MT4 and MT5 indicator installation guide walks through copying files into the data folder and attaching them to a chart. You can also browse the full MetaTrader indicator library, the MT4 indicators section, or the other free TradingView scripts published on this profile. For related chart tools see the MT5 indicators section and the forex trading strategies guides.
External references
- Price action trading on Wikipedia
- Support And Resistance at StockCharts ChartSchool
- Resistance at Investopedia
Frequently asked questions
Does Supply Demand Fortress repaint its signals?
No. Both the buy and the sell condition require barstate.isconfirmed, and zone creation runs on confirmed bars as well. Triangles print at the close of the bar and stay put.
Does it need volume data?
Yes. Zone creation demands volume above the 20-bar SMA times 1.2, and every signal needs volume above that same SMA. On a symbol with no volume feed the script draws nothing. On spot forex the feed is broker tick volume, which still works as an activity proxy.
Why did I get no arrow on the second touch of a zone?
By design. The signal block requires a touch count of exactly 1. The second and later touches only raise the counter, cut the strength by 10 and fade the box. Watch the label text for the count.
What does Avg Strength in the table mean?
It averages the strength value of every live zone. A zone opens at 100 and loses 10 per touch, with a floor of 10. So a reading near 100 says your levels are mostly untested, while a low reading says price has worked through most of them.
How much should I rely on this indicator?
Treat it as one input, not a decision. It is a chart analysis tool, not trading advice. Test it on your own markets and timeframes before relying on it. Results are not guaranteed; past performance is not indicative of future results.

About the author
Written by Dominic Walsh, a Forex trader and MT4/MT5 indicator, Expert Advisor and script developer. Every tool on forexmt4systems.com is tested on live charts before release and ships with ready-to-use compiled MT4 (.ex4) and MT5 (.ex5) files. Learn more about the trader and developer behind this site.
How we build, test and correct every tool: Editorial & Testing Policy. Trading carries risk; see the disclaimer.