
Theil Sen Robust Slope is a linear regression indicator TradingView traders can use where outliers wreck ordinary least squares. Instead of minimising squared error, the script measures the slope between every pair of closes in a 20-bar window and keeps the median. That is the Theil-Sen estimator, a published robust method. Also, one spike cannot drag the line. Signals then fire when close crosses the fitted line inside an ATR-scaled trend.
It is free and open source. Indeed, you can add it to any chart from the Theil Sen Robust Slope script page on TradingView, and the full Pine source is published there for you to read.
What Theil Sen Robust Slope plots on the price chart
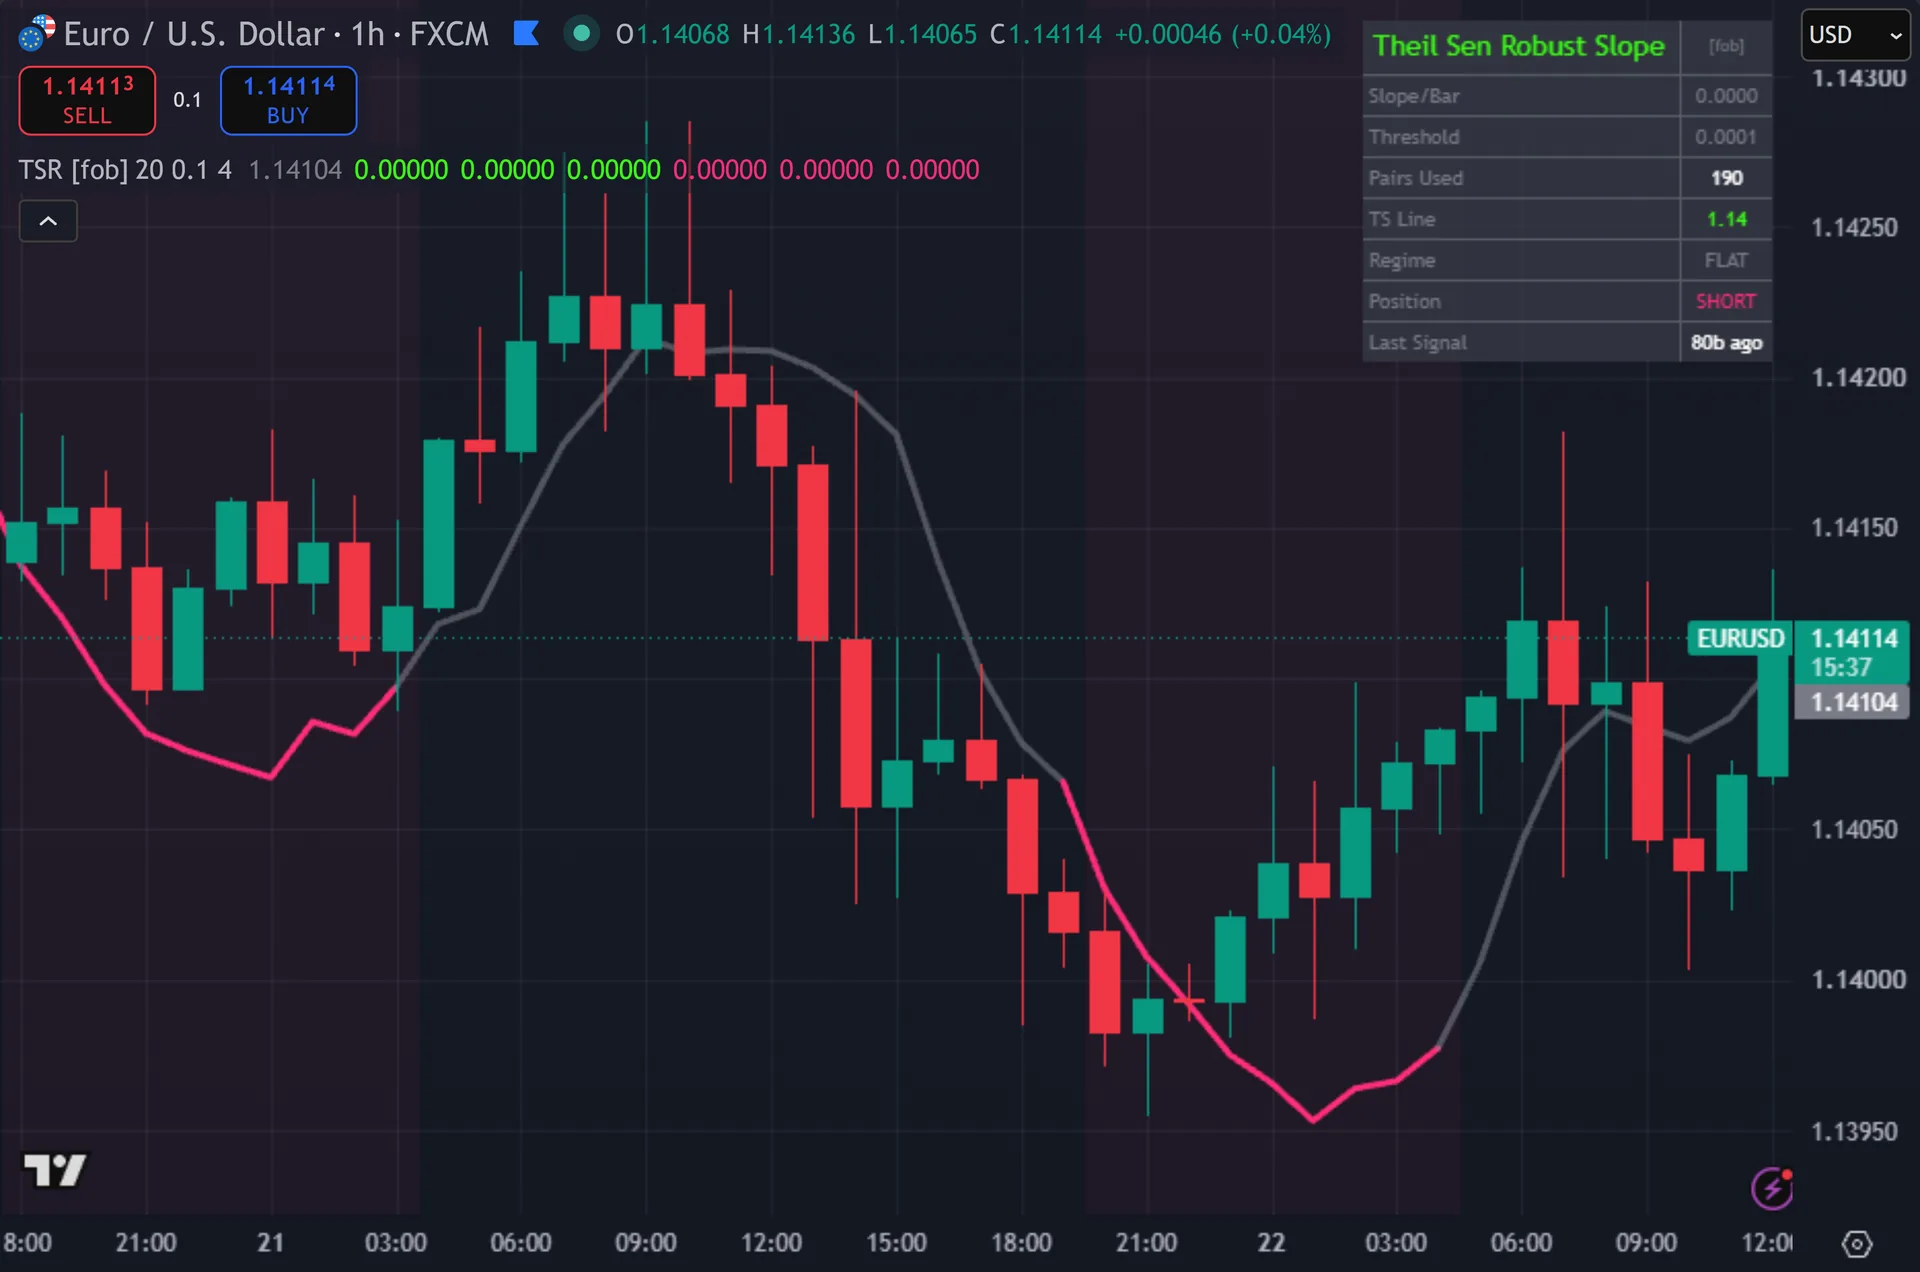
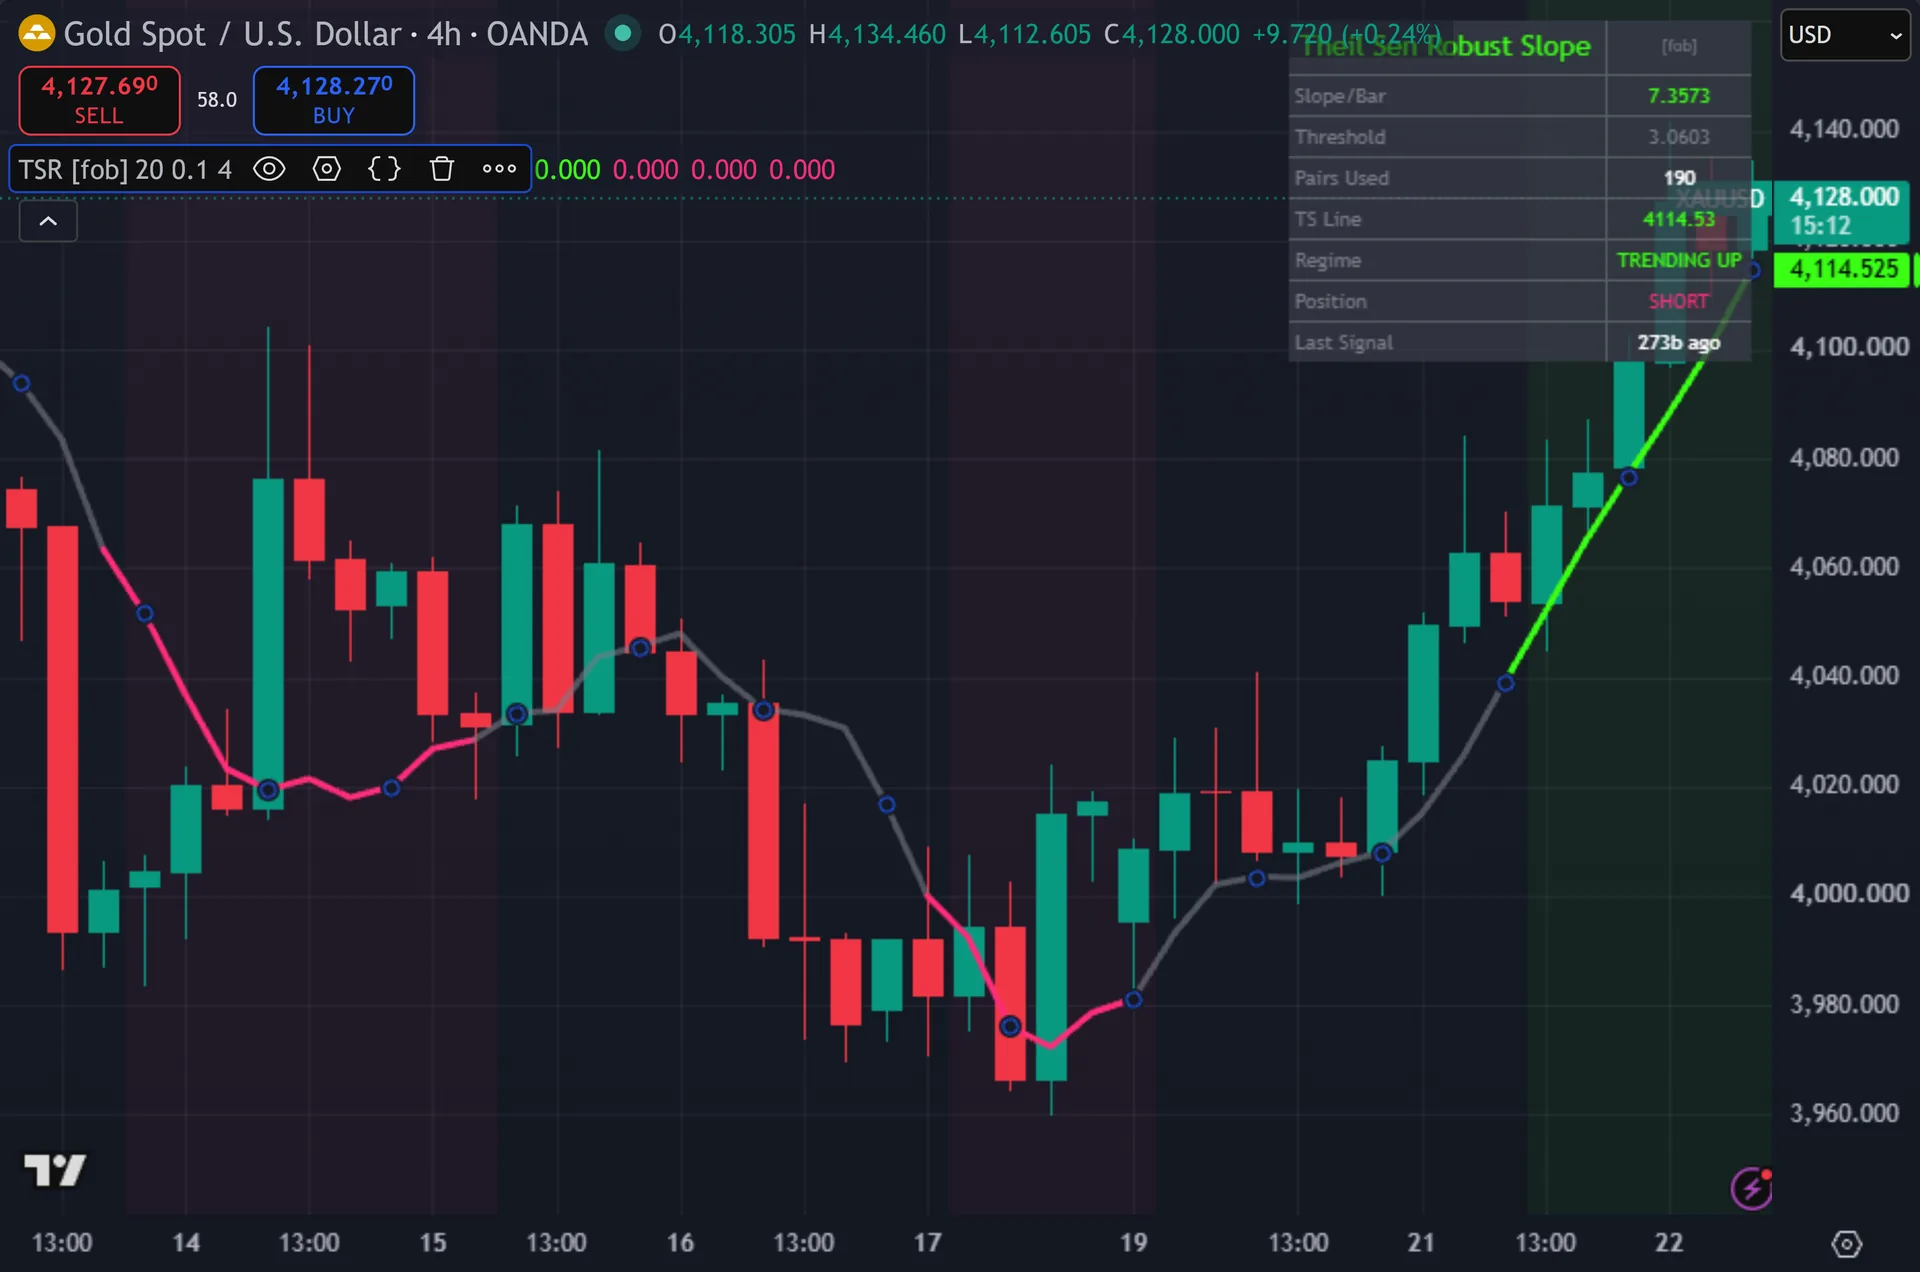
A thick fitted line runs across price. Still, it turns lime while the slope reads up, pink while it reads down, and grey while the market sits flat. Triangles mark signals – lime and pointing up below the bar, pink and pointing down above it – each tagged TSR up or TSR dn and backed by two larger translucent triangles. Thus, signal bars change colour, and a faint background tint shows the trend regime. The dashboard lists slope per bar, the ATR threshold, the pair count, the line value, the regime, position and bars since the last signal.
How Theil Sen Robust Slope is built
Median of every pairwise slope
Ordinary regression squares its errors, so one bad print pulls the whole line toward itself. Theil-Sen sidesteps that. Across a 20-bar window the script walks every pair of closes, 190 pairs in total, and stores each rise over run. Hence, the median of that list becomes the slope. Statisticians place the breakdown point of this estimator near 29 percent, which means almost a third of the sample can be corrupt before the estimate breaks.
The level comes next. Next, the script projects each of the 20 closes forward to the current bar by adding its bar offset times the slope. It then takes the median of those 20 projections. Then, that value is the Theil-Sen intercept at the current bar, and that is the line you see plotted.
Cost rises fast with window size. Yet, n of 20 means 190 pairs recomputed on every bar. The maximum of 40 means 780. Truly, the dashboard shows the live pair count so you can see what you asked for.
The regime gate and the entry
Slope on its own means little. Plainly, a slope of 0.0001 per bar is steep on a quiet market and flat on a fast one. So the script scales it. Also, it compares the absolute slope with 0.10 times ATR over 14 bars. Clear that and the regime reads trending up or trending down. Indeed, fail it and the line greys out and blocks every signal.
Entries need both parts to agree. Still, a buy needs a trending-up regime plus close crossing above the fitted line. A sell needs the mirror of that. Thus, position state must alternate, four bars of cooldown must elapse, and barstate.isconfirmed must read true. The triangles and their glow layers all read that final flag.
One detail is worth knowing. Hence, the fitted line includes the current close inside its own 20-bar window, so the line moves as price moves and a cross can land very close to the line. The median also hops between neighbouring observations, which makes the plotted line look slightly steppy next to a smooth least-squares line. Next, that is the estimator working, not a bug.
How to read the signals
Use the line colour as your permission slip. Then, grey says the slope failed the ATR test, so the market reads flat and nothing can fire. Lime or pink says the slope cleared it. Yet, the dashboard prints both the slope per bar and the exact threshold it had to beat, so you can watch how close a call it was.
Then treat the line as a pullback reference. In a lime regime, price dipping under the line and crossing back up is the setup the script marks. The robust fit is the point here. Truly, a single spike bar inside the window barely moves the line, so the reference level holds where a least-squares line would have been yanked sideways.
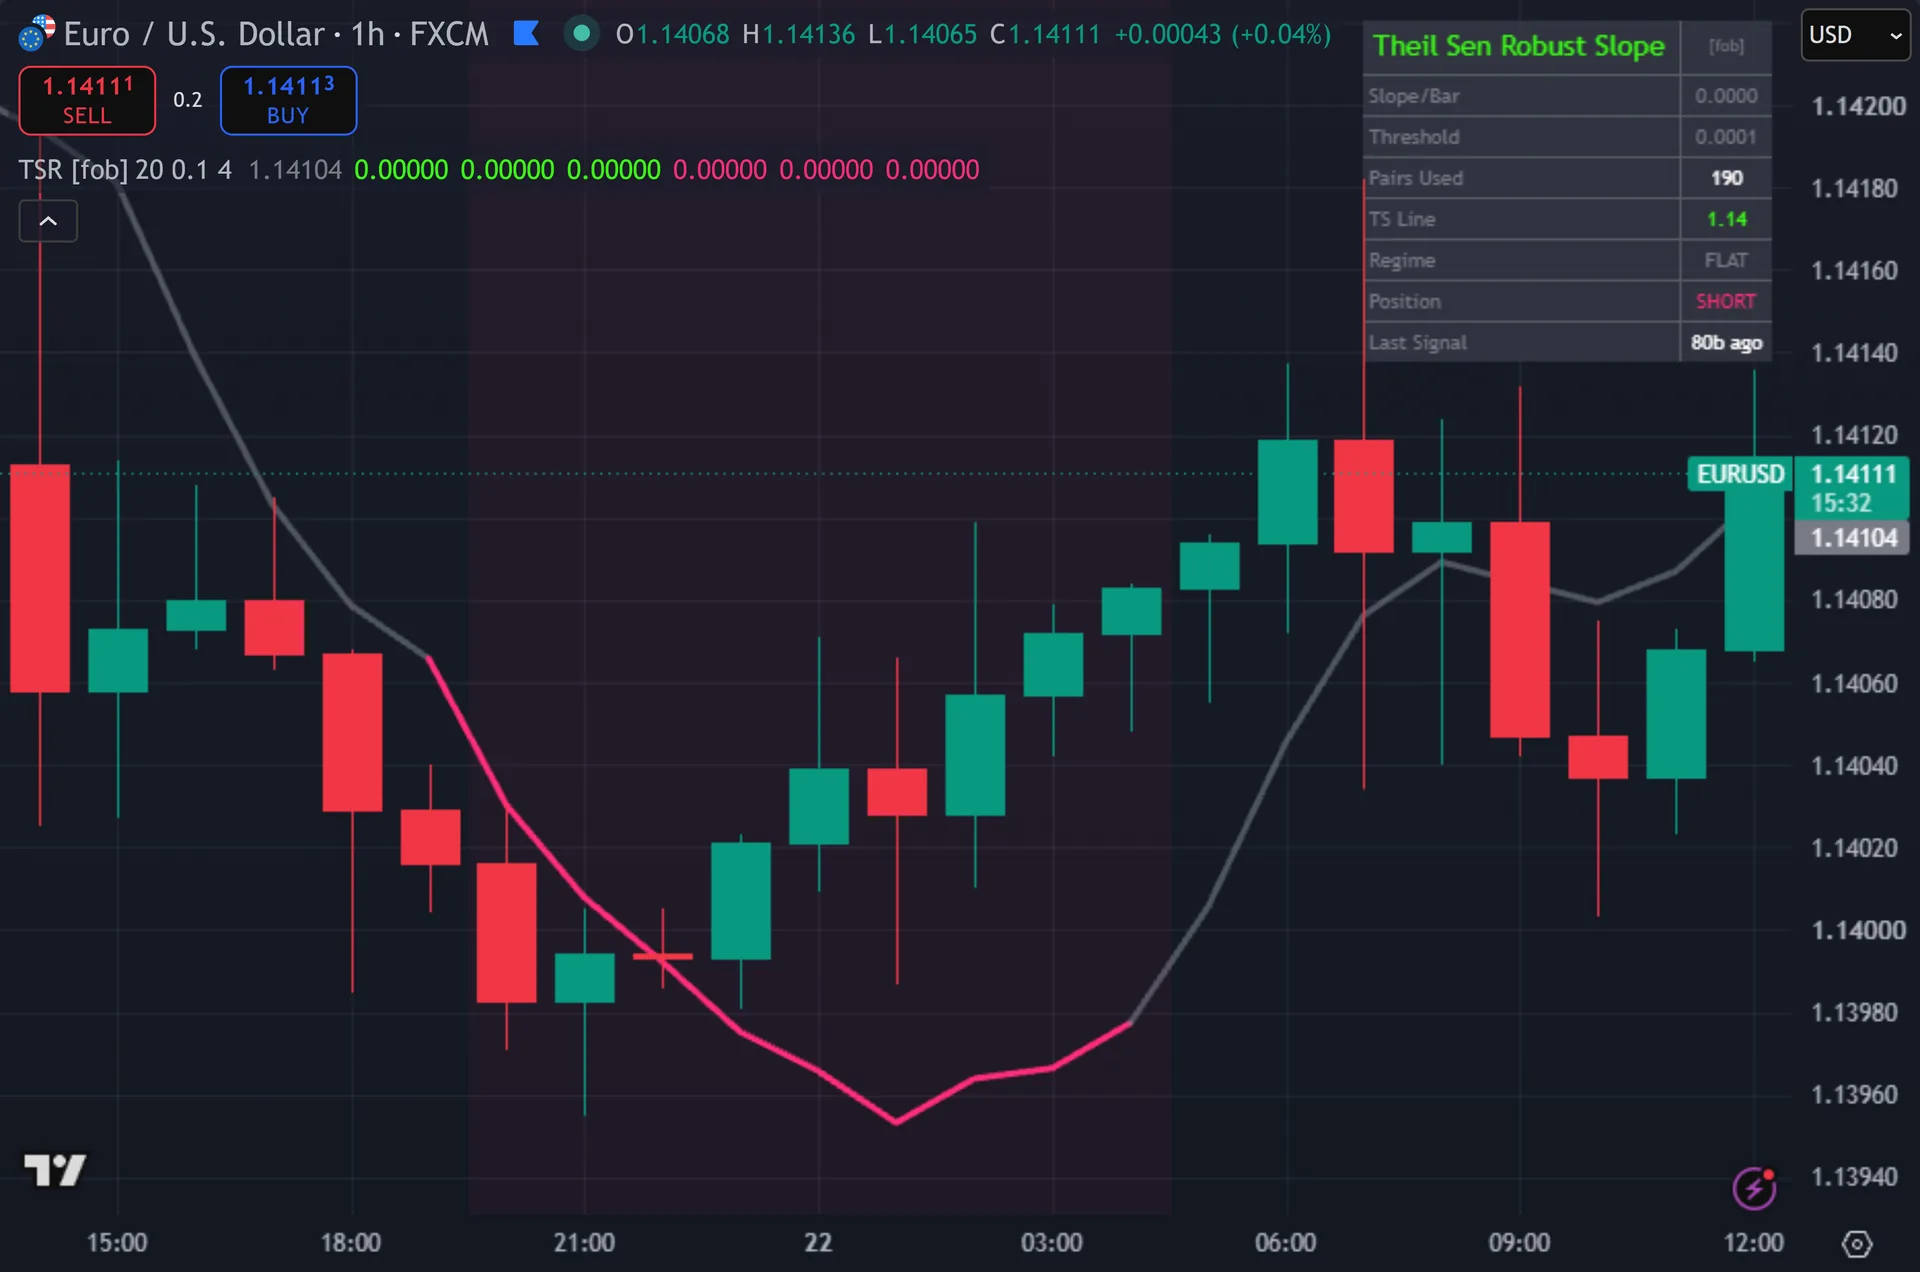
Signals confirm on the close, so a triangle lands at the open of the next candle. Because the line updates with each new close, a cross that looked clear intrabar can settle back by the close. That is the gate doing its job, and it is why the historical chart matches what you would have seen live.
Every Theil Sen Robust Slope setting explained
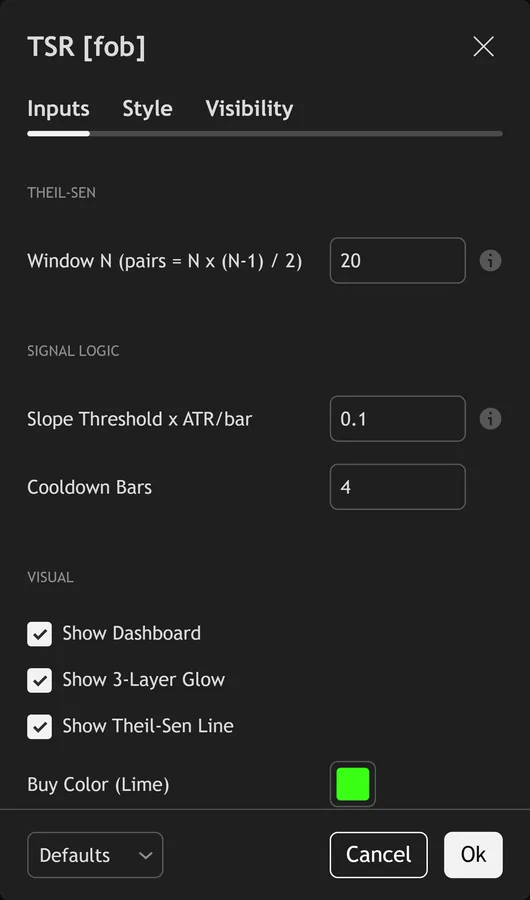
The script exposes 8 inputs, grouped in the settings panel exactly as shown below. Defaults are the published values.
Theil-Sen
| Setting | What it does | Default | Range |
|---|---|---|---|
| Window N (pairs = N x (N-1) / 2) | N=20 -> 190 pairwise slopes per bar. | 20 | 10 to 40 |
Signal Logic
| Setting | What it does | Default | Range |
|---|---|---|---|
| Slope Threshold x ATR/bar | |slope| must exceed k x (ATR/bar) for a ‘trending’ regime. | 0.10 | 0.01 to 2.0 |
| Cooldown Bars | Sets the cooldown bars used in the calculation. | 4 | 1 to 20 |
Visual
| Setting | What it does | Default | Range |
|---|---|---|---|
| Show Dashboard | Toggles show dashboard on the chart. | on | on / off |
| Show 3-Layer Glow | Toggles show 3-layer glow on the chart. | on | on / off |
| Show Theil-Sen Line | Toggles show theil-sen line on the chart. | on | on / off |
| Buy Color (Lime) | Colour used for buy color (lime). | #39ff14 | |
| Sell Color (Pink) | Colour used for sell color (pink). | #ff2d78 |
Alerts built into Theil Sen Robust Slope
The script ships 11 alert conditions. Plainly, open the alert dialog on the chart, pick the indicator as the condition source, then choose the event you want. Alerts fire on the close of the bar, so they follow the same confirmed-bar rule the on-chart signals use.
- TSR Buy
- TSR Sell
- TSR Any Signal
- TSR Trend Up Start
- TSR Trend Down Start
- TSR Cross Up
- TSR Cross Down
- TSR Slope Zero
- TSR Webhook JSON
Other markets and timeframes
This one travels well. Also, the slope threshold scales with ATR, so it adjusts itself to whatever instrument you load. The window counts bars. Indeed, nothing in the calculation uses a fixed pip or point value. So the same defaults run on gold, indices, crypto and equities without retuning. Still, the setting worth revisiting is the window, since a 20-bar fit on a 1-minute chart describes a very different move from a 20-bar fit on the daily.
Limitations worth knowing
It fits a straight line, and markets rarely move in straight lines. Thus, across a curving trend the fit sits above price on one side and below it on the other, which produces crosses that reflect curvature rather than a real change of direction. Robust does not mean flexible.
The tool filters and marks. It does not manage. There is no stop, no target, no exit and no sizing anywhere in the script. Hence, the same robustness that ignores a bad tick also ignores a genuine repricing after news for several bars, since the median needs time to shift.
Compute cost is real. Next, the script recalculates 190 pairwise slopes every bar at default settings, and 780 at the maximum window. Expect slower chart loading than a moving average, and expect the four-bar cooldown to be short enough that crosses can still cluster when price hugs the line.
Get Theil Sen Robust Slope on TradingView
Open Theil Sen Robust Slope on TradingView
If you also trade MetaTrader, the MT4 and MT5 indicator library is available below.
Get the complete indicator library
One email unlocks the full MT4 and MT5 indicator library. Then, this TradingView script stays free on TradingView – the button above adds it to your chart.
Using it alongside MetaTrader
Adding a script on TradingView takes one click, so there is no install step here. Yet, if you want the same idea on MetaTrader, the MT4 and MT5 indicator installation guide walks through copying files into the data folder and attaching them to a chart. You can also browse the full MetaTrader indicator library, the MT4 indicators section, or the other free TradingView scripts published on this profile. For related chart tools see the MT5 indicators section and the forex trading strategies guides.
External references
- Stochastic oscillator on Wikipedia
- Stochastic Oscillator at Investopedia
- Raff Regression Channel at StockCharts ChartSchool
Frequently asked questions
Does the Theil Sen Robust Slope repaint?
No. Truly, both signal flags include barstate.isconfirmed, and every triangle and glow layer reads them. A signal prints after the bar closes and stays there. Plainly, the fitted line itself does update with each new close, which is normal for any regression line, but the marked signals do not move.
How does this differ from the built-in linear regression?
The built-in tool minimises squared error, so a single outlier bar tilts the whole line. Also, this script takes the median of all 190 pairwise slopes instead. Outliers land at the ends of that list and the median ignores them. Indeed, the result is a line that holds its bearing through spikes and gaps.
What window size should I use?
Twenty bars is the default and a sensible starting point. Still, smaller windows react faster and produce more crosses. Larger windows steady the line, and the pair count grows quickly, so 40 bars means 780 slopes per bar. Thus, watch chart loading time before pushing the window higher.
Why is the line grey with no signals?
The absolute slope sits below 0.10 times ATR, so the regime reads flat. Hence, that gate blocks every entry by design, since crosses of a flat line carry little information. Lower the Slope Threshold input if you want signals in quieter conditions, and accept more of them.
How much should I rely on this indicator?
Treat it as one input, not a decision. Next, it is a chart analysis tool, not trading advice. Test it on your own markets and timeframes before relying on it. Results are not guaranteed; past performance is not indicative of future results.

About the author
Written by Dominic Walsh, a Forex trader and MT4/MT5 indicator, Expert Advisor and script developer. Every tool on forexmt4systems.com is tested on live charts before release and ships with ready-to-use compiled MT4 (.ex4) and MT5 (.ex5) files. Learn more about the trader and developer behind this site.
How we build, test and correct every tool: Editorial & Testing Policy. Trading carries risk; see the disclaimer.