
Volatility does not rise in a straight line. Also, it expands, then it contracts, then it expands again. Volatility Pulse Detector is a volatility expansion indicator TradingView traders can drop on any chart to time those turns. Indeed, it divides a 10-bar ATR against a 50-bar ATR baseline, calls the result a systole or diastole phase, and marks a signal only on the bar an expansion phase begins.
It is free and open source. Still, you can add it to any chart from the Volatility Pulse Detector script page on TradingView, and the full Pine source is published there for you to read.
What Volatility Pulse Detector plots on the price chart
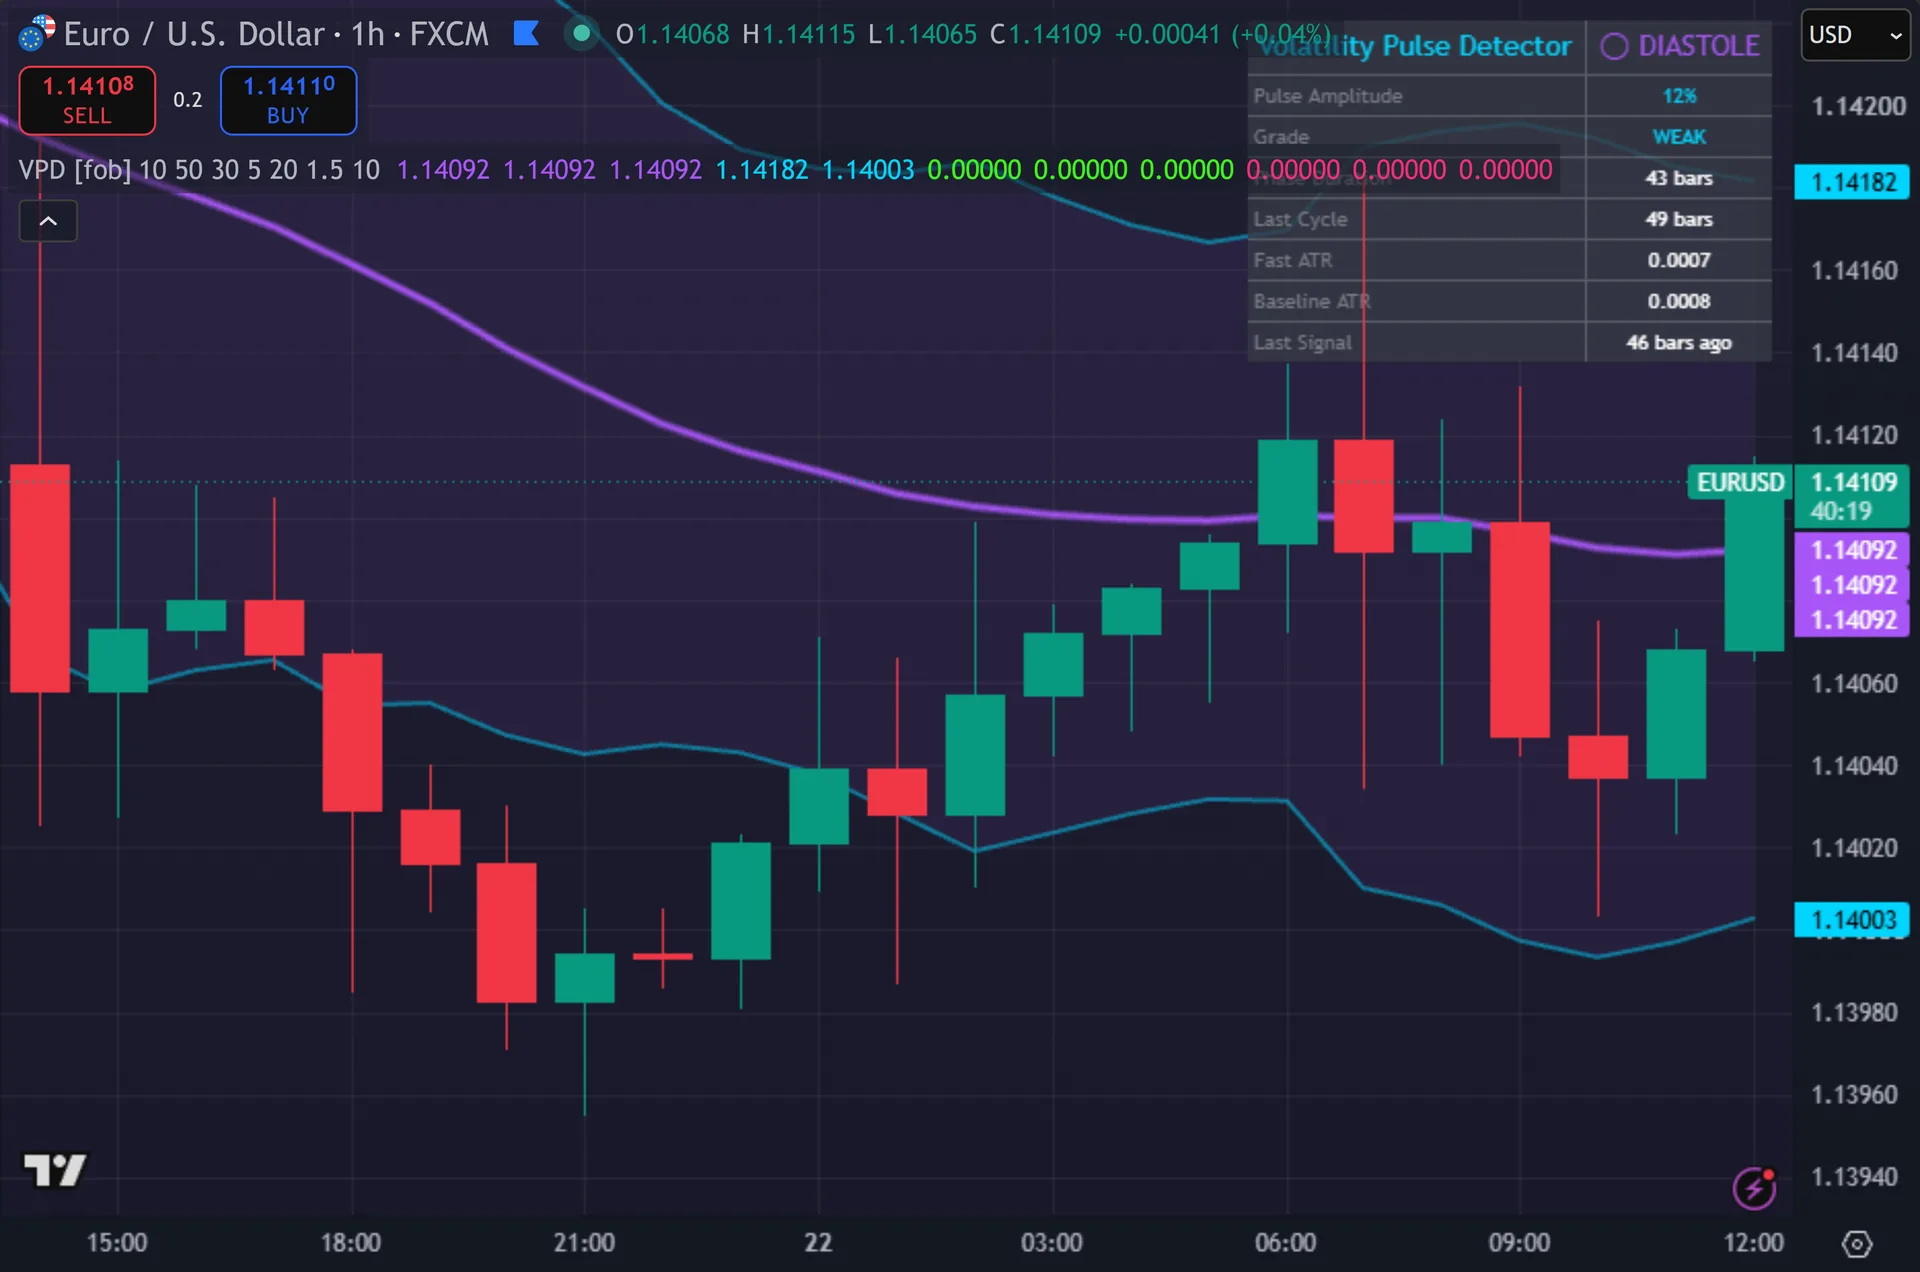
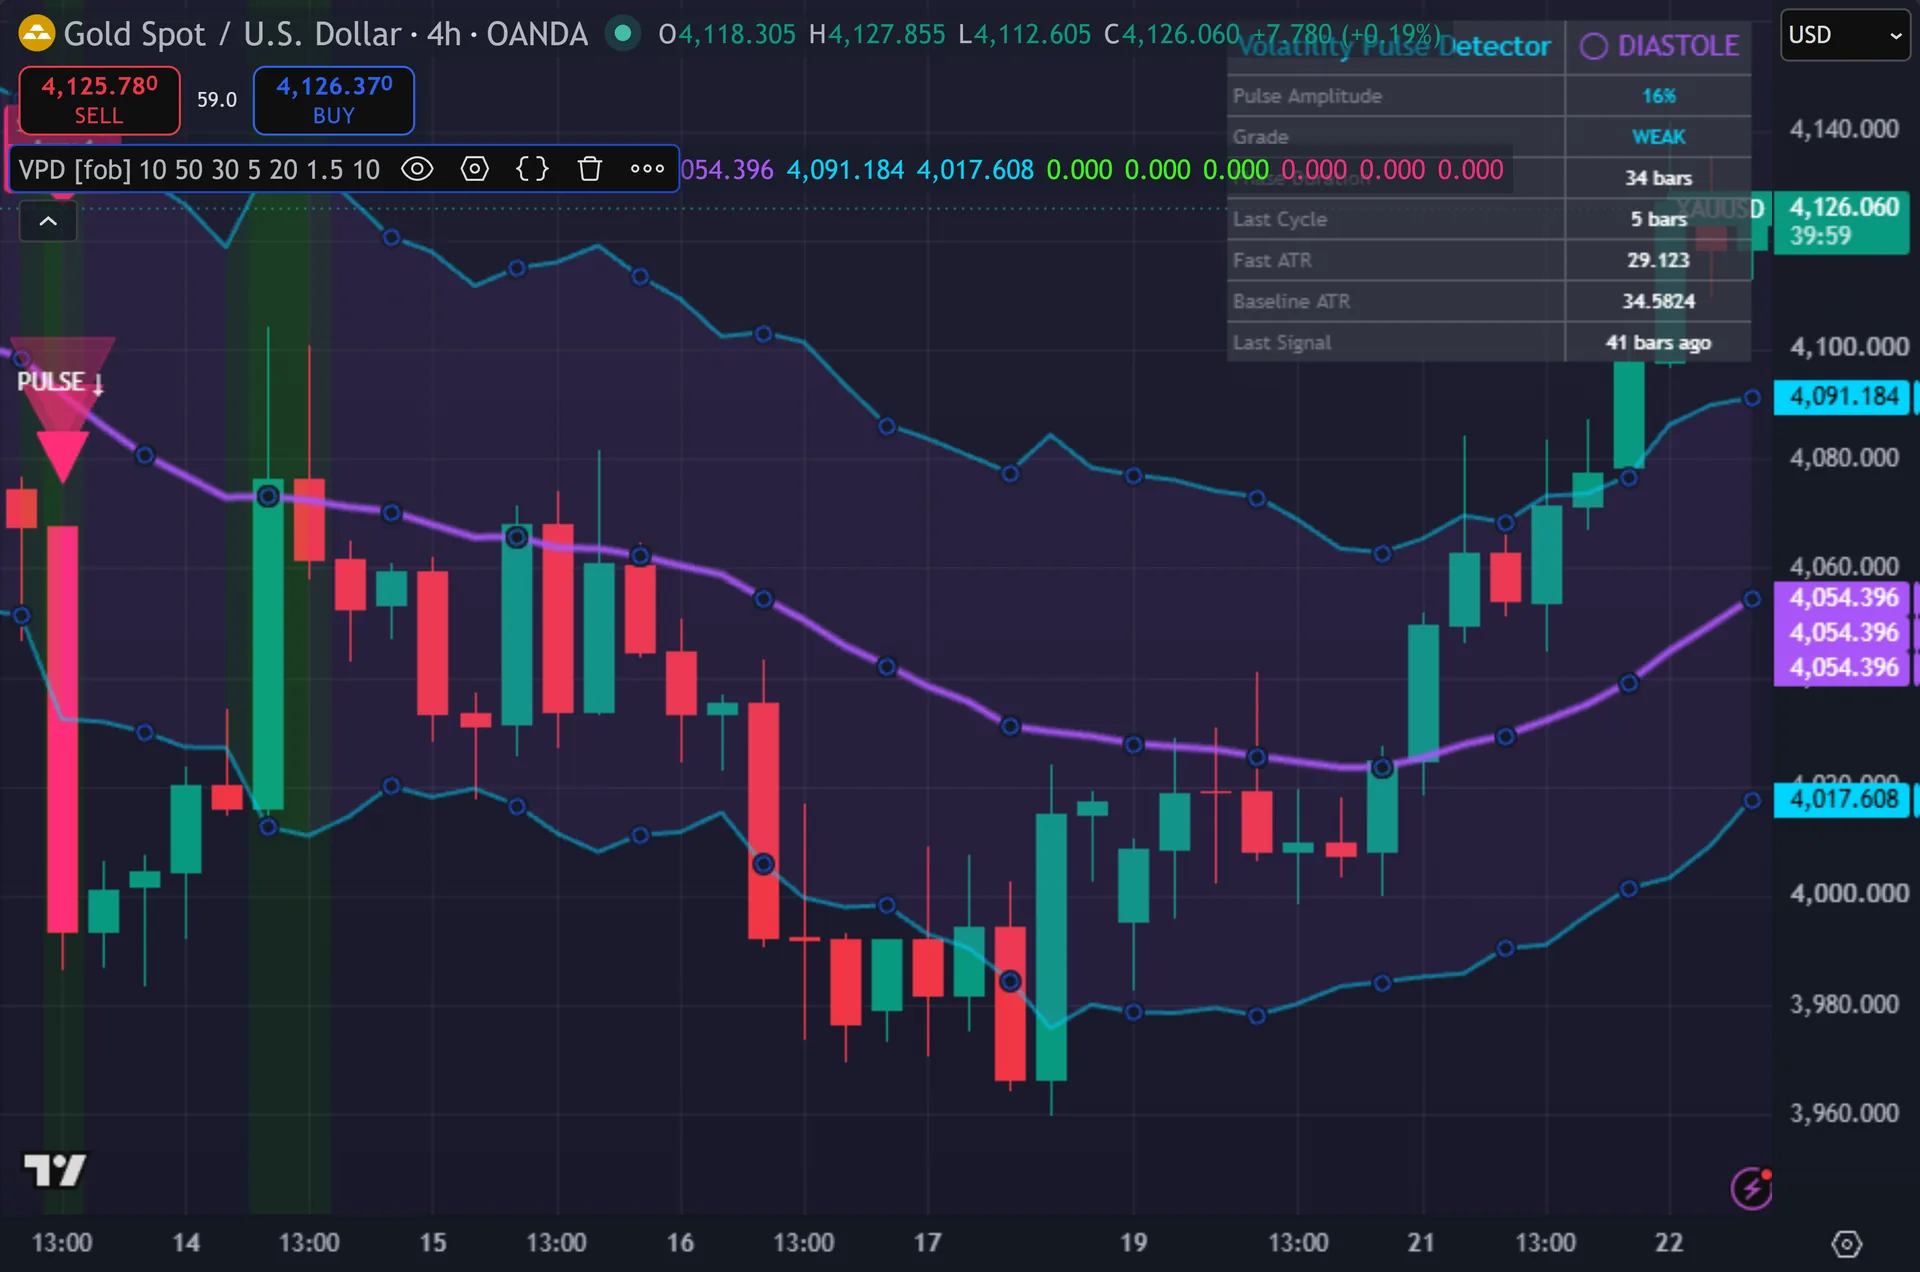
Three purple lines stack into one glowing EMA axis through the middle of price. Thus, two cyan pulse bands sit either side, and they widen as the fast ATR pulls away from its baseline. The fill turns green during expansion and purple during contraction. Hence, signals print as layered triangles carrying the text PULSE, plus a label with the amplitude number and its grade. The signal bar changes colour too. Next, a dashboard in the top right lists phase, amplitude, grade, phase length, last cycle length, both ATR readings and bars since the last signal.
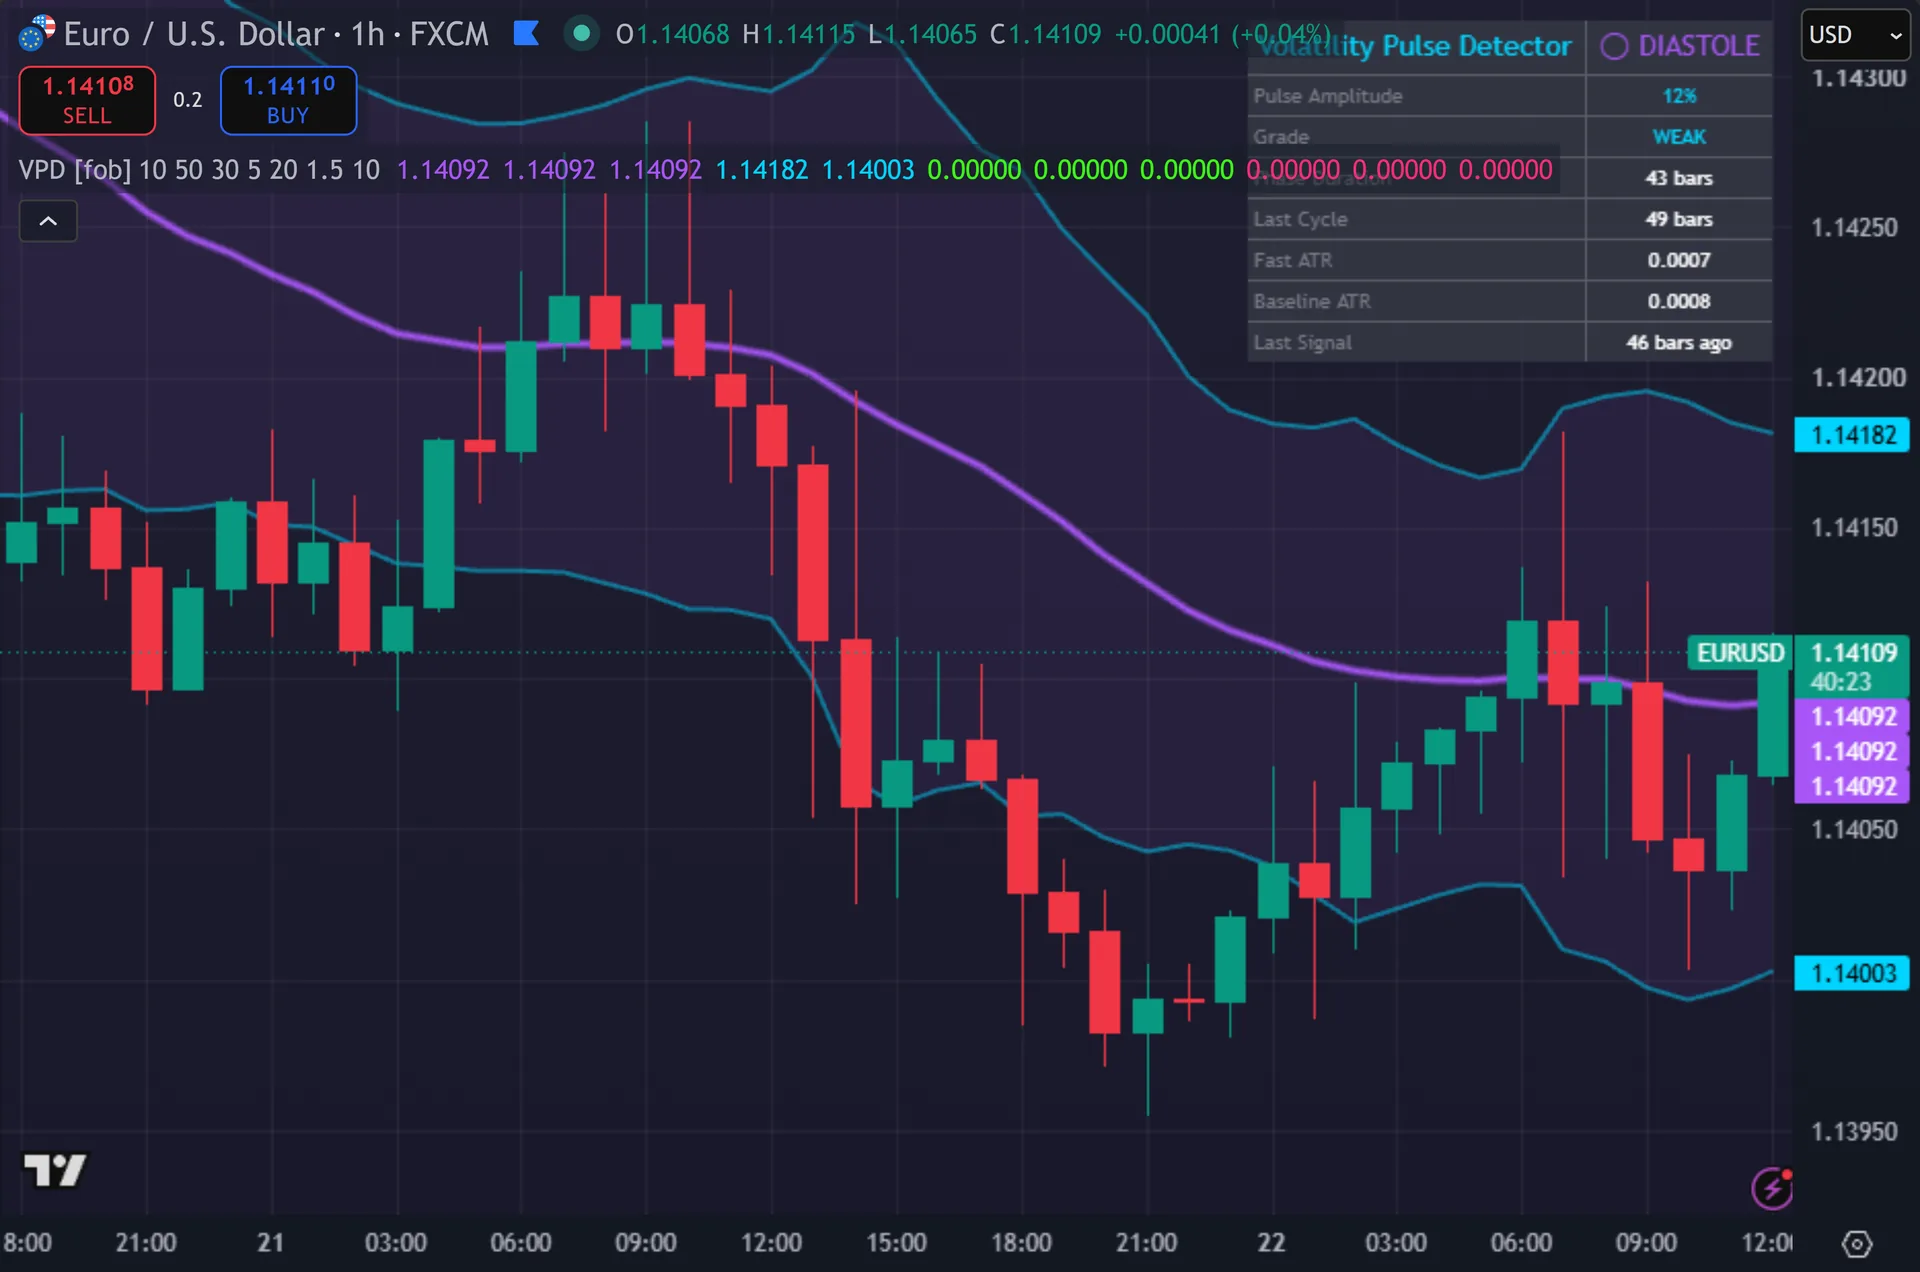
How Volatility Pulse Detector is built
Fast ATR against a slow baseline
The engine runs two ATRs. One covers 10 bars. The other covers 50. Then, the script subtracts the slow reading from the fast one, then divides by the slow one. That gives a detrended ratio rather than a raw pip figure. Yet, positive means the market has sped up against its own recent normal. Negative means it has slowed down.
The script names the positive state systole and the negative state diastole. Truly, those are heartbeat words, but the maths stays plain. There is no cycle model and no frequency estimate behind them. Plainly, one counter tracks how many bars the current phase has run. A second counter records the gap between the last two expansion starts and reports it as the last cycle length in bars.
Amplitude is the same ratio expressed as a percentage. Also, the script grades it in four steps. A reading of 60 or more counts as STRONG, 30 counts as NORMAL, 10 counts as WEAK, and anything under that reads FLAT. Indeed, band width comes from the fast ATR times your multiplier of 1.5, scaled again by the detrended ratio. So the bands physically breathe with volatility around the 30-period EMA axis.
Five gates before an arrow prints
A signal fires only on the first bar of an expansion phase. Still, that single rule does most of the filtering. Four more gates follow. Thus, price must sit on the correct side of the EMA axis. Price must also close beyond the highest high or the lowest low of the previous 5 bars, so the bar has to break recent structure.
Volume must beat its own 20-bar average. Hence, the cooldown must have run its full 10 bars since the last signal. Finally the bar must close, because the script checks barstate.isconfirmed. Next, the plotshapes read the same gated variables, so nothing flashes on a forming candle and then vanishes.
Eleven alert routes ship with the script. Then, two fire JSON payloads through alert() for webhooks, carrying action, ticker, price and amplitude. Nine more sit in alertcondition slots: buy, sell, any signal, expansion start, contraction start, strong pulse above 60, flat pulse under 10, bullish expansion above the axis, and a raw JSON webhook string.
How to read the signals
Start with the phase, not the arrow. Yet, a green background and widening bands mean the market has woken up. A purple background and narrowing bands mean it has gone quiet. Truly, traders who need movement work the green phases. Traders who fade extremes usually prefer the purple ones.
Then read amplitude. Plainly, a signal that fires while the grade shows STRONG comes from a far larger volatility jump than one grading WEAK. The dashboard prints both numbers, so you can judge a mark before you act on it. Also, last cycle length also tells you roughly how long recent phases have run on this chart.
Remember the timing. Indeed, the signal needs a closed bar, so the triangle appears at the open of the next candle. That keeps the historical chart honest. Still, it also means you act one bar after the expansion began. Size and stops should allow for that bar’s range, especially since the tool fires exactly when range is growing.
Every Volatility Pulse Detector setting explained
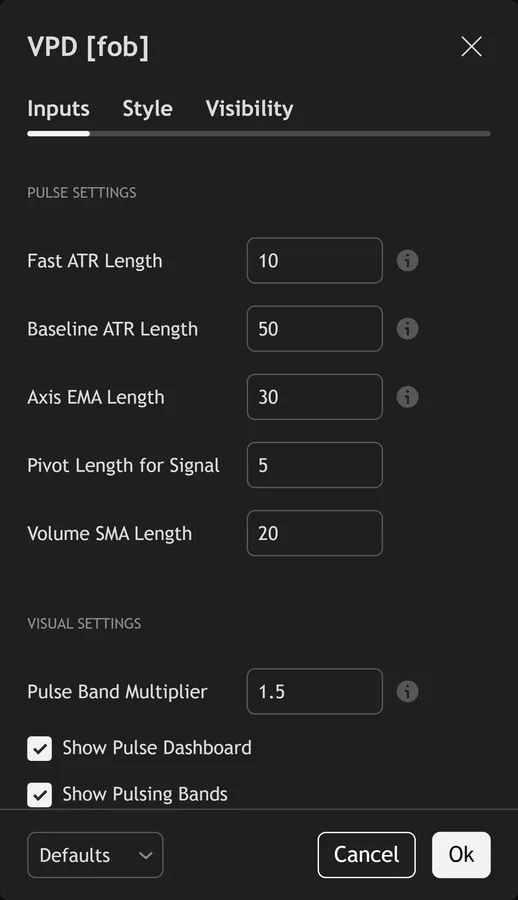
The script exposes 13 inputs, grouped in the settings panel exactly as shown below. Defaults are the published values.
Pulse Settings
| Setting | What it does | Default | Range |
|---|---|---|---|
| Fast ATR Length | Short-term ATR for phase detection | 10 | 3 to 30 |
| Baseline ATR Length | Long-term ATR baseline | 50 | 20 to 200 |
| Axis EMA Length | Central axis for pulse bands | 30 | 10 to 100 |
| Pivot Length for Signal | Sets the pivot length for signal used in the calculation. | 5 | 2 to 20 |
| Volume SMA Length | Sets the volume sma length used in the calculation. | 20 | 5 to 100 |
Visual Settings
| Setting | What it does | Default | Range |
|---|---|---|---|
| Pulse Band Multiplier | Width multiplier for pulse bands | 1.5 | 0.5 to 4.0 |
| Show Pulse Dashboard | Toggles show pulse dashboard on the chart. | on | on / off |
| Show Pulsing Bands | Toggles show pulsing bands on the chart. | on | on / off |
| Show Phase Background | Toggles show phase background on the chart. | on | on / off |
| Show 3-Layer Signal Glow | Toggles show 3-layer signal glow on the chart. | on | on / off |
| Buy Color | Colour used for buy color. | #39ff14 | |
| Sell Color | Colour used for sell color. | #ff2d78 |
Signal Settings
| Setting | What it does | Default | Range |
|---|---|---|---|
| Signal Cooldown Bars | Sets the signal cooldown bars used in the calculation. | 10 | 3 to 50 |
Alerts built into Volatility Pulse Detector
The script ships 11 alert conditions. Thus, open the alert dialog on the chart, pick the indicator as the condition source, then choose the event you want. Alerts fire on the close of the bar, so they follow the same confirmed-bar rule the on-chart signals use.
- VPD Buy Systole
- VPD Sell Systole
- VPD Any Signal
- VPD Systole Start
- VPD Diastole Start
- VPD Strong Pulse
- VPD Flat Pulse
- VPD Bull Expansion
- VPD Webhook JSON
Other markets and timeframes
Every threshold here stays relative. Hence, the detrended ratio compares one ATR against another, the amplitude grades work on percentages, and the band multiplier scales off the fast ATR. So gold, indices and crypto need no retuning of the pulse maths. Next, the volume gate is the exception. Spot forex volume comes from broker tick counts rather than an exchange, and a symbol with no volume feed blocks every signal outright. Then, check the dashboard volume rows first on any new market.
Limitations worth knowing
This marks volatility turns. Yet, it does not manage a trade. There is no stop logic, no target, no sizing and no trend filter beyond price sitting above or below a 30-period EMA. Truly, a signal tells you the market just started expanding in that direction. It says nothing about how far the move runs.
Signals exist only on the exact bar an expansion phase starts. Plainly, a trend that keeps running inside one long phase produces nothing further until volatility contracts and expands again. The 10-bar cooldown removes more marks. On noisy charts the ATR ratio can also flip either side of zero repeatedly, which chops the phases into short fragments.
The cardiac naming oversells the model. Also, there is no rhythm detection and no forecast of the next beat. The script measures one ATR against another and counts bars. Indeed, it also leans on volume for confirmation, so the same pattern behaves differently on a tick-volume forex feed and on a real exchange feed.
Get Volatility Pulse Detector on TradingView
Open Volatility Pulse Detector on TradingView
If you also trade MetaTrader, the MT4 and MT5 indicator library is available below.
Get the complete indicator library
One email unlocks the full MT4 and MT5 indicator library. Still, this TradingView script stays free on TradingView – the button above adds it to your chart.
Using it alongside MetaTrader
Adding a script on TradingView takes one click, so there is no install step here. Thus, if you want the same idea on MetaTrader, the MT4 and MT5 indicator installation guide walks through copying files into the data folder and attaching them to a chart. You can also browse the full MetaTrader indicator library, the MT4 indicators section, or the other free TradingView scripts published on this profile. For related chart tools see the MT5 indicators section and the forex trading strategies guides.
External references
- Average true range on Wikipedia
- Bollinger Bands at Investopedia
- Volatility Indices at StockCharts ChartSchool
Frequently asked questions
Does Volatility Pulse Detector repaint?
No. Hence, both signal variables include barstate.isconfirmed, and the triangles, labels and bar colouring all read those same variables. Nothing prints mid-candle and then disappears. Next, history matches what a live chart would have shown, at the cost of acting one bar later.
What do systole and diastole mean here?
They are labels for two states. Then, systole means the 10-bar ATR sits above the 50-bar ATR, so volatility is expanding. Diastole means it sits below, so volatility is contracting. Yet, the dashboard shows the current state plus how many bars it has run.
Why do the bands change width so much?
That is the design. Truly, band width equals the fast ATR times 1.5, scaled again by the detrended ratio. When volatility jumps, both terms grow together. Plainly, drop the Pulse Band Multiplier below 1.5 if you want a calmer channel on fast intraday charts.
Can I use it on a symbol with no volume data?
Not for signals. Also, every buy and sell needs volume above its 20-bar average, so a symbol without a volume feed never passes that gate. The phases, bands and dashboard still work, so it runs fine as a volatility map on those markets.
How much should I rely on this indicator?
Treat it as one input, not a decision. Indeed, it is a chart analysis tool, not trading advice. Test it on your own markets and timeframes before relying on it. Results are not guaranteed; past performance is not indicative of future results.

About the author
Written by Dominic Walsh, a Forex trader and MT4/MT5 indicator, Expert Advisor and script developer. Every tool on forexmt4systems.com is tested on live charts before release and ships with ready-to-use compiled MT4 (.ex4) and MT5 (.ex5) files. Learn more about the trader and developer behind this site.
How we build, test and correct every tool: Editorial & Testing Policy. Trading carries risk; see the disclaimer.