
Vortex Reversal Engine is a mean reversion strategy TradingView runs through its own backtest engine, not a plain overlay indicator. It fades stretched moves. Price has to reach a Bollinger extreme, RSI has to confirm the stretch and then turn back, and ADX has to say the market is ranging. Also, only then does the script place a simulated entry with an ATR stop and an ATR target attached.
It is free and open source. Indeed, you can add it to any chart from the Vortex Reversal Engine script page on TradingView, and the full Pine source is published there for you to read.
What Vortex Reversal Engine plots on the price chart
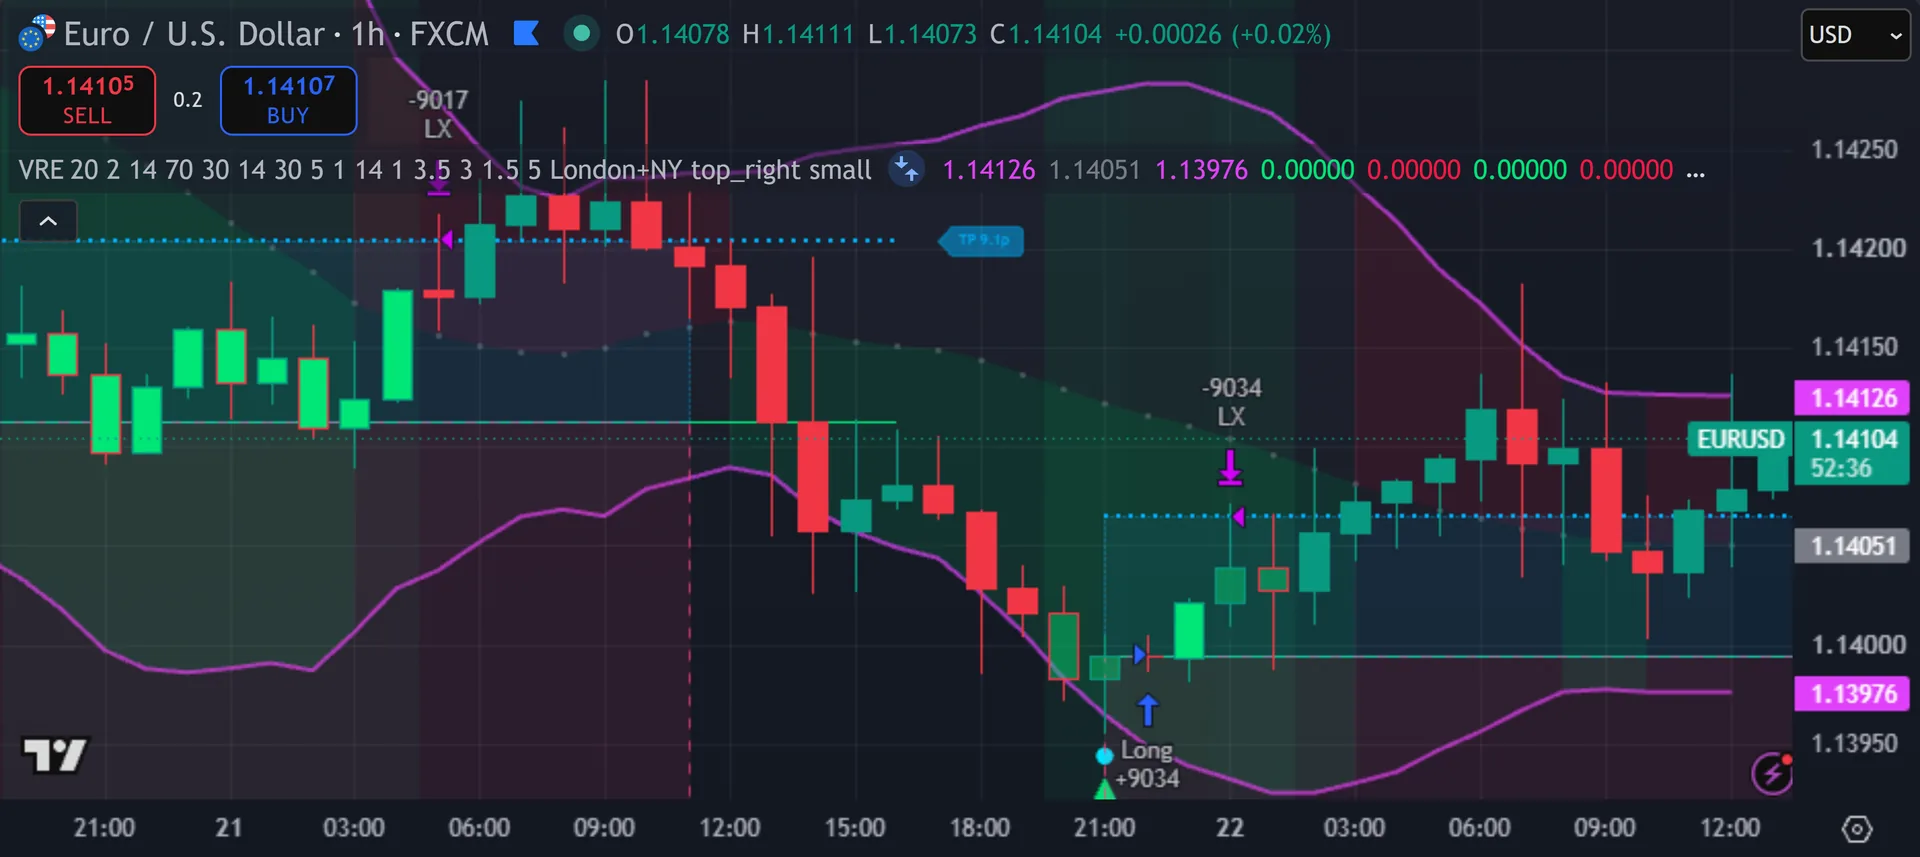
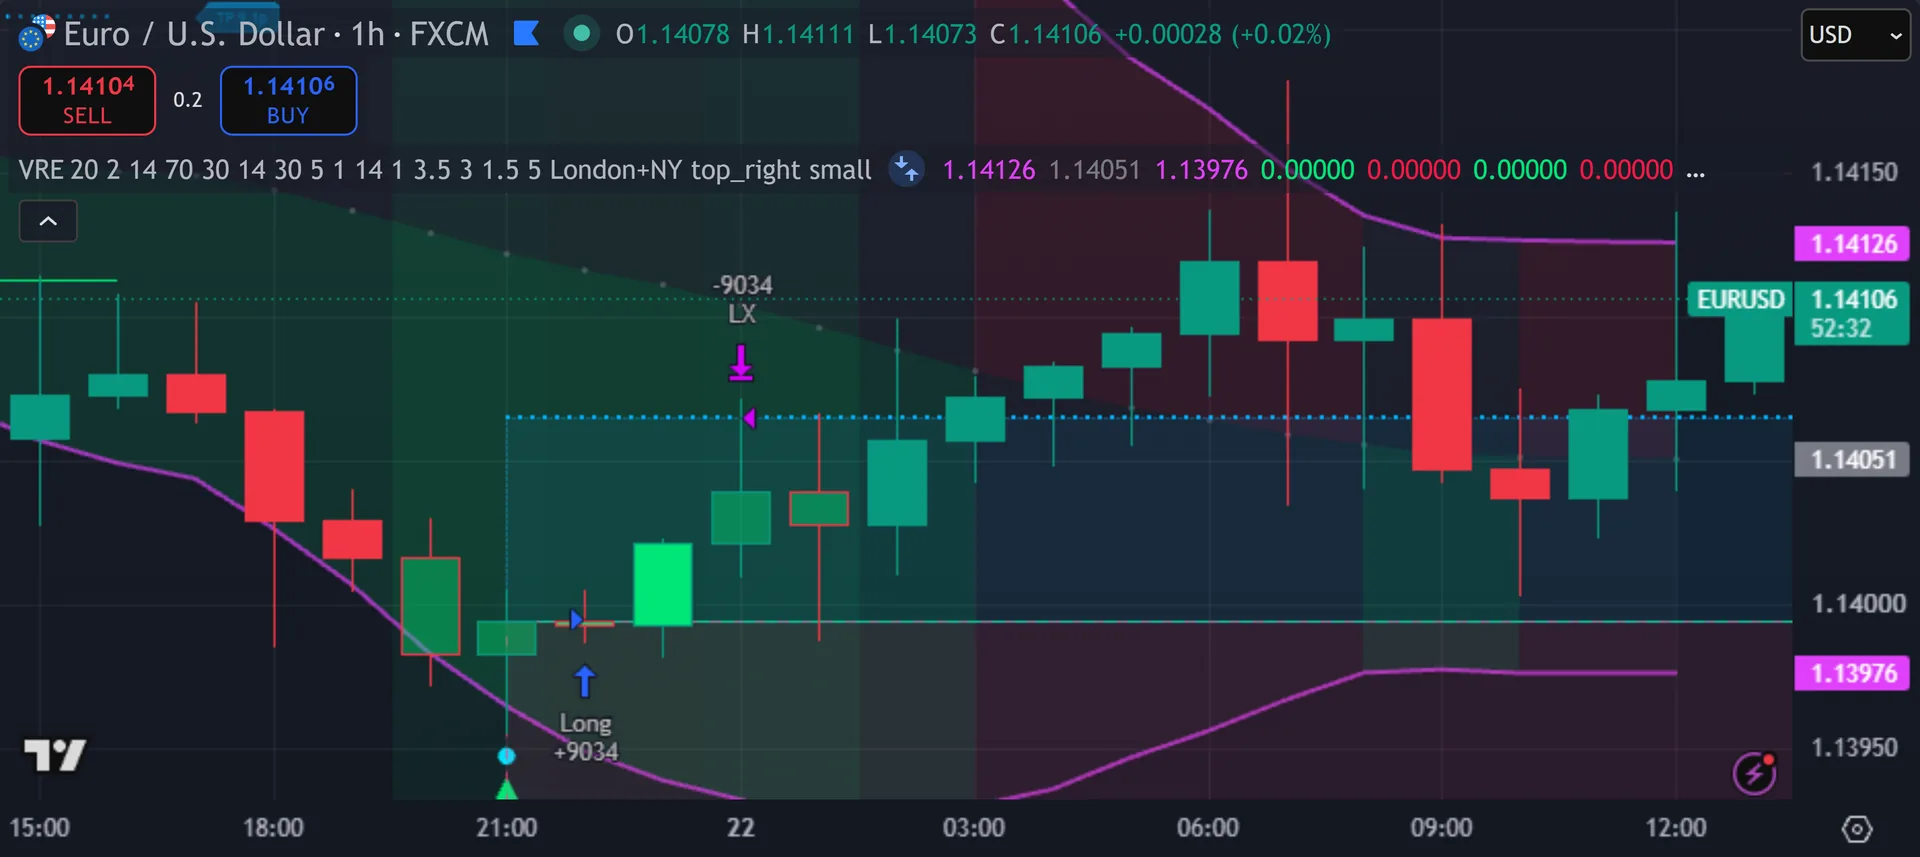
Bollinger Bands frame the chart with a dotted basis and a two-tone fill that shows which half price sits in. Still, entries print as triangles with BUY or SELL text, a glow circle and a small confirmation dot. Each entry then draws its own boxes and lines: a dashed stop level, a dotted target level, an entry line and pip-distance labels, all extended about 25 bars forward. Thus, background tints mark the stretched zones. A fifteen-row dashboard reports market state and backtest statistics.
How Vortex Reversal Engine is built
The four conditions behind an entry
The range filter runs first. Hence, the script reads ADX from ta.dmi with a length of 14 and allows trades only while ADX sits under 30. Mean reversion assumes the market keeps returning to a middle, so the strategy stands aside when the trend gauge climbs.
Then comes the stretch. Next, price must have touched the outer band within the last five bars – low at or under the lower band for longs, high at or above the upper band for shorts. Bands use a 20-bar SMA with 2.0 standard deviations. Then, RSI(14) must also have dropped under 30, or pushed over 70 for shorts, inside that same five-bar window.
Recovery comes third. Yet, RSI must now be rising and still under 55 for a long, or falling and still above 45 for a short. Price must have closed back inside the band while staying on its own side of the basis, which leaves room to revert. Truly, the bar must also close as a reversal candle, above its own midpoint for a long. A five-bar cooldown, a flat-position check and barstate.isconfirmed gate the rest.
Exits, sizing and what the backtest assumes
Every entry ships with a bracket. Plainly, the target sits 1.0 ATR(14) from entry and the stop sits 3.5 ATR away. That asymmetry is deliberate: a near target gets hit often, and a far stop survives noise at the extreme. Also, it also means one stopped trade offsets roughly three and a half winners, so a high share of winning trades tells you little on its own. Read total pips and profit factor next to it.
Partial Exit Mode, off by default, splits the position. Indeed, half exits at the 1.0 ATR target and the rest runs toward 3.0 ATR with an optional 1.5 ATR trailing stop. An optional session filter restricts entries to Asia, London, New York or the combined London and New York block, using UTC hours.
The declaration matters as much as the logic. Still, it sets 10,000 USD of starting capital, sizes every entry at 100 percent of equity, applies zero commission and one tick of slippage. Those defaults flatter any equity curve. Thus, set a realistic commission and a fixed position size before you read anything into the results.
How to read the signals
The dashboard splits in two. Hence, the top rows describe the market right now: Bollinger width as SQUEEZE, NORMAL or WIDE, the ADX reading with RANGE or TREND beside it, and the RSI state. Those rows tell you whether conditions match what the strategy wants.
Everything under the PERFORMANCE header is backtest output. Next, trades, winners and losers, profit factor, total pips, net profit, average win against average loss, streaks and maximum drawdown all come from simulated fills on the history your chart holds. They describe one past sample. Then, they are not a forecast, and they change whenever you switch symbol, feed or date range.
Watch the reversal-zone background too. Yet, it lights up when price sits at a band extreme with RSI stretched, before any entry exists. That is the setup forming. Truly, whether an entry follows depends on RSI turning, the candle closing correctly and ADX staying under the limit.
Every Vortex Reversal Engine setting explained
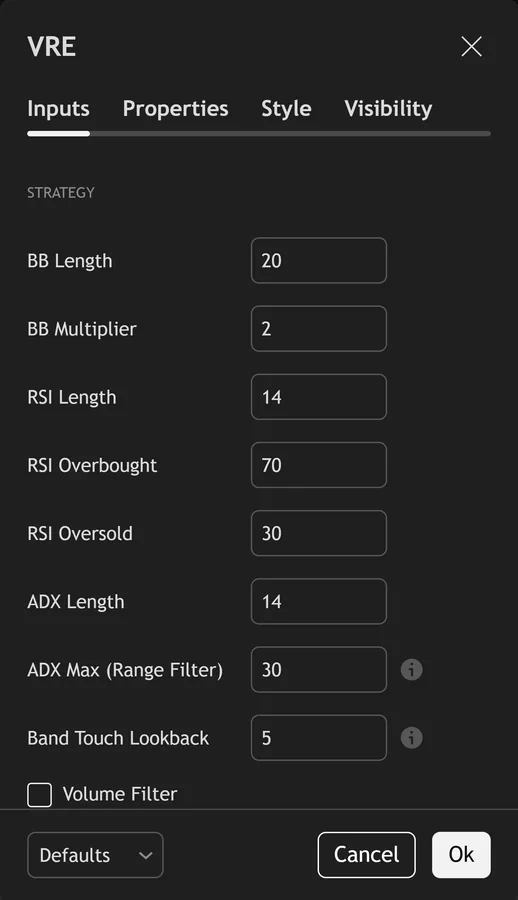
The script exposes 34 inputs, grouped in the settings panel exactly as shown below. Defaults are the published values.
Strategy
| Setting | What it does | Default | Range |
|---|---|---|---|
| BB Length | Sets the bb length used in the calculation. | 20 | 5 to 50 |
| BB Multiplier | Sets the bb multiplier used in the calculation. | 2.0 | 1.0 to 4.0 |
| RSI Length | Sets the rsi length used in the calculation. | 14 | 2 to 50 |
| RSI Overbought | Sets the rsi overbought used in the calculation. | 70 | 55 to 90 |
| RSI Oversold | Sets the rsi oversold used in the calculation. | 30 | 10 to 45 |
| ADX Length | Sets the adx length used in the calculation. | 14 | 5 to 50 |
| ADX Max (Range Filter) | Only trade when ADX is BELOW this — confirms ranging market where mean-reversion works | 30.0 | 15 to 50 |
| Band Touch Lookback | How many bars back to check for BB touch | 5 | 1 to 15 |
| Volume Filter | Toggles volume filter on the chart. | off | on / off |
| Volume Filter × | Sets the volume filter × used in the calculation. | 1.0 | 0.5 to 3.0 |
Risk Management
| Setting | What it does | Default | Range |
|---|---|---|---|
| ATR Length | Sets the atr length used in the calculation. | 14 | 5 to 50 |
| TP ATR Mult | Take profit = ATR × this (closer = more frequent target hits) | 1.0 | 0.5 to 5.0 |
| SL ATR Mult | Stop loss = ATR × this (wider = less likely hit at extremes) | 3.5 | 1.0 to 6.0 |
| Partial Exit Mode | ON: 50% at TP1, trail rest to TP2. | off | on / off |
| TP2 ATR Mult (partial) | Sets the tp2 atr mult (partial) used in the calculation. | 3.0 | 1.0 to 8.0 |
| Trailing Stop (partial) | Toggles trailing stop (partial) on the chart. | on | on / off |
| Trail ATR Mult | Sets the trail atr mult used in the calculation. | 1.5 | 0.5 to 4.0 |
Filters
| Setting | What it does | Default | Range |
|---|---|---|---|
| Signal Cooldown (bars) | Sets the signal cooldown (bars) used in the calculation. | 5 | 1 to 50 |
| Session Filter | Toggles session filter on the chart. | off | on / off |
| Session | Choose the session from the listed options. | London+NY | Asia, London, New York, London+NY |
Display
| Setting | What it does | Default | Range |
|---|---|---|---|
| Show Dashboard | Toggles show dashboard on the chart. | on | on / off |
| Show Bollinger Bands | Toggles show bollinger bands on the chart. | on | on / off |
| Show Signal Glow | Toggles show signal glow on the chart. | on | on / off |
| Show SL/TP Zones | Toggles show sl/tp zones on the chart. | on | on / off |
| Color Bars | Toggles color bars on the chart. | on | on / off |
| Table Position | Choose the table position from the listed options. | top_right | top_left, top_center, top_right, bottom_left, bottom_center, bottom_right |
| Text Size | Choose the text size from the listed options. | small | tiny, small, normal |
Colors
| Setting | What it does | Default | Range |
|---|---|---|---|
| Neon Bull | Colour used for neon bull. | #00E676 | |
| Neon Bear | Colour used for neon bear. | #FF1744 | |
| TP | Colour used for tp. | #00B0FF | |
| TP2 | Colour used for tp2. | #FFD740 | |
| Stop Loss | Colour used for stop loss. | #FF4081 | |
| BB Bands | Colour used for bb bands. | #E040FB | |
| Neutral | Colour used for neutral. | #787B86 |
Alerts built into Vortex Reversal Engine
The script ships 5 alert conditions. Plainly, open the alert dialog on the chart, pick the indicator as the condition source, then choose the event you want. Alerts fire on the close of the bar, so they follow the same confirmed-bar rule the on-chart signals use.
- Bullish Reversal
- Bearish Reversal
- Any Reversal
- Oversold Zone
- Overbought Zone
Other markets and timeframes
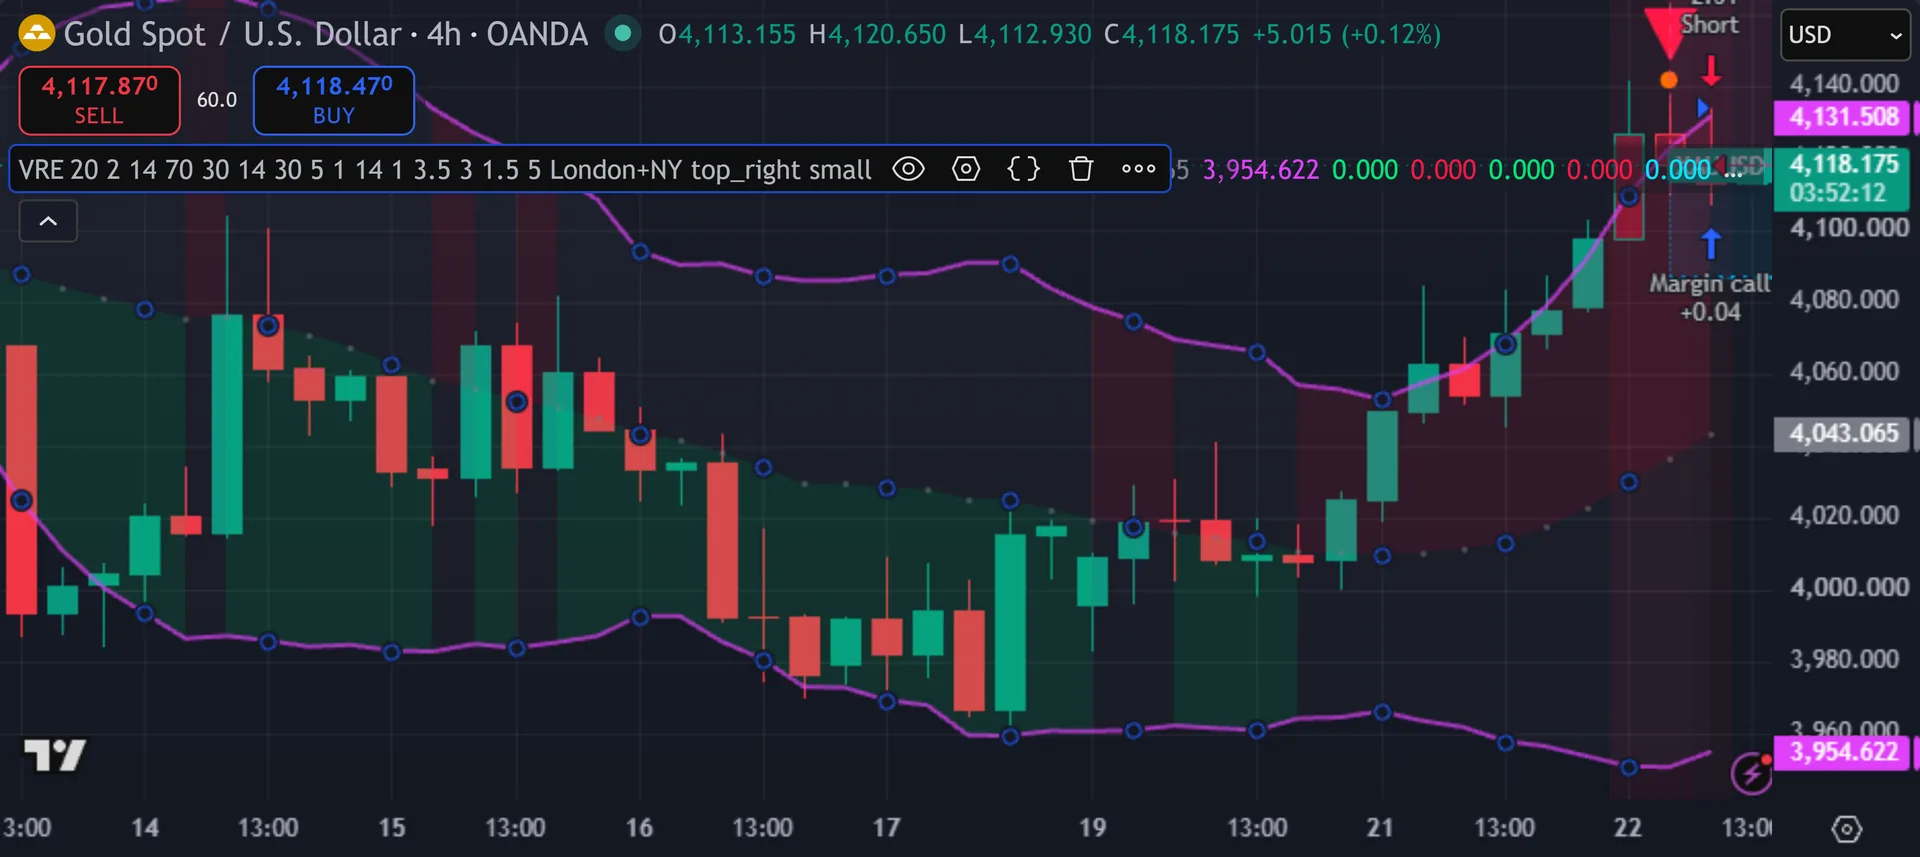
The signal logic stays fully relative – bands from standard deviation, RSI, ADX and ATR-based exits – so it transfers to indices, crypto, gold and stocks. Two parts do not. The pip conversion assumes forex, multiplying mintick by 100 on JPY pairs and by 10 elsewhere, so pip readouts on an index or a crypto pair become arbitrary units. Also, the session filter also uses UTC forex hours. On those markets, read net profit and the R ratio instead of the pip figures.
Limitations worth knowing
This is a strategy script, so it produces backtest results rather than a study you simply overlay. Indeed, those results come from simulated orders on historical bars. A past simulation is not evidence about future trades, and the numbers move whenever you change symbol, timeframe or data range.
Same-bar exits are a known modelling gap. Still, with a 1.0 ATR target and a 3.5 ATR stop, both levels can fall inside one candle. The tester cannot see which one price touched first without bar magnifier data, so it applies its own assumption. Treat borderline results with care.
It holds one position at a time and takes a new signal only while flat. Thus, it carries no trend context beyond the ADX filter, no news awareness and no dynamic sizing. The ADX gate under 30 also means it skips trending markets by design, so long stretches can pass with no trades at all.
Get Vortex Reversal Engine on TradingView
Open Vortex Reversal Engine on TradingView
If you also trade MetaTrader, the MT4 and MT5 indicator library is available below.
Get the complete indicator library
One email unlocks the full MT4 and MT5 indicator library. Hence, this TradingView script stays free on TradingView – the button above adds it to your chart.
Using it alongside MetaTrader
Adding a script on TradingView takes one click, so there is no install step here. Next, if you want the same idea on MetaTrader, the MT4 and MT5 indicator installation guide walks through copying files into the data folder and attaching them to a chart. You can also browse the full MetaTrader indicator library, the MT4 indicators section, or the other free TradingView scripts published on this profile. For related chart tools see the MT5 indicators section and the forex trading strategies guides.
External references
- Average true range on Wikipedia
- Bollinger Bands at Investopedia
- Arthur Hill On Goals Style And Strategy at StockCharts ChartSchool
Frequently asked questions
Is Vortex Reversal Engine an indicator or a strategy?
A strategy. Then, the script opens with strategy() rather than indicator(), so it places simulated orders and fills the Strategy Tester tab. You can still read the arrows as signals on the chart, but the dashboard numbers are backtest output from historical fills.
Does it repaint?
Entries do not. Yet, both signals require barstate.isconfirmed, so they evaluate only on a closed bar, and the plotted triangles come from those same gated variables. The dashboard updates live on the last bar, as any Pine table does.
Why does it refuse to trade in a strong trend?
By design. Truly, the ADX(14) filter blocks entries once ADX reaches 30. Fading a band extreme inside a strong trend means selling into strength, which is exactly what the filter exists to avoid. Plainly, raise ADX Max if you want the script to try anyway.
Should I trust the performance table?
Treat it as a description of one historical sample, nothing more. Also, default sizing uses 100 percent of equity with zero commission, which flatters the curve. Set your own commission, use a fixed quantity, then compare several symbols and date ranges before you draw conclusions.
How much should I rely on this indicator?
Treat it as one input, not a decision. Indeed, it is a chart analysis tool, not trading advice. Test it on your own markets and timeframes before relying on it. Results are not guaranteed; past performance is not indicative of future results.

About the author
Written by Dominic Walsh, a Forex trader and MT4/MT5 indicator, Expert Advisor and script developer. Every tool on forexmt4systems.com is tested on live charts before release and ships with ready-to-use compiled MT4 (.ex4) and MT5 (.ex5) files. Learn more about the trader and developer behind this site.
How we build, test and correct every tool: Editorial & Testing Policy. Trading carries risk; see the disclaimer.