
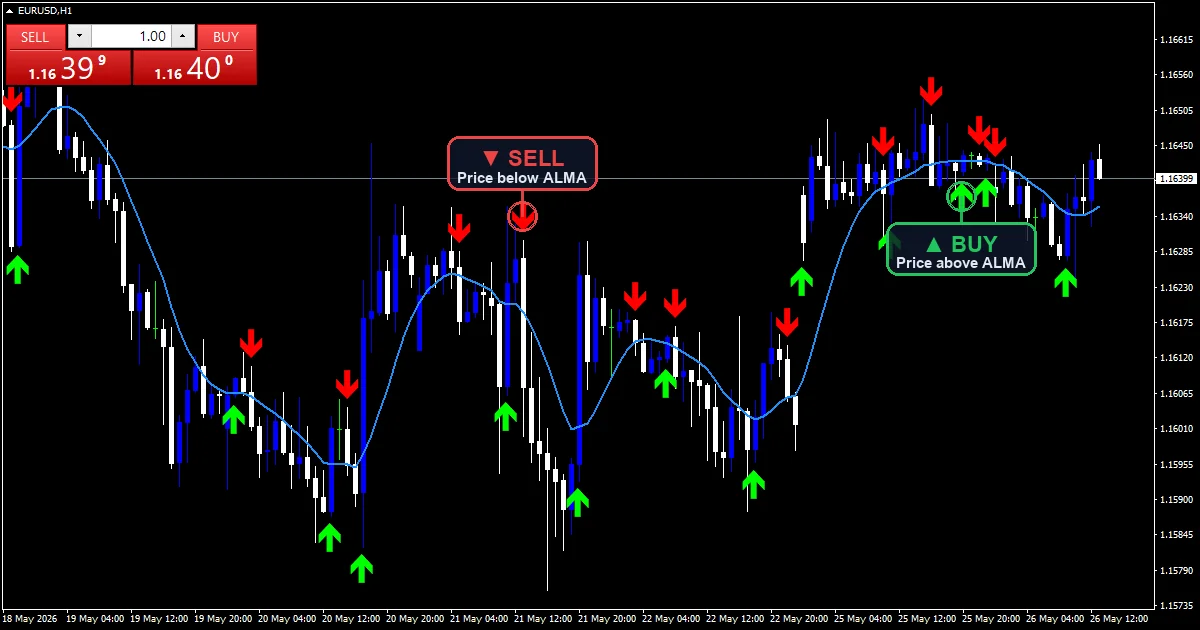
The alma indicator smooths price with a Gaussian weighting curve rather than a flat or linear one. Offset slides that curve towards the newest bars, and Sigma controls how sharply it peaks. The ALMA line sits over the candles, with Buy and Sell arrows on every crossing.
This build ships as a compiled .ex4 for MT4 and .ex5 for MT5; the screenshots below come from EURUSD H1.
| Platforms | MT4 (.ex4) + MT5 (.ex5) |
|---|---|
| Chart window | Main price chart |
| Plots | 3: ALMA, Buy, Sell |
| Alerts | popup, push notification, email, sound |
| Inputs | 10 |
Plots this indicator declares
ALMA (blue line) is the weighted average, drawn over the price candles.
Buy (lime, code 233) sits under the low when a close crosses up through the line.
Sell (red, code 234) sits above the high on the downward crossing.
- ALMA: line, dodger blue, width 2
- Buy: arrow, lime, width 4, arrow code 233
- Sell: arrow, red, width 4, arrow code 234
How it builds its numbers
Building the weight curve
Two numbers shape that curve. Peak position comes from Offset multiplied by AlmaPeriod minus one, and curve width comes from AlmaPeriod divided by Sigma.
Every bar in the window then earns a weight from a bell shaped function of how far it sits from that peak. Bars near the peak count heavily, and bars at either end count for very little.
Applying the weights
Closes in the window get multiplied by their weights and summed. At an Offset of 0.85 the peak sits well towards the recent end, so newer bars dominate the result.
That is what makes this hug price more closely than a simple average of the same length while still filtering single bar noise.
The crossing arrows
An arrow needs the previous close on one side of the line and the current close on the other. Both values come from bars that have already printed.
ArrowOffsetPoints then sets how far the marker sits from its candle, which is cosmetic and never touches the test.
How to judge the output
ALMA turning while price pulls away from it is the setup these arrows are built around.
A high Offset makes the line track price tightly, so crossings arrive often.
A high Sigma narrows the weight curve and gives a smoother line, since fewer bars carry real weight.
The calculation needs a full AlmaPeriod window, so the left edge of a fresh chart stays blank.
Alert channels in this build: popup, push notification, email and sound, one message per closed bar.
Alerts run through popup, push, email and sound on each crossing. A bar time check keeps it to one alert per closed bar.
Every ALMA Indicator input
Core settings
| Setting | What it does | Default |
|---|---|---|
AlmaPeriod |
AlmaPeriod is how many closes go into the weighted average. It defaults to 21. | 21 |
Offset |
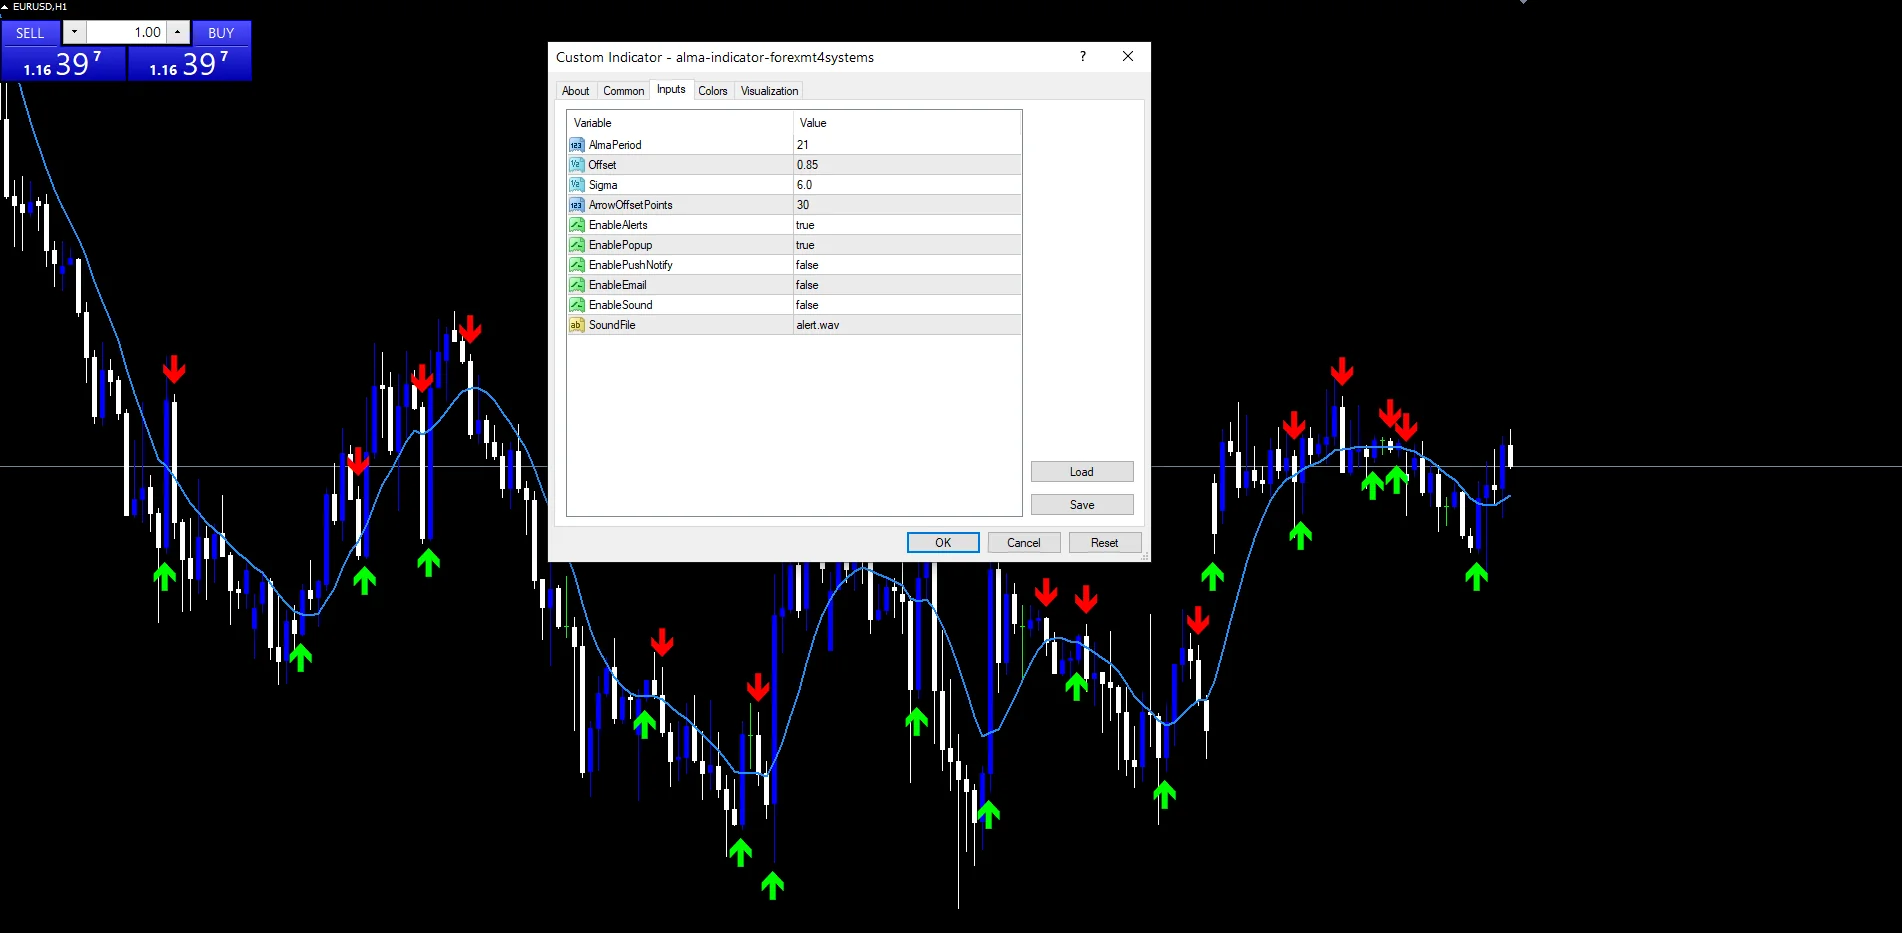
Offset slides the weight peak towards the newest bar, on a scale from 0 to 1. It defaults to 0.85, which is heavily recency weighted. | 0.85 |
Sigma |
Sigma controls how sharply the weight curve peaks. It defaults to 6.0, and larger values concentrate the weight into fewer bars. | 6.0 |
Display settings
| Setting | What it does | Default |
|---|---|---|
ArrowOffsetPoints |
ArrowOffsetPoints is the cosmetic gap between an arrow and its candle, 30 points by default. | 30 |
Alert settings
| Setting | What it does | Default |
|---|---|---|
EnableAlerts |
(see inputs panel) | on |
EnablePopup |
(see inputs panel) | on |
EnablePushNotify |
(see inputs panel) | off |
EnableEmail |
(see inputs panel) | off |
EnableSound |
(see inputs panel) | off |
SoundFile |
(see inputs panel) | alert.wav |
Markets and timeframes
The screenshot uses EURUSD H1. Twenty one bars on H1 covers about a day, which suits pairs that trend within a session. On H4 and daily the same window becomes a swing line with far fewer crossings. On M1 and M5 the recency weighting tracks price so closely that a crossing loses most of its meaning.
When to distrust it
Weighting towards recent bars buys responsiveness and pays for it with false crossings in a range.
Offset and Sigma interact, so changing one without the other can produce a line behaving nothing like you expected.
These arrows mark a crossing and nothing else. No trend filter, level or volatility check sits behind them.
At an Offset near 1 the line follows price so closely that a crossing barely leads anything at all.
Copy the compiled ALMA Indicator file into your MQL4/Indicators folder, and the MT5 build into MQL5/Indicators, then restart the terminal and drag it onto a chart. The step-by-step guide with screenshots is at how to install MT4 and MT5 indicators.
Background reading on the method behind the ALMA Indicator: Volume–price trend on Wikipedia, Decisionpoint Trend Model at StockCharts ChartSchool.
Download the ALMA Indicator for MT4 and MT5
The zip holds the compiled ALMA Indicator build for MT4 and MT5, plus a short README. Compiled files only, no source. Enter your email below and the download link arrives in your inbox.
Download this indicator free
Enter your email and the file is yours. You also get the full MT4 and MT5 library.
FAQ
What does Offset at 0.85 do to the weighting?
It slides the peak of the weight curve towards the newest bars. At 0.85 that peak sits about eighty five percent of the way along the window, so recent closes carry most of the weight. Dropping Offset towards 0.5 centres the curve and gives a slower, more symmetric line.
How does Sigma change the ALMA line?
Sigma divides into AlmaPeriod to set the width of the weight curve. A larger Sigma narrows that curve, so fewer bars carry real weight and the line comes out smoother. Lower it and the weighting spreads across the window, bringing the result closer to a plain average.
Why is there no arrow on the very first bars of the chart?
The calculation reserves AlmaPeriod plus two bars at the oldest end, since a full window has to exist before a weighted value means anything. Both the line and the Buy and Sell arrows start after that point, so the left edge stays empty by design.
Does ArrowOffsetPoints affect when a crossing counts?
No. The crossing test compares the previous close and the current close against the line. ArrowOffsetPoints only decides how far the marker gets drawn from its candle, 30 points by default, so the wick stays readable underneath.
Are results guaranteed?
No. Trading involves risk. Results are not guaranteed; past performance is not indicative of future results. Use the ALMA Indicator as one input. Always backtest before trading live.
Category: this is part of our Trend collection. Then, still, browse more Trend for MetaTrader, or explore every MT4 indicator and MT5 indicator on the site.
External references
- The core method is documented in Volume–price trend on Wikipedia.
- Additional market context is at Decisionpoint Trend Model at StockCharts ChartSchool.

About the author
Written by Dominic Walsh, a Forex trader and MT4/MT5 indicator, Expert Advisor and script developer. Every tool on forexmt4systems.com is tested on live charts before release and ships with ready-to-use compiled MT4 (.ex4) and MT5 (.ex5) files. Learn more about the trader and developer behind this site.
How we build, test and correct every tool: Editorial & Testing Policy. Trading carries risk; see the disclaimer.