
The ao divergence indicator reads the Awesome Oscillator without drawing it. Each bar that sets a fresh low across `DivLookback` bars gets compared with the old low. The code checks the oscillator at both. A lower price with a higher reading is bullish disagreement, and the arrow lands on price.
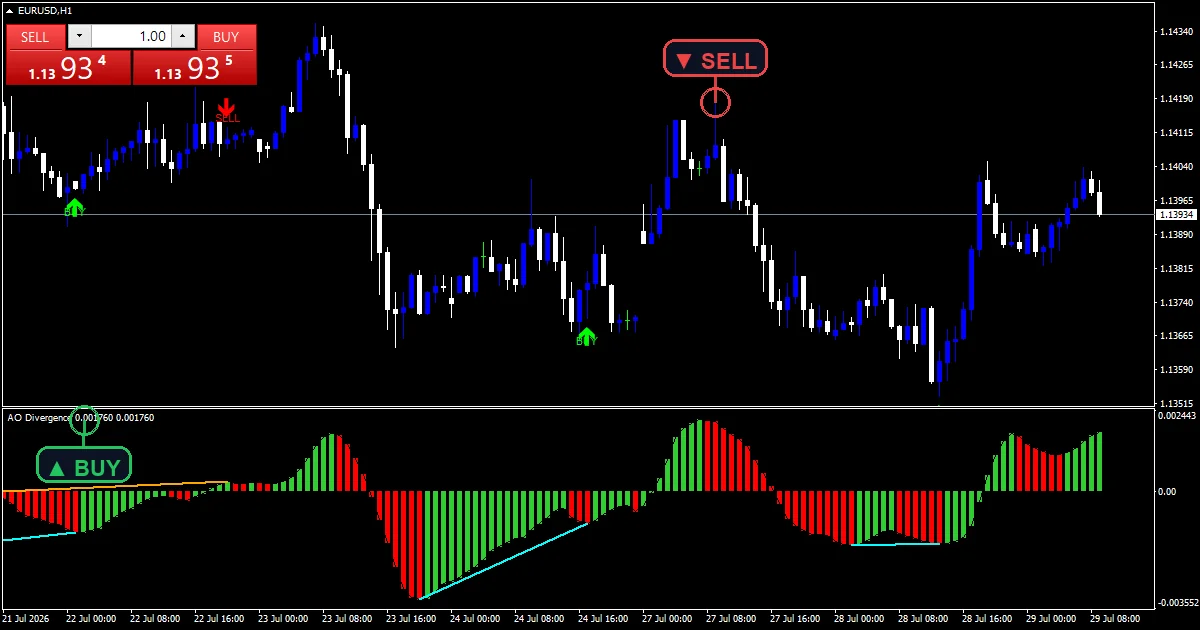
This build ships as a compiled .ex4 for MT4 and .ex5 for MT5; the screenshots below come from EURUSD H1.
| Platforms | MT4 (.ex4) + MT5 (.ex5) |
|---|---|
| Chart window | Main price chart |
| Plots | 2: Bull divergence, Bear divergence |
| Alerts | popup, push notification, email, sound |
| Inputs | 8 |
The plots this build puts on screen
Bull divergence places a lime arrow under a bar that made a lower low with a stronger oscillator.
Bear divergence places a red arrow above the mirror case.
Both arrows sit `ArrowOffsetPoints` from the candle, which defaults to `30`.
The oscillator itself stays internal, so the price chart carries only the two marks.
- Bull divergence: arrow, lime, width 3, arrow code 233
- Bear divergence: arrow, red, width 3, arrow code 234
How the calculation works
Locating the previous extreme
iLowest scans `DivLookback` `30` bars, starting one bar back. It returns the index of the lowest low. iHighest does the same at the top. Starting the scan a bar back keeps the current candle out of its own comparison.
Comparing price with the oscillator
A bullish mark needs the current low below the low at that older index. It also needs iAO now to read higher than iAO there. Price made a new low. The oscillator did not follow. The bearish case reverses both tests.
Why this differs from a pivot method
Most divergence tools wait for confirmed swing pivots. That costs several bars. This one compares against a rolling extreme instead. So a mark can appear on the bar that sets the new low. The trade is speed against a looser idea of a swing.
What to look for
An arrow means the new extreme was not confirmed by momentum.
Marks can appear several bars running while price grinds to fresh lows.
Widen `DivLookback` to compare against a genuinely older extreme.
Treat clusters as one observation rather than several.
Alert channels in this build: popup, push notification, email and sound, one message per closed bar.
`EnableAlerts` ships on with `EnablePopup` carrying the message. `EnablePushNotify`, `EnableEmail` and `EnableSound` are off by default, and `SoundFile` names the clip. The guard allows one message per closed bar.
Every AO Divergence Indicator input
Core settings
| Setting | What it does | Default |
|---|---|---|
DivLookback |
Bars scanned for the previous extreme, default `30`. Widen it for rarer and more meaningful comparisons. | 30 |
Display settings
| Setting | What it does | Default |
|---|---|---|
ArrowOffsetPoints |
Gap in points between a divergence arrow and its candle, default `30`. | 30 |
Alert settings
| Setting | What it does | Default |
|---|---|---|
EnableAlerts |
Turns the channels on as a group, default `true`. | on |
EnablePopup |
Raises the terminal dialog on a divergence, default `true`. | on |
EnablePushNotify |
Pushes the divergence through to your phone, default `false`. | off |
EnableEmail |
Sends the divergence by mail, default `false`. | off |
EnableSound |
Plays a sound when a divergence prints, default `false`. | off |
SoundFile |
File the sound channel reaches for, default `alert.wav`. | alert.wav |

Setting it up somewhere useful
EURUSD H1 is the reference chart. There `DivLookback` at `30` covers a little over a day. Momentum disagreement needs room to develop. Shorter timeframes tend to produce clusters of small marks. On H4 the same setting spans a week, and each comparison carries more weight.
What it misses
A rolling extreme is not a pivot, so the older reference can shift as the window moves.
Marks arrive in runs when price makes several new lows in a row.
The Awesome Oscillator lags price by design. Some disagreement is simply that lag.
Copy the compiled AO Divergence Indicator file into your MQL4/Indicators folder, and the MT5 build into MQL5/Indicators, then restart the terminal and drag it onto a chart. The step-by-step guide with screenshots is at how to install MT4 and MT5 indicators.
Download the AO Divergence Indicator for MT4 and MT5
The zip holds the compiled AO Divergence Indicator build for MT4 and MT5, plus a short README. Compiled files only, no source. Enter your email below and the download link arrives in your inbox.
Download this indicator free
Enter your email and the file is yours. You also get the full MT4 and MT5 library.
FAQ
What does DivLookback at 30 compare against?
The lowest low or highest high across the previous thirty bars. iLowest and iHighest return that index. The current bar is then measured against it. Widen the setting and the comparison reaches further back, which makes each mark rarer.
Why does the Awesome Oscillator stay hidden?
Because this build needs the values, not the picture. iAO supplies a reading at each index and the code compares two of them. Keeping the histogram off the chart leaves the two arrow plots as the only thing you have to read.
How is this different from a pivot divergence tool?
Pivot methods wait for a swing to confirm on both sides. That costs bars. This one measures against a rolling extreme. So a Bull divergence mark can land on the bar that sets the new low. Faster, but the reference point is looser.
Why do Bull divergence marks appear in runs?
Because each new low inside the window triggers its own test. Price can grind down over several bars while the oscillator drifts sideways. Every one of those bars then qualifies. Read the run as a single observation, not as several.
Are results guaranteed?
No. Trading involves risk. Results are not guaranteed; past performance is not indicative of future results. Use the AO Divergence Indicator as one input. Always backtest before trading live.
External references
- The core method is documented in FIXatdl on Wikipedia.
- Additional market context is at CCI Correction at StockCharts ChartSchool.

About the author
Written by Dominic Walsh, a Forex trader and MT4/MT5 indicator, Expert Advisor and script developer. Every tool on forexmt4systems.com is tested on live charts before release and ships with ready-to-use compiled MT4 (.ex4) and MT5 (.ex5) files. Learn more about the trader and developer behind this site.
How we build, test and correct every tool: Editorial & Testing Policy. Trading carries risk; see the disclaimer.