
Drawing a channel by hand means choosing which points to touch. The auto channel indicator removes the choice: it fits the single line that minimises the distance to the last hundred closes, measures how far price scattered around it, and puts the rails at two of those scatters.
This build ships as a compiled .ex4 for MT4 and .ex5 for MT5; the screenshots below come from EURUSD H1.
| Platforms | MT4 (.ex4) + MT5 (.ex5) |
|---|---|
| Chart window | Main price chart |
| Plots | 5: Regression Mid, Upper Rail, Lower Rail, Lower Touch, Upper Touch |
| Alerts | popup, push notification, email, sound |
| Inputs | 10 |
What lands on your chart
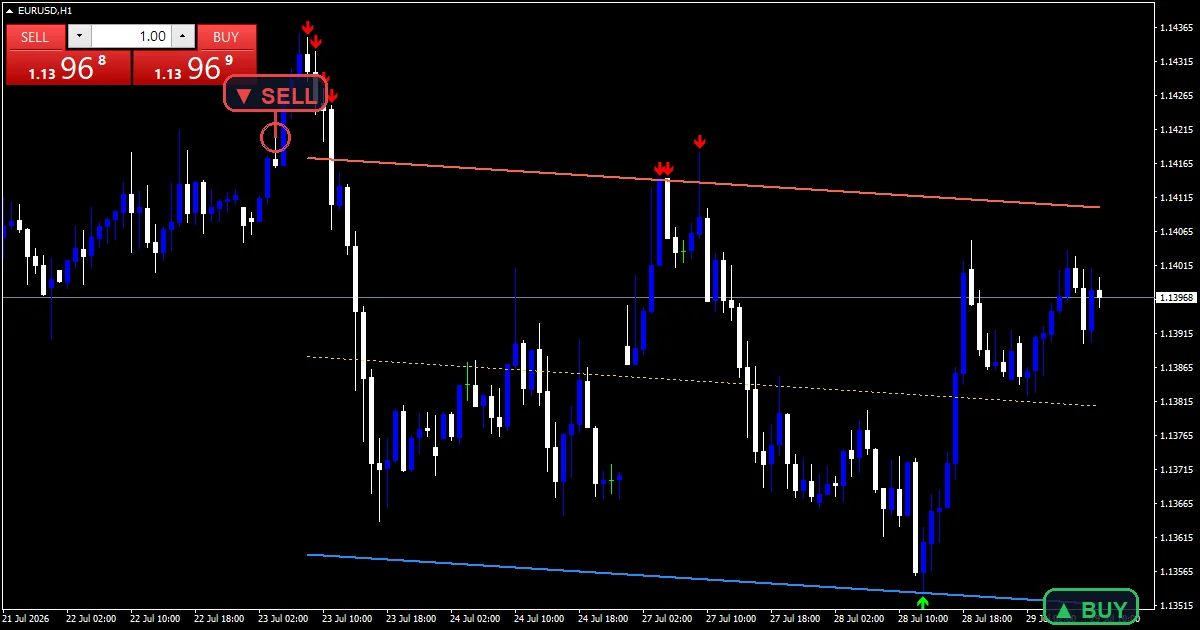
Three lines plus two touch marks.
`Regression Mid` traces gold at width 1.
`Upper Rail` traces tomato at width 2.
`Lower Rail` traces dodger blue below price.
`Lower Touch` prints lime using arrow 233.
`Upper Touch` prints red using arrow 234.
- Regression Mid: line, gold, width 1
- Upper Rail: line, tomato, width 2
- Lower Rail: line, dodger blue, width 2
- Lower Touch: arrow, lime, width 1, arrow code 233
- Upper Touch: arrow, red, width 1, arrow code 234
How the source computes it
Fitting the line
`Lookback` `100` closes go into a least-squares fit. That produces one slope and one starting value, and together they define the gold line across the whole window.
Measuring the scatter
Each close’s distance from the fit is a residual. Squaring those, averaging and taking the root gives one number describing how tightly price hugged the line.
Placing the rails
`Deviations` `2.0` multiplies that scatter figure. Both rails sit the same distance from the fit, so the channel is symmetric and parallel by construction.
Reading day to day
Slope of the gold line is the trend it found.
A narrow channel means price tracked the fit closely.
A wide one means it wandered.
`ShowTouchArrows` marks bars that tag a rail.
`ArrowGapPoints` `12` keeps marks off the candles.
The whole channel redraws as new bars arrive.
Alert channels in this build: popup, push notification, email and sound, one message per closed bar.
A bar tagging one of the rails is the event. `EnableAlerts` decides whether it speaks and a dialog already carries it. A phone, mail and the speakers behind `SoundFile` can each carry it once opened, one message per closed bar.
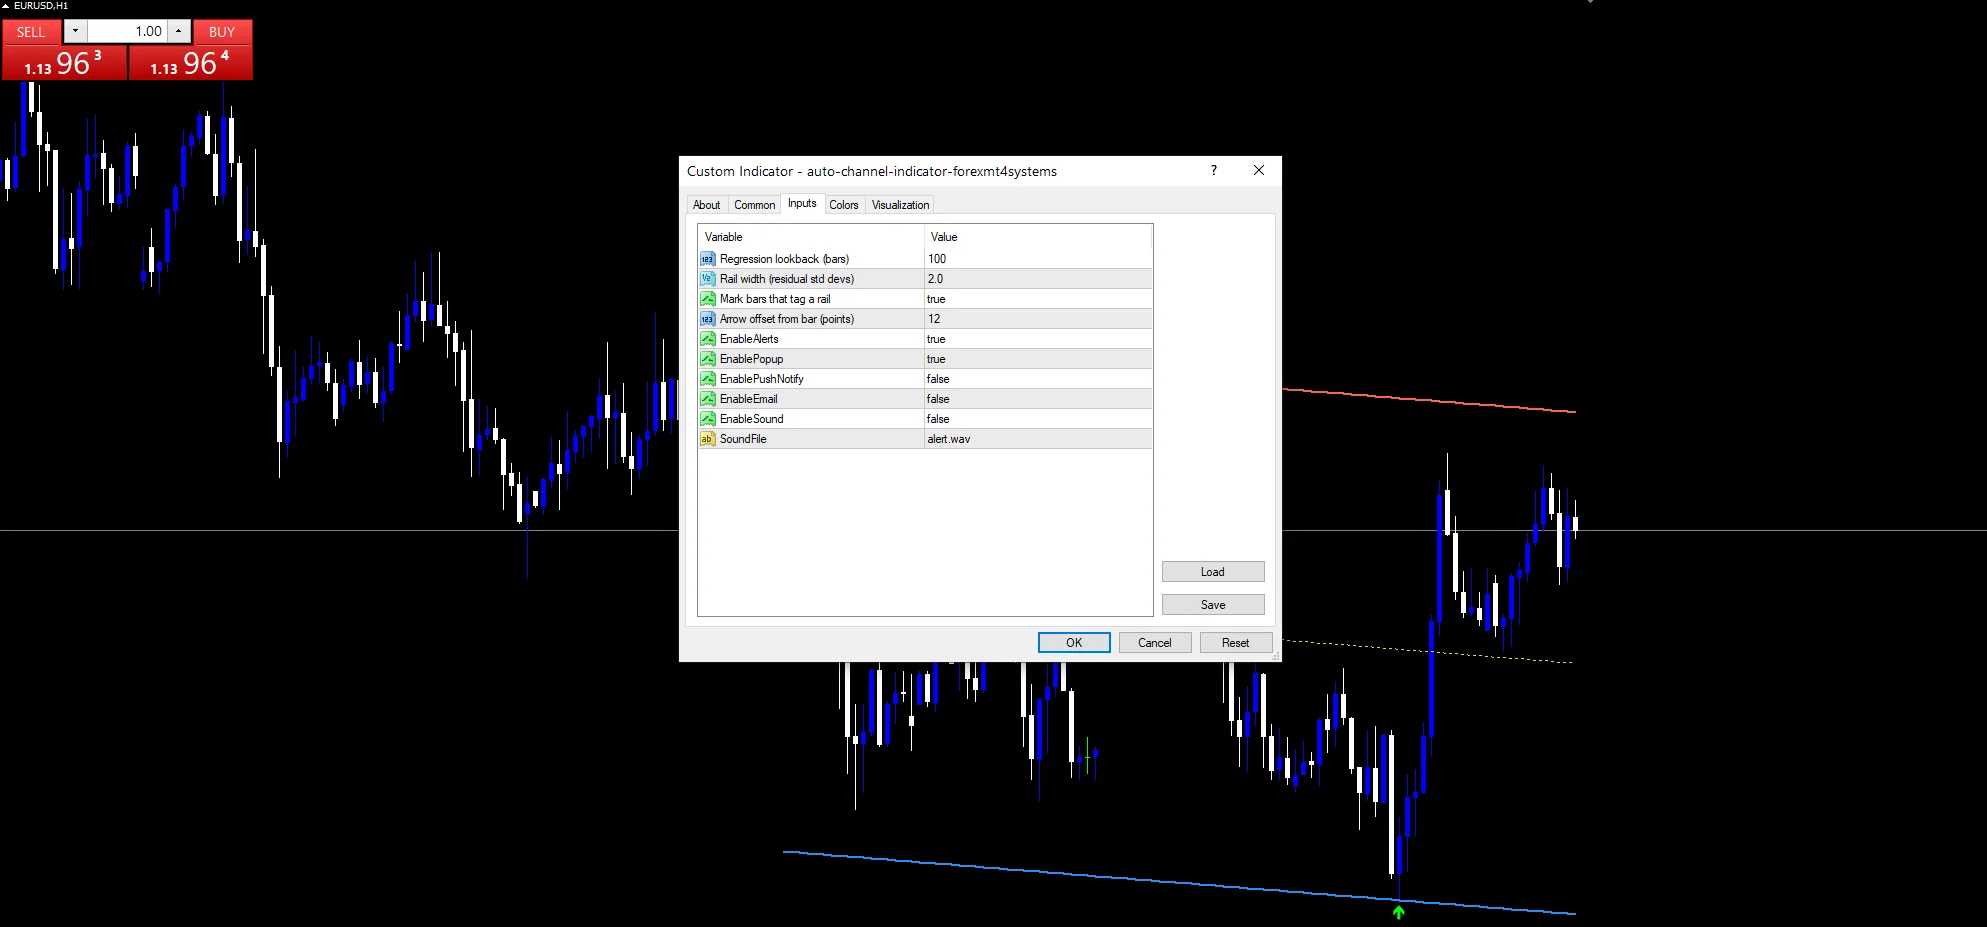
Every Auto Channel Indicator input
Core settings
| Setting | What it does | Default |
|---|---|---|
Lookback |
Regression lookback (bars). Closes going into the fit, `100`. | 100 |
Deviations |
Rail width (residual std devs). Scatter multiples each rail sits out, `2.0`. | 2.0 |
Display settings
| Setting | What it does | Default |
|---|---|---|
ShowTouchArrows |
Mark bars that tag a rail. Mark bars that tag a rail, `true`. | on |
ArrowGapPoints |
Arrow offset from bar (points). Gap between a mark and its bar, `12`. | 12 |
Alert settings
| Setting | What it does | Default |
|---|---|---|
EnableAlerts |
Whether a rail touch speaks, `true`. | on |
EnablePopup |
A dialog carries it, `true`. | on |
EnablePushNotify |
A phone can carry it, `false`. | off |
EnableEmail |
Mail can carry it, `false`. | off |
EnableSound |
Speakers can carry it, `false`. | off |
SoundFile |
What the speakers use, `”alert.wav”`. | alert.wav |
Which chart earns the most from it
A hundred closes is four days of hourly bars, which is about the span a regression fit stays honest over. EURUSD H1 is the reference chart. On M5 the fit chases noise. On D1 a hundred closes is five months of trade.
What it gets wrong
A regression assumes a straight trend exists.
The whole channel shifts as the window rolls forward.
A touch mark confirms the bar, not the turn.
Scatter measured from closes ignores the wicks.
Copy the compiled Auto Channel Indicator file into your MQL4/Indicators folder, and the MT5 build into MQL5/Indicators, then restart the terminal and drag it onto a chart. The step-by-step guide with screenshots is at how to install MT4 and MT5 indicators.
Download the Auto Channel Indicator for MT4 and MT5
The zip holds the compiled Auto Channel Indicator build for MT4 and MT5, plus a short README. Compiled files only, no source. Enter your email below and the download link arrives in your inbox.
Download this indicator free
Enter your email and the file is yours. You also get the full MT4 and MT5 library.
FAQ
What does Deviations 2.0 measure from?
The scatter of closes around the fitted line, not from an average of price. A tightly tracking market produces a narrow channel at the same setting that gives a wide one in choppy trade.
Why does the Regression Mid line move every bar?
Because the window rolls. A new close enters and the oldest leaves, so the least-squares fit is recalculated and the whole channel shifts with it, including the section covering older bars.
Does Lookback 100 use highs and lows?
No, closes only. Both the fit and the scatter figure come from closing prices, which means a bar with a long wick can poke outside a rail without that wick affecting the channel at all.
What exactly does a Lower Touch mark tell you?
That a bar tagged the lower rail, and no more. It reports price reaching the edge of the fitted scatter rather than turning there, so treat the mark as a location rather than a signal.
Are results guaranteed?
No. Trading involves risk. Results are not guaranteed; past performance is not indicative of future results. Use the Auto Channel Indicator as one input. Always backtest before trading live.
External references
- For background on this concept, see Green trading on Wikipedia.
- For broader market context, see ibullspower (BULLSPOWER) at the MQL5 Documentation.

About the author
Written by Dominic Walsh, a Forex trader and MT4/MT5 indicator, Expert Advisor and script developer. Every tool on forexmt4systems.com is tested on live charts before release and ships with ready-to-use compiled MT4 (.ex4) and MT5 (.ex5) files. Learn more about the trader and developer behind this site.
How we build, test and correct every tool: Editorial & Testing Policy. Trading carries risk; see the disclaimer.