
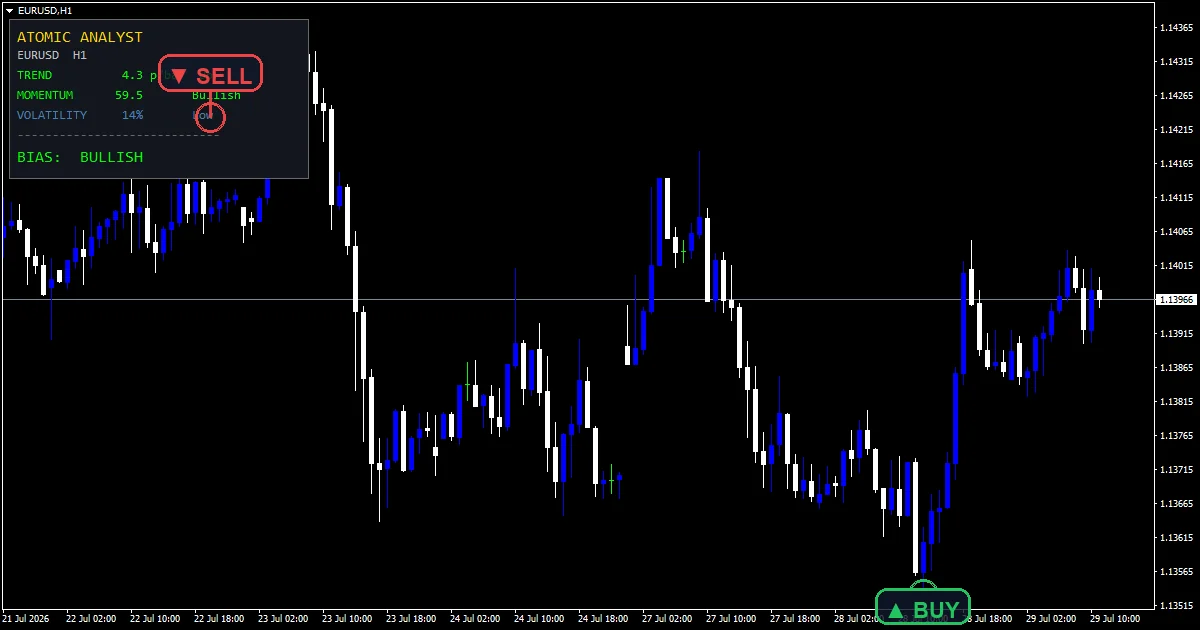
The atomic analyst indicator is a dashboard rather than a signal tool. Each closed bar it scores three independent readings of market state, then combines the two directional ones into a single bias. Everything appears in a corner panel, colour coded by factor.
This build ships as a compiled .ex4 for MT4 and .ex5 for MT5; the screenshots below come from EURUSD H1.
| Platforms | MT4 (.ex4) + MT5 (.ex5) |
|---|---|
| Chart window | Main price chart |
| Plots | 0 |
| Alerts | popup, push notification, email, sound |
| Inputs | 24 |
What the build actually draws
A rectangle label holds the panel, in the corner PanelCorner picks.
Label objects write each factor, its reading and its verdict inside.
This build declares no indicator buffers at all, so nothing appears on the price scale.
Step by step through the logic
Trend from slope
The code takes an average at EmaPeriod on the last closed bar, then again SlopeBars further back. It divides that difference by the point size and by the bar count.
That gives a slope in points per bar rather than a raw price difference. You can compare it across instruments. FlatBandPts then sets how flat counts as flat.
Momentum against two thresholds
A momentum reading at RsiPeriod meets two thresholds, RsiBull and RsiBear, rather than a single midpoint.
A gap between the two, 55.0 and 45.0 by default, lets the reading sit in a neutral band instead of picking a side.
Volatility as a percentile
The code skips raw ATR. It counts how many of the last VolLookback readings sat at or below the current one. That count becomes a percentage.
A percentile travels across instruments in a way a raw ATR never does. Ninety percent means volatility is high for this market, not high in absolute terms.
What to look for
Trend and momentum combine into the bias. Volatility describes conditions, not direction.
A neutral bias means the two directional factors disagreed. That is information, not a gap.
The volatility percentile says whether now is busy for this instrument.
Everything scores on the last closed bar. The panel updates once a bar, not tick by tick.
Alert channels in this build: popup, push notification, email and sound.
Alerts cover popup, push, email and sound. This build carries no once-per-bar guard, so a condition can alert more than once while a bar is still forming.
Every Atomic Analyst Indicator input
Core settings
| Setting | What it does | Default |
|---|---|---|
EmaPeriod |
Trend EMA period. EmaPeriod is the average whose slope gives the trend factor. It defaults to 50. | 50 |
SlopeBars |
Bars used to measure EMA slope. SlopeBars is how far back the slope reaches, 10 by default. | 10 |
FlatBandPts |
Flat zone half-width (points/bar). FlatBandPts is the slope in points per bar below which the trend reads flat, 1.0 by default. | 1.0 |
RsiPeriod |
Momentum RSI period. RsiPeriod is the momentum lookback at 14. | 14 |
RsiBull |
RSI bullish threshold. RsiBull is the level momentum must clear to read bullish, 55.0 by default. | 55.0 |
RsiBear |
RSI bearish threshold. RsiBear is the matching bearish level at 45.0, leaving a neutral band between them. | 45.0 |
AtrPeriod |
Volatility ATR period. AtrPeriod is the volatility window at 14. | 14 |
VolLookback |
ATR percentile lookback. VolLookback is how many past readings the percentile ranks against, 100 by default. | 100 |
Display settings
| Setting | What it does | Default |
|---|---|---|
PanelCorner |
Corner (0=UL,1=UR,2=LL,3=LR). | 0 |
PanelX |
X margin (px). | 14 |
PanelY |
Y margin (px). | 24 |
PanelFont |
Font size. | 10 |
PanelBg |
Panel background. | RGB 18,22,30 |
TitleColor |
Title colour. | gold |
LabelColor |
Row-label colour. | silver |
BullColor |
Bullish colour. | lime |
BearColor |
Bearish colour. | red |
NeutralColor |
Neutral colour. | gainsboro |
Alert settings
| Setting | What it does | Default |
|---|---|---|
EnableAlerts |
(see inputs panel) | on |
EnablePopup |
(see inputs panel) | on |
EnablePushNotify |
(see inputs panel) | off |
EnableEmail |
(see inputs panel) | off |
EnableSound |
(see inputs panel) | off |
SoundFile |
(see inputs panel) | alert.wav |
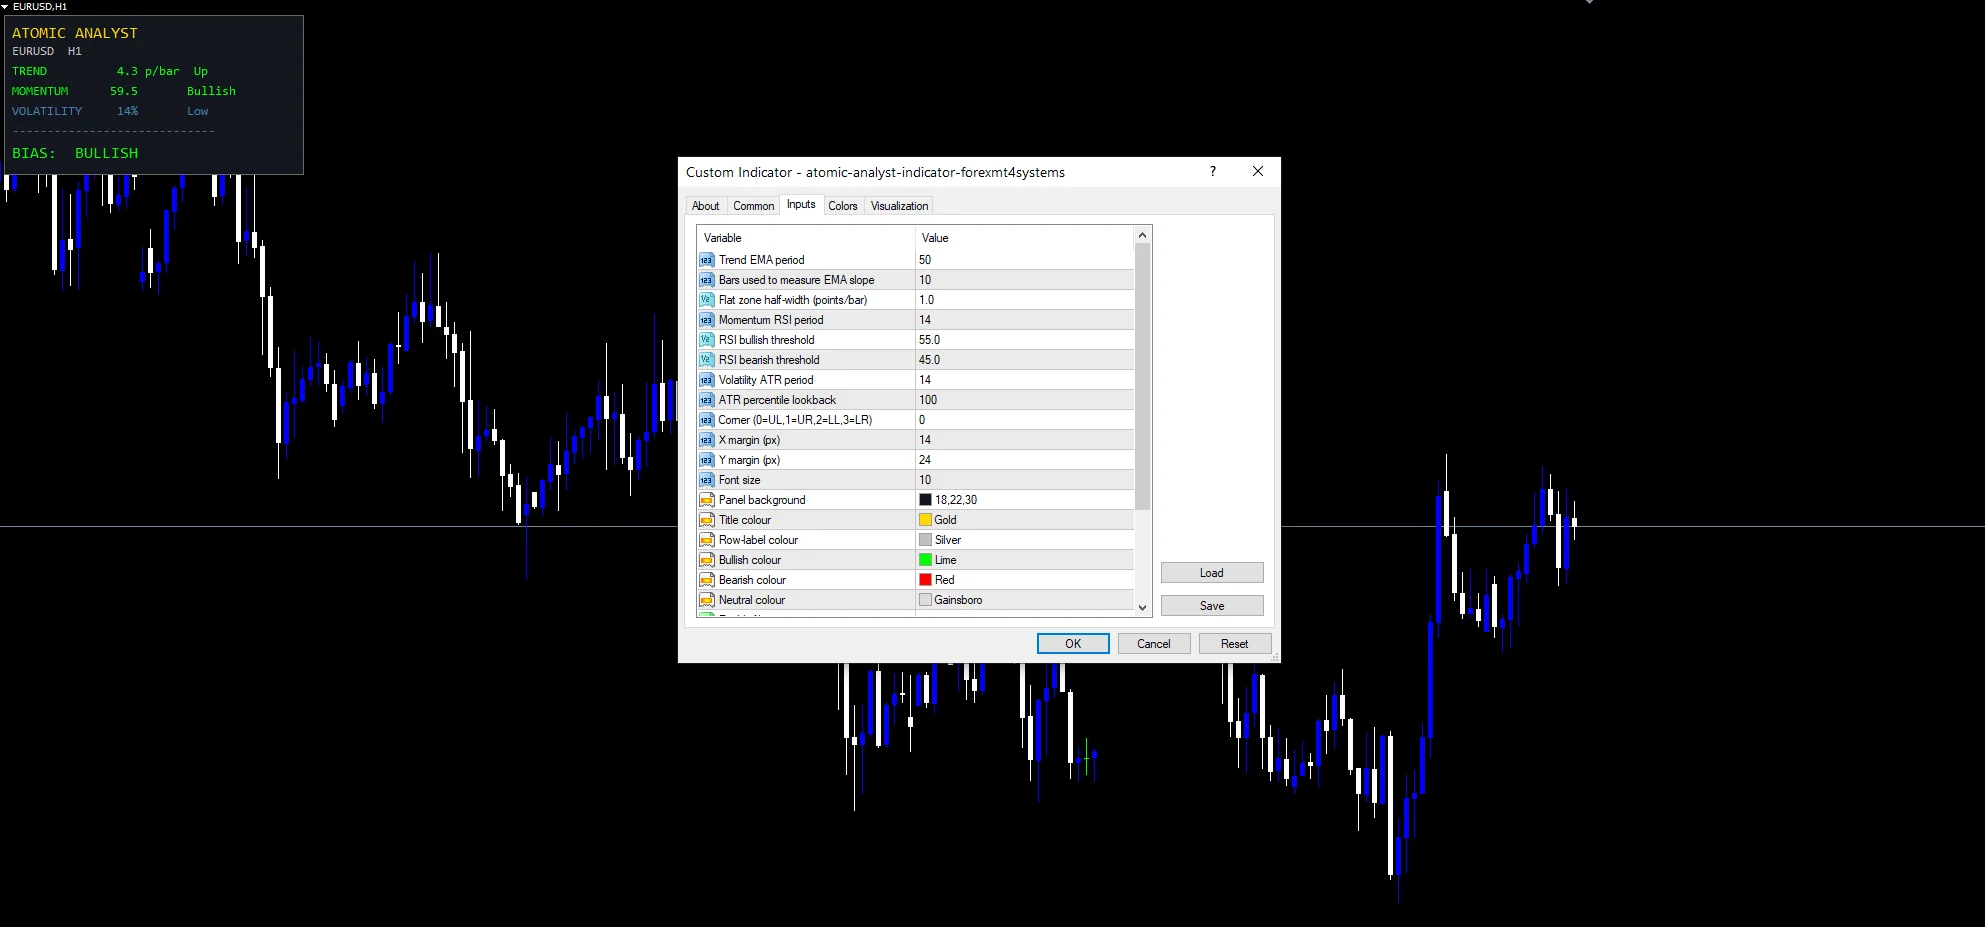
Settings that fit your chart
The screenshot uses EURUSD H1. A dashboard suits whatever chart you actually trade, since all three factors read that chart timeframe. H1 and H4 give slope and percentile readings steady enough to act on. On M1 all three flip constantly and the panel becomes hard to use.
Where this one struggles
Three factors on one instrument is a narrow view. All three can agree and still miss a turn.
The slope factor measures where an average has been, not where it is going.
A volatility percentile leans entirely on VolLookback. A hundred bar window on a quiet chart can read ninety percent on a small move.
No signal exists here. The panel describes state and leaves each decision to you.
Copy the compiled Atomic Analyst Indicator file into your MQL4/Indicators folder, and the MT5 build into MQL5/Indicators, then restart the terminal and drag it onto a chart. The step-by-step guide with screenshots is at how to install MT4 and MT5 indicators.
Background reading on the method behind the Atomic Analyst Indicator: Fundo de Investimento em Direitos Creditórios on Wikipedia, iatr (ATR) at the MQL5 Documentation.
Download the Atomic Analyst Indicator for MT4 and MT5
The zip holds the compiled Atomic Analyst Indicator build for MT4 and MT5, plus a short README. Compiled files only, no source. Enter your email below and the download link arrives in your inbox.
Download this indicator free
Enter your email and the file is yours. You also get the full MT4 and MT5 library.
FAQ
Why measure the EmaPeriod slope in points per bar?
A raw price difference means nothing across instruments. Dividing by the point size and by SlopeBars turns the change into a rate. You can compare that rate between a currency pair and a metal, so FlatBandPts uses one threshold for both.
Why leave a neutral band between RsiBull and RsiBear?
It lets momentum abstain. A single midpoint forces every reading to one side, including ones sitting effectively on the fence. A gap between 55.0 and 45.0 means the factor can report neutral, which beats a coin flip.
How does VolLookback differ from a plain ATR reading?
It counts how many of the last VolLookback readings sat at or below the current one. That turns volatility into a rank, not a distance. Ninety percent means busy for this instrument, rather than large in absolute terms.
Does the EmaPeriod slope produce a trade signal?
No, and nothing here is built to. This build declares no plots at all. It scores trend, momentum and volatility on each closed bar and reports them. Every interpretation is left to you, so treat the panel as context beside whatever else you run.
Are results guaranteed?
No. Trading involves risk. Results are not guaranteed; past performance is not indicative of future results. Use the Atomic Analyst Indicator as one input. Always backtest before trading live.
External references
- The core method is documented in Fundo de Investimento em Direitos Creditórios on Wikipedia.
- Additional market context is at iatr (ATR) at the MQL5 Documentation.

About the author
Written by Dominic Walsh, a Forex trader and MT4/MT5 indicator, Expert Advisor and script developer. Every tool on forexmt4systems.com is tested on live charts before release and ships with ready-to-use compiled MT4 (.ex4) and MT5 (.ex5) files. Learn more about the trader and developer behind this site.
How we build, test and correct every tool: Editorial & Testing Policy. Trading carries risk; see the disclaimer.