
The automatic premium and discount indicator takes the recent range and divides it up. Range high and Range low come from the highest high and lowest low over the lookback. Between them sit Premium 75%, Equilibrium 50% and Discount 25%, which is the whole idea in one picture.
This build ships as a compiled .ex4 for MT4 and .ex5 for MT5; the screenshots below come from EURUSD H1.
| Platforms | MT4 (.ex4) + MT5 (.ex5) |
|---|---|
| Chart window | Main price chart |
| Plots | 5: Range high, Premium 75%, Equilibrium 50%, Discount 25%, Range low |
| Alerts | popup, push notification, email, sound |
| Inputs | 7 |
What renders
Range high tracks the highest high across the lookback window.
Range low tracks the lowest low.
Equilibrium 50% sits exactly halfway between them.
Premium 75% and Discount 25% split the two halves again.
- Range high: line, tomato, width 1
- Premium 75%: line, tomato, width 1
- Equilibrium 50%: line, gold, width 2
- Discount 25%: line, medium sea green, width 1
- Range low: line, medium sea green, width 1
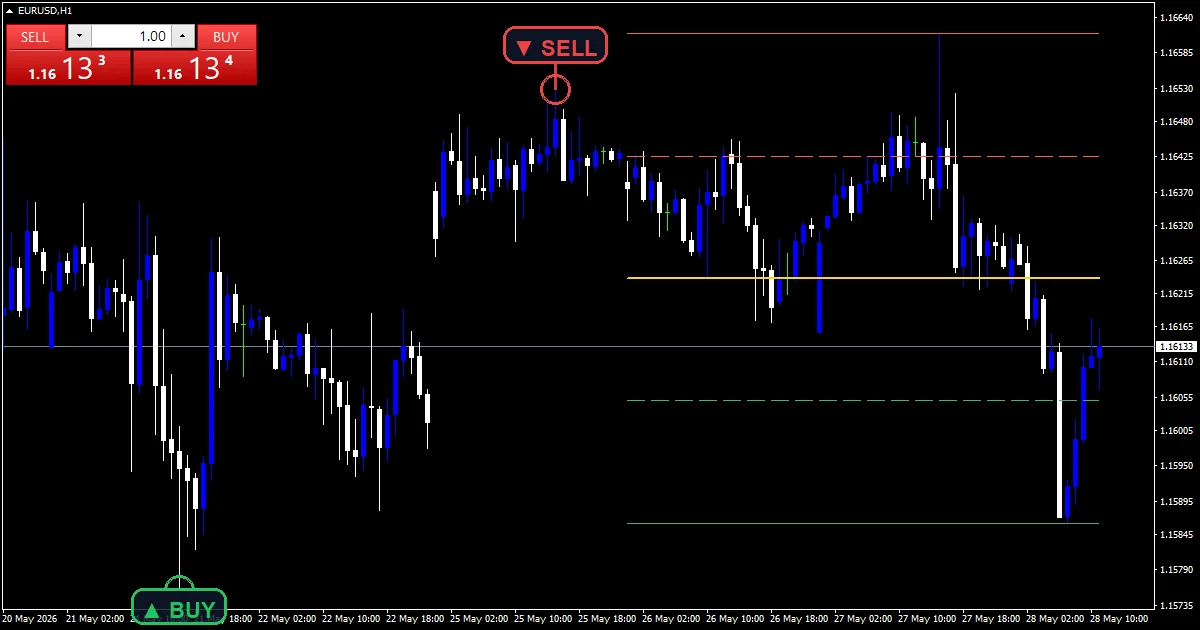
The mechanism
Finding the range
Two scans run across RangeLookback bars, one for the highest high and one for the lowest low. Those two values are the range.
Everything else follows arithmetically. There is no averaging and no smoothing anywhere in this build.
Splitting it up
Equilibrium sits at the low plus half the range. Premium sits at the low plus three quarters, and discount at the low plus one quarter.
So the five levels sit evenly spaced by construction. Price above equilibrium trades at a premium to the recent range, and below it at a discount.
Why the levels move
The scans run from the current bar backwards, so a new extreme rewrites the whole set at once.
That is worth expecting. None of these levels holds still. They describe the last RangeLookback bars and shift as that window rolls forward.
What you are looking at
Price above Equilibrium 50% is trading in the upper half of its recent range, which is what premium means here.
The gap between Range high and Range low tells you how much room the window covers.
All five levels move together when a new extreme prints, so a level from yesterday is not the level today.
Equal spacing is arithmetic rather than a market property. Nothing says price respects a quarter more than any other fraction.
Alert channels in this build: popup, push notification, email and sound.
Alerts cover popup, push, email and sound. This build carries no once-per-bar guard, so a condition can alert more than once while a bar is still forming.
Every Automatic Premium and Discount Indicator input
Core settings
| Setting | What it does | Default |
|---|---|---|
RangeLookback |
RangeLookback is how many bars the high and low scan covers. It defaults to 60. A longer window gives steadier levels that move less often. | 60 |
Alert settings
| Setting | What it does | Default |
|---|---|---|
EnableAlerts |
EnableAlerts gates the message block and defaults to true. | on |
EnablePopup |
EnablePopup shows the MT4 dialog and defaults to true, making it the one channel active out of the box. | on |
EnablePushNotify |
(see inputs panel) | off |
EnableEmail |
EnableEmail routes messages to your configured address. It defaults to false. | off |
EnableSound |
(see inputs panel) | off |
SoundFile |
(see inputs panel) | alert.wav |
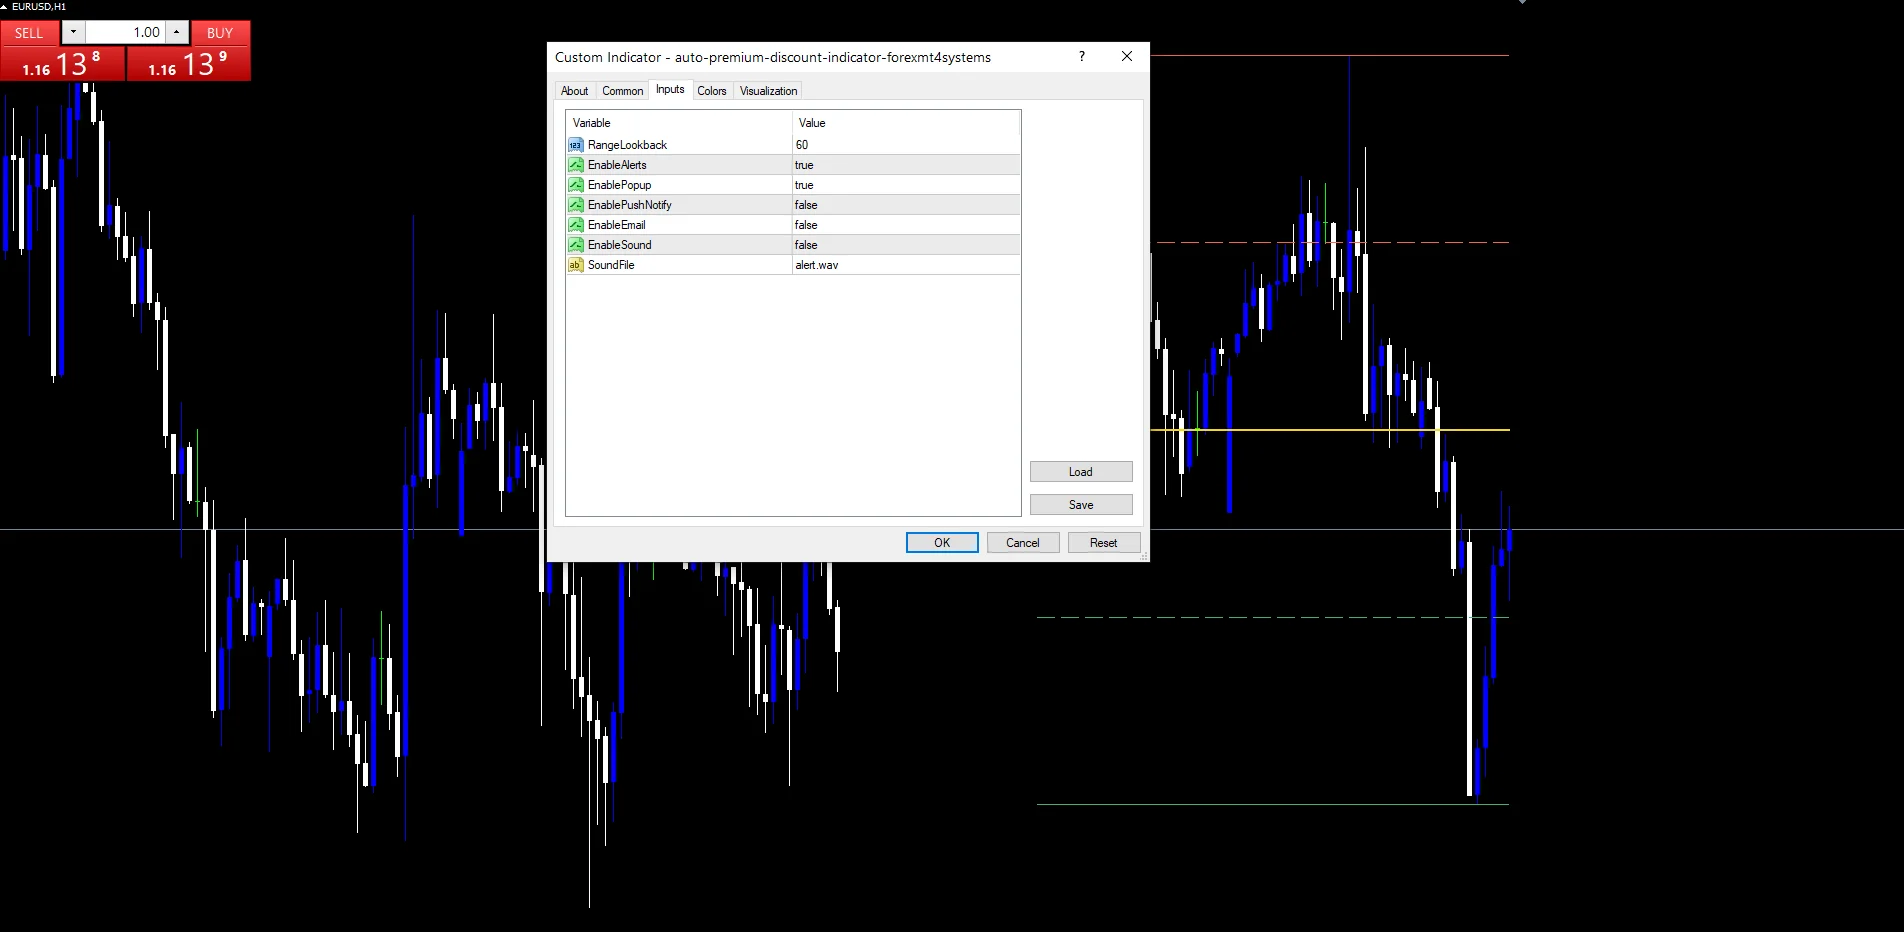
Settings that fit your chart
The screenshot uses EURUSD H1. Sixty bars on H1 covers about two and a half trading days, which gives a range recent enough to matter. On H4 the same window spans a fortnight. Below M15 a new extreme rewrites the levels constantly and they stop being worth marking.
What to be wary of
Every level shifts the moment a new extreme prints, so none of them holds still while you watch it.
The quartile split is arithmetic. Nothing in the market makes 75 percent of a range more meaningful than 70 or 80.
A single spike sets the range high for the rest of the window, which drags every level with it.
The tool describes where price sits in its recent range and says nothing about direction.
Copy the compiled Automatic Premium and Discount Indicator file into your MQL4/Indicators folder, and the MT5 build into MQL5/Indicators, then restart the terminal and drag it onto a chart. The step-by-step guide with screenshots is at how to install MT4 and MT5 indicators.
Background reading on the method behind the Automatic Premium and Discount Indicator: Size premium on Wikipedia, Money Flow Index MFI at StockCharts ChartSchool.
Download the Automatic Premium and Discount Indicator for MT4 and MT5
The zip holds the compiled Automatic Premium and Discount Indicator build for MT4 and MT5, plus a short README. Compiled files only, no source. Enter your email below and the download link arrives in your inbox.
Download this indicator free
Enter your email and the file is yours. You also get the full MT4 and MT5 library.
FAQ
What does premium actually mean on this indicator?
Price trading in the upper half of the RangeLookback window. Equilibrium 50% marks the midpoint between the highest high and lowest low, so anything above it is at a premium to the recent range, and anything below is at a discount.
Why do Range high and Equilibrium 50% move together?
They all come from the same two numbers. A new highest high or lowest low rewrites the range, and every level sits at a fixed fraction of it. That is why a level you noted an hour ago may sit somewhere else now.
Should I raise RangeLookback above 60?
If the levels move too often for you, yes. A longer window makes a new extreme rarer, so the five levels hold still for longer. The trade: they then describe a stretch of history that may no longer match current conditions.
Does a single spike distort the Range high?
Yes, and for the whole window. The scan takes the highest high with no filtering, so one outsized wick sets Range high until it drops out of the RangeLookback window. Every other level shifts with it while it remains.
Are results guaranteed?
No. Trading involves risk. Results are not guaranteed; past performance is not indicative of future results. Use the Automatic Premium and Discount Indicator as one input. Always backtest before trading live.
Category: this is part of our Smart Money collection. Also, still, browse more Smart Money for MetaTrader, or explore every MT4 indicator and MT5 indicator on the site.
External references
- The core method is documented in Size premium on Wikipedia.
- Additional market context is at Money Flow Index MFI at StockCharts ChartSchool.

About the author
Written by Dominic Walsh, a Forex trader and MT4/MT5 indicator, Expert Advisor and script developer. Every tool on forexmt4systems.com is tested on live charts before release and ships with ready-to-use compiled MT4 (.ex4) and MT5 (.ex5) files. Learn more about the trader and developer behind this site.
How we build, test and correct every tool: Editorial & Testing Policy. Trading carries risk; see the disclaimer.