
The best mtf resistance support indicator runs the same search twice. Once on your chart, once on `InpHigherTF` `PERIOD_H4`. Two level maps then sit on one chart, drawn differently, so you can see where the timeframes agree.
This build ships as a compiled .ex4 for MT4 and .ex5 for MT5; the screenshots below come from EURUSD H1.
| Platforms | MT4 (.ex4) + MT5 (.ex5) |
|---|---|
| Chart window | Main price chart |
| Plots | 0 |
| Alerts | popup, push notification, email, sound |
| Inputs | 21 |
Plot by plot
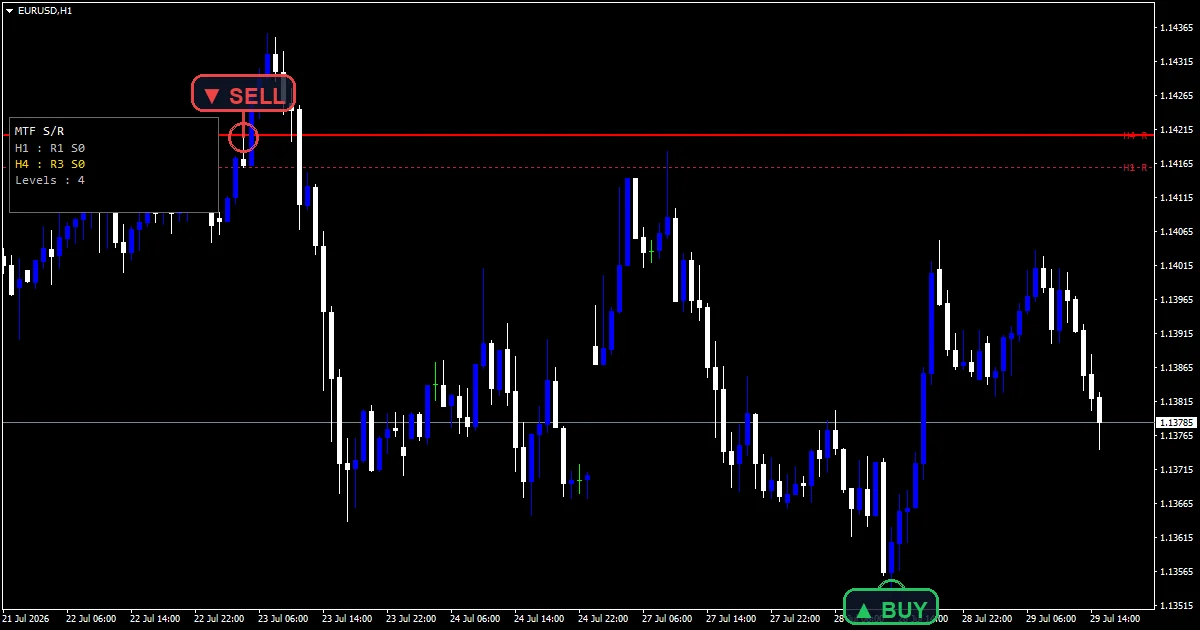
Rays mark the levels from both timeframes, drawn as chart objects.
`CurResColor` and `CurSupColor` carry the chart timeframe, thin and dotted.
`HtfResColor` and `HtfSupColor` carry the higher one, bold and solid.
Each ray tags its price, its timeframe and its touch count.
How the plots get their values
Two independent scans
The chart timeframe scan covers `Lookback` `400` bars. The higher one covers `HtfLookback` `300` of its own bars, which is a far longer stretch of real time. Both use the same pivot test.
Clustering runs per timeframe
`ClusterPoints` `200` merges pivots that sit close together, and `MaxLevels` `5` keeps the strongest per map. So you get at most ten levels rather than one crowded list.
Weight comes from the drawing
The higher timeframe draws bold and solid while the chart timeframe draws thin and dotted. Nothing in the code ranks one above the other. Your eye does that, which is the point of showing both.
On a live chart
A chart level sitting on a higher one is the case worth noting.
Bold lines change less often, because their bars take longer to close.
Red marks a level above current price and green marks one below.
`PanelYStart` `120` keeps the summary clear of the one-click panel.
Alert channels in this build: popup, push notification, email and sound, one message per closed bar.
`EnableAlerts` is the top-level switch and ships true with `EnablePopup`. `EnablePushNotify` sends to a phone, `EnableEmail` sends mail and `EnableSound` plays `SoundFile`, all three starting off. A touch reports once the bar has closed.
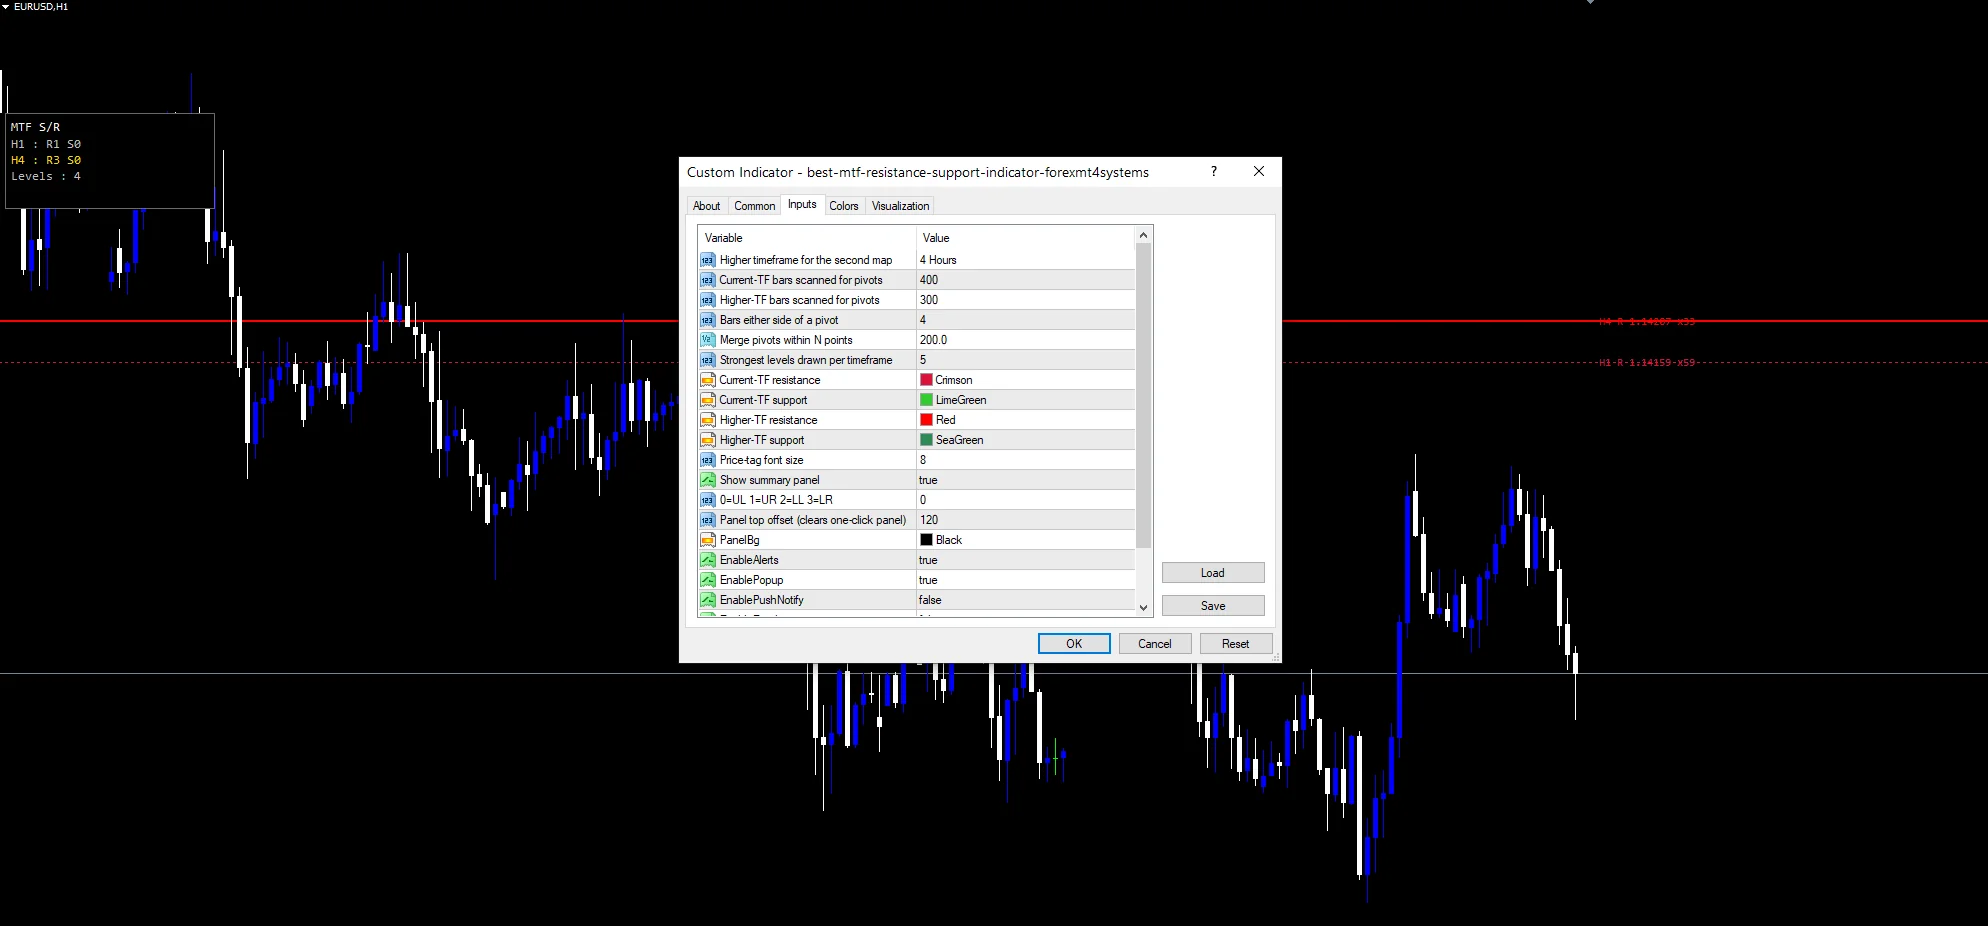
Every Best Mtf Resistance Support Indicator input
Core settings
| Setting | What it does | Default |
|---|---|---|
InpHigherTF |
Higher timeframe for the second map. The second timeframe to scan, default `PERIOD_H4`. | PERIOD_H4 |
Lookback |
Current-TF bars scanned for pivots. Chart-timeframe bars scanned, default `400`. | 400 |
HtfLookback |
Higher-TF bars scanned for pivots. Higher-timeframe bars scanned, default `300`. | 300 |
FractalDepth |
Bars either side of a pivot. Bars either side confirming a pivot, default `4`. | 4 |
ClusterPoints |
Merge pivots within N points. Merge distance in points, default `200`. | 200 |
MaxLevels |
Strongest levels drawn per timeframe. Strongest levels kept per timeframe, default `5`. | 5 |
Display settings
| Setting | What it does | Default |
|---|---|---|
CurResColor |
Current-TF resistance. Chart-timeframe resistance colour, default `clrCrimson`. | crimson |
CurSupColor |
Current-TF support. | lime green |
HtfResColor |
Higher-TF resistance. Higher-timeframe resistance colour, default `clrRed`. | red |
HtfSupColor |
Higher-TF support. | sea green |
LabelFont |
Price-tag font size. | 8 |
ShowPanel |
Show summary panel. Show the summary readout, default `true`. | on |
PanelCorner |
0=UL 1=UR 2=LL 3=LR. | 0 |
PanelYStart |
Panel top offset (clears one-click panel). | 120 |
PanelBg |
(see inputs panel) | black |
Alert settings
| Setting | What it does | Default |
|---|---|---|
EnableAlerts |
Top-level switch for the routes, default `true`. | on |
EnablePopup |
Box in the terminal on a touch, default `true`. | on |
EnablePushNotify |
(see inputs panel) | off |
EnableEmail |
(see inputs panel) | off |
EnableSound |
(see inputs panel) | off |
SoundFile |
(see inputs panel) | alert.wav |
Where to point it
The pairing matters more than the numbers. EURUSD H1 is the reference chart, and H4 above it covers roughly four times the history per bar. On M15 the default H4 becomes a very distant reference, so move it down to H1.
When it will mislead you
Two maps on one chart can reach ten lines, which crowds a small screen.
The higher timeframe updates only when its own bar closes, so it lags visibly.
Agreement between timeframes is a coincidence of clustering, not a tested edge.
Copy the compiled Best Mtf Resistance Support Indicator file into your MQL4/Indicators folder, and the MT5 build into MQL5/Indicators, then restart the terminal and drag it onto a chart. The step-by-step guide with screenshots is at how to install MT4 and MT5 indicators.
Related on forexmt4systems.com: Support and Resistance Strategy.
Background reading on the method behind the Best Mtf Resistance Support Indicator: Market data on Wikipedia, Fibonacciextensions at Investopedia.
Download the Best Mtf Resistance Support Indicator for MT4 and MT5
The zip holds the compiled Best Mtf Resistance Support Indicator build for MT4 and MT5, plus a short README. Compiled files only, no source. Enter your email below and the download link arrives in your inbox.
Download this indicator free
Enter your email and the file is yours. You also get the full MT4 and MT5 library.
FAQ
What does InpHigherTF PERIOD_H4 give you?
A second level map built from four-hour bars. Those levels move far less often than the chart ones, so they act as the slower reference. Set it one or two steps above whatever chart you are on.
Why is HtfLookback 300 rather than 400?
Because each higher-timeframe bar covers more real time. Three hundred H4 bars is already about fifty days, which is well beyond what four hundred H1 bars reach. The smaller number keeps the two scans comparable.
What does MaxLevels 5 apply to?
Each timeframe separately, so the chart can carry up to ten rays in total. That is already busy. Lower it to three per map if you run other tools that draw on price.
Does MaxLevels rank the two timeframes?
No. It draws the higher one bold and solid and the chart one thin and dotted, then leaves the judgement to you. Nothing scores a level higher for appearing on both maps.
Are results guaranteed?
No. Trading involves risk. Results are not guaranteed; past performance is not indicative of future results. Use the Best Mtf Resistance Support Indicator as one input. Always backtest before trading live.
External references
- For background on this concept, see Market data on Wikipedia.
- For broader market context, see Fibonacciextensions at Investopedia.

About the author
Written by Dominic Walsh, a Forex trader and MT4/MT5 indicator, Expert Advisor and script developer. Every tool on forexmt4systems.com is tested on live charts before release and ships with ready-to-use compiled MT4 (.ex4) and MT5 (.ex5) files. Learn more about the trader and developer behind this site.
How we build, test and correct every tool: Editorial & Testing Policy. Trading carries risk; see the disclaimer.