
The BoS CHoCH Indicator tracks market structure and marks each break on the price chart. It confirms swing pivots with a fractal test, then compares every close against the last stored high and low. Continuation breaks and reversal breaks get their own colour. Structure traders end up with a running map of who holds control.
This build ships as a compiled .ex4 for MT4 and .ex5 for MT5; the screenshots below come from EURUSD H1.
| Platforms | MT4 (.ex4) + MT5 (.ex5) |
|---|---|
| Chart window | Main price chart |
| Plots | 4: BoS Up, BoS Down, CHoCH Up, CHoCH Down |
| Alerts | popup, push notification, email, sound |
| Inputs | 17 |
On screen
Four arrow buffers carry the whole signal set. BoS Up drops a lime up arrow below the breaking bar. That happens when an uptrend closes past its last swing high. BoS Down mirrors it with a red down arrow above the bar. Both plots mean continuation, not reversal.
CHoCH Up and CHoCH Down handle the flip side. An uptrend that closes under its last swing low prints CHoCH Down in magenta. A downtrend that closes above its last swing high prints CHoCH Up in aqua. The internal trend flag turns over on that same bar.
Chart objects go on top of the markers. Each break also draws a horizontal line at the level that gave way. A small text label beside it reads BoS or CHoCH. DrawBreakLines and DrawLabels switch those two layers off. MaxObjects caps the drawing at 200 items, so old history stops clogging the chart.
- BoS Up: arrow, lime, width 2, arrow code 233
- BoS Down: arrow, red, width 2, arrow code 234
- CHoCH Up: arrow, aqua, width 2, arrow code 233
- CHoCH Down: arrow, magenta, width 2, arrow code 234

How the numbers arrive
Swing pivots from a five-bar fractal
Pivot detection comes first. A bar counts as a swing high when FractalPeriod bars on each side stay below its high. The default FractalPeriod of 2 gives the classic five-bar fractal. Swing lows use the mirror test. Each confirmed pivot updates the stored swing high or swing low price.
The break test on every close
State drives the logic. The tool holds a trend flag, the last swing high and the last swing low. In an uptrend a close above the stored swing high fires BoS Up. A close below the stored swing low fires CHoCH Down instead, and the flag turns bearish. Down trends run the same rules in reverse.
Each level gets consumed once. After a break the stored price resets to zero, so the same swing never triggers twice. Marker prices sit 10 points off the bar high or low, which ArrowOffsetPoints controls.
Full recalculation on every pass
History gets rebuilt each tick. The code clears all four buffers, then walks the chart from the oldest bar toward the newest. That keeps the trend flag honest after a history reload. It also means the marker set can shift when your broker feeds new bars into old gaps.
How to take it
A lime BoS Up arrow says the uptrend just took out its own high. Traders who run with the trend treat it as continuation. The horizontal line left behind shows the level that broke. Price often retests that line before the next leg.
Magenta changes the story. CHoCH Down means an uptrend gave up its last higher low. That is the first structural warning, not a confirmed downtrend. Many desks wait for the following BoS Down before they act.
Read the labels in order along the chart. A run of BoS marks in one direction shows a trend that keeps extending. Alternating CHoCH marks point to a range instead. Both readings come off closed bars only.
Alert channels in this build: popup, push notification, email and sound, one message per closed bar.
EnableAlerts drives the whole block, with popup, push notification, email and sound each on its own switch. The dispatcher fires once per closed bar, so a single break never repeats on later ticks.
Every BoS CHoCH Indicator input
Core settings
| Setting | What it does | Default |
|---|---|---|
FractalPeriod |
Bars each side of swing (2 = classic 5-bar). Sets how many bars must sit on each side of a pivot, and the default 2 gives a five-bar fractal; larger values keep only the bigger swings. | 2 |
MaxObjects |
Max break lines/labels kept on chart. Caps how many break lines and labels stay on the chart at 200; lower it when your terminal feels heavy. | 200 |
Display settings
| Setting | What it does | Default |
|---|---|---|
DrawBreakLines |
Draw horizontal break lines. Turns the horizontal level lines on or off; leave them on when you trade retests of broken structure. | on |
BoSLineColor |
BoS line colour. | lime |
CHoCHLineColor |
CHoCH line colour. | magenta |
LineWidth |
Line width. | 1 |
DrawLabels |
Draw “BoS” / “CHoCH” text labels. Shows the BoS and CHoCH text beside each break; switch it off on dense intraday charts. | on |
LabelColorBoS |
BoS label colour. | lime |
LabelColorCHoCH |
CHoCH label colour. | magenta |
LabelFontSize |
Label font size. | 9 |
ArrowOffsetPoints |
Arrow offset (points) from bar high/low. Lifts each marker away from the bar high or low by 10 points, which suits five-digit majors. | 10 |
Alert settings
| Setting | What it does | Default |
|---|---|---|
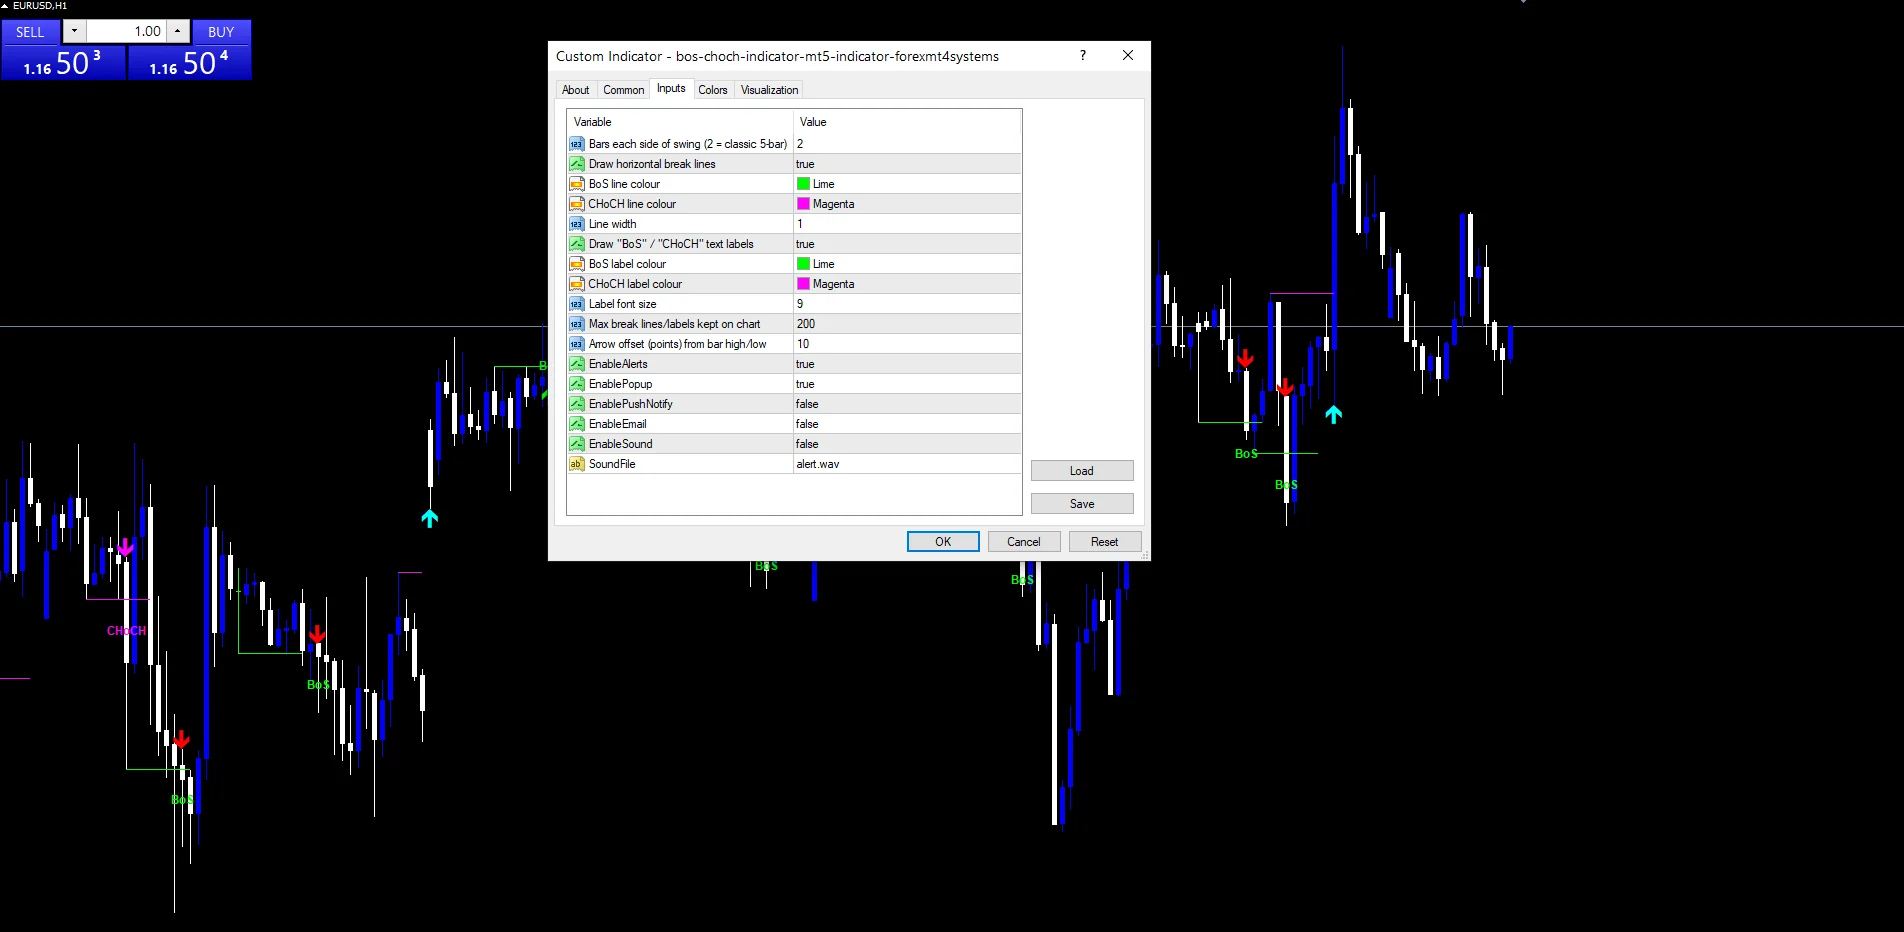
EnableAlerts |
(see inputs panel) | on |
EnablePopup |
(see inputs panel) | on |
EnablePushNotify |
(see inputs panel) | off |
EnableEmail |
(see inputs panel) | off |
EnableSound |
(see inputs panel) | off |
SoundFile |
(see inputs panel) | alert.wav |
Where the defaults make sense
Structure tools suit liquid instruments with clean swings. The screenshots come from EURUSD H1, which gives enough range per bar for a fractal to mean something. Majors, gold and index CFDs all carry the same swing behaviour. On M1 and M5 the pivots thin out and breaks come faster than most traders can read them. Higher charts such as H4 and D1 print fewer marks, so each one carries more weight.
What it will not tell you
Ranges break the logic. Sideways price makes swing highs and lows that sit close together, so BoS and CHoCH marks alternate every few bars. The chart fills with signals that lead nowhere.
Confirmation costs bars. A pivot only counts once FractalPeriod bars have printed to its right, so the stored level always lags the actual turn. On fast news candles the mark can land well after the move.
The tool rebuilds its whole state on every pass. When your broker back-fills missing bars over a weekend, older marks can move or vanish. That is a recalculation effect rather than a live shift on the current candle.
Break levels say nothing about strength. A close one point past a swing high counts the same as a wide impulse candle. Add your own filter when you need conviction behind the mark.
Copy the compiled BoS CHoCH Indicator file into your MQL4/Indicators folder, and the MT5 build into MQL5/Indicators, then restart the terminal and drag it onto a chart. The step-by-step guide with screenshots is at how to install MT4 and MT5 indicators.
Download the BoS CHoCH Indicator for MT4 and MT5
The zip holds the compiled BoS CHoCH Indicator build for MT4 and MT5, plus a short README. Compiled files only, no source. Enter your email below and the download link arrives in your inbox.
Download this indicator free
Enter your email and the file is yours. You also get the full MT4 and MT5 library.
FAQ
Why does a BoS Up arrow print two bars after the break?
Pivot confirmation needs FractalPeriod bars on the right of the swing before the level counts. The break test then runs on that confirmation bar, not on the newest candle. With the shipped setting that puts the mark a couple of bars behind the high water point. It buys certainty at the cost of speed.
How does CHoCH Down differ from a BoS Down mark?
BoS Down continues a move that already points lower, so the downtrend just took out another swing low. CHoCH Down appears while the flag still reads bullish, and it turns that flag bearish. One extends structure, the other changes it. The colours differ on purpose so you can tell them apart at a glance.
Does MaxObjects delete my own drawings from the chart?
No. The cleanup routine only touches objects whose name starts with the tool’s own prefix. MaxObjects caps that private set at 200 lines and labels, and it removes the oldest ones first. Your manual trend lines, rectangles and text stay where you put them.
How many marks should EURUSD H1 print in a normal week?
Counts move with volatility, so no fixed number exists. On EURUSD H1 the tool typically leaves a handful of BoS marks inside a trending week and more CHoCH flips during a quiet range. Raise FractalPeriod when the chart looks crowded. That keeps only the pivots that stand out.
Are results guaranteed?
No. Trading involves risk. Results are not guaranteed; past performance is not indicative of future results. Use the BoS CHoCH Indicator as one input. Always backtest before trading live.
Category: this is part of our Smart Money collection. Next, plainly, browse more Smart Money for MetaTrader, or explore every MT4 indicator and MT5 indicator on the site.
External references
- For background on this concept, see Hot money on Wikipedia.
- For broader market context, see Money Flow Index MFI at StockCharts ChartSchool.

About the author
Written by Dominic Walsh, a Forex trader and MT4/MT5 indicator, Expert Advisor and script developer. Every tool on forexmt4systems.com is tested on live charts before release and ships with ready-to-use compiled MT4 (.ex4) and MT5 (.ex5) files. Learn more about the trader and developer behind this site.
How we build, test and correct every tool: Editorial & Testing Policy. Trading carries risk; see the disclaimer.