
The chart overlay indicator draws a second instrument on top of the one you are looking at. Both run on the same timeframe, so this compares two markets rather than two timeframes. Because the two rarely trade in the same price band, the second symbol gets mapped onto your chart range before anything appears.
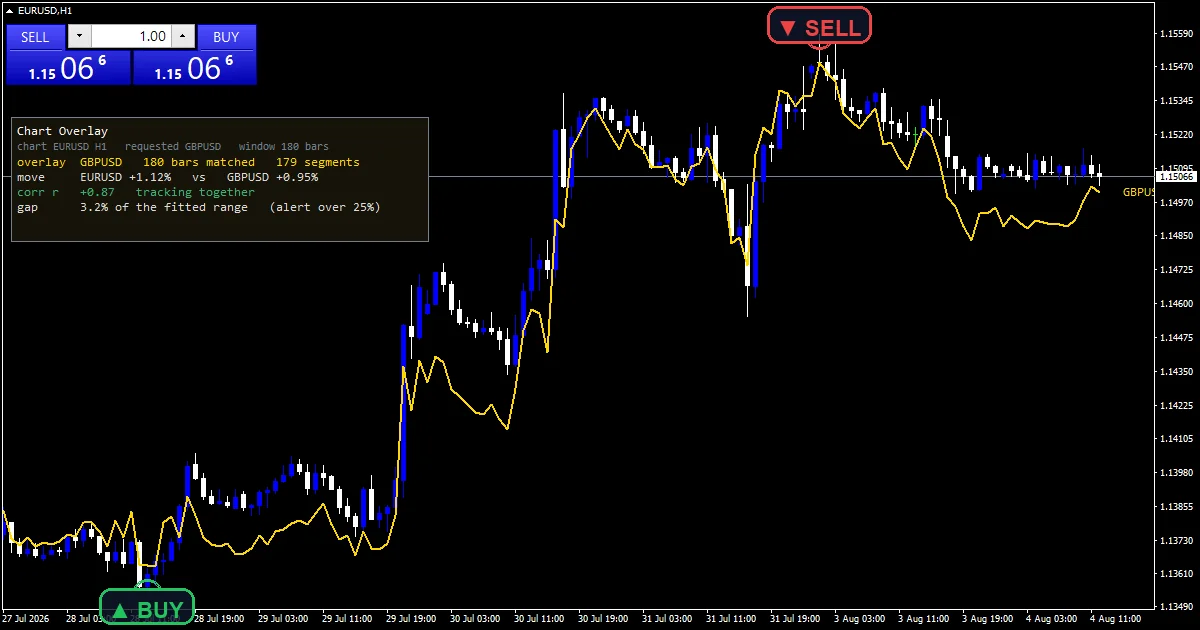
This build ships as a compiled .ex4 for MT4 and .ex5 for MT5; the screenshots below come from EURUSD H1.
| Platforms | MT4 (.ex4) + MT5 (.ex5) |
|---|---|
| Chart window | Main price chart |
| Plots | 0 |
| Alerts | popup, push notification, email, sound |
| Inputs | 26 |
The plots and where they sit
A trend line object traces the second symbol across the lookback window, in the colour and width you set.
A text label names that symbol on the chart when InpShowLabel stays on.
A corner panel reports what the mapping throws away. It shows each symbol move over the window, the correlation between them, and the current gap.
This build declares no indicator buffers at all. Everything you see is a chart object.
How the source computes it
Mapping one symbol onto another price range
The second symbol closes get read across the same window that gets drawn. The code finds their highest and lowest values. Each close becomes a fraction from zero to one. That fraction then maps onto the chart own high and low.
Taking both extremes from the same window is what keeps the overlay filling the band instead of collapsing off the top or bottom of the screen. A symbol that never moved across the window would divide by zero, so the code reports it as flat instead.
What survives the mapping
The mapping is affine. It stretches and shifts without bending, so every swing, pullback and divergence comes through exactly as it happened.
What it loses is the vertical units. You cannot read a price off the overlay, which is precisely why the panel carries the percentage moves as numbers.
Measuring the correlation
Correlation runs on the bar to bar changes of the two series, not on their levels. Two markets that both drift upward would report near perfect correlation on levels alone. That tells you nothing.
InpFitPct then shrinks the drawn band towards its midpoint, so the overlay sits inside the candles rather than smothering them.
What you act on
Shape is the readable part. Where the overlay turns and where your chart turns is the comparison worth making.
Vertical distance between the two tracks shows a normalised gap rather than a price difference.
A high correlation with a widening gap is the divergence case this tool exists to surface.
InpDivPct sets how far apart the tracks must sit before that gap gets reported.
Alert channels in this build: popup, push notification, email and sound, one message per closed bar.
Alerts cover popup, push, email and sound when the normalised gap passes InpDivPct. A bar time check keeps it to one alert per closed bar.
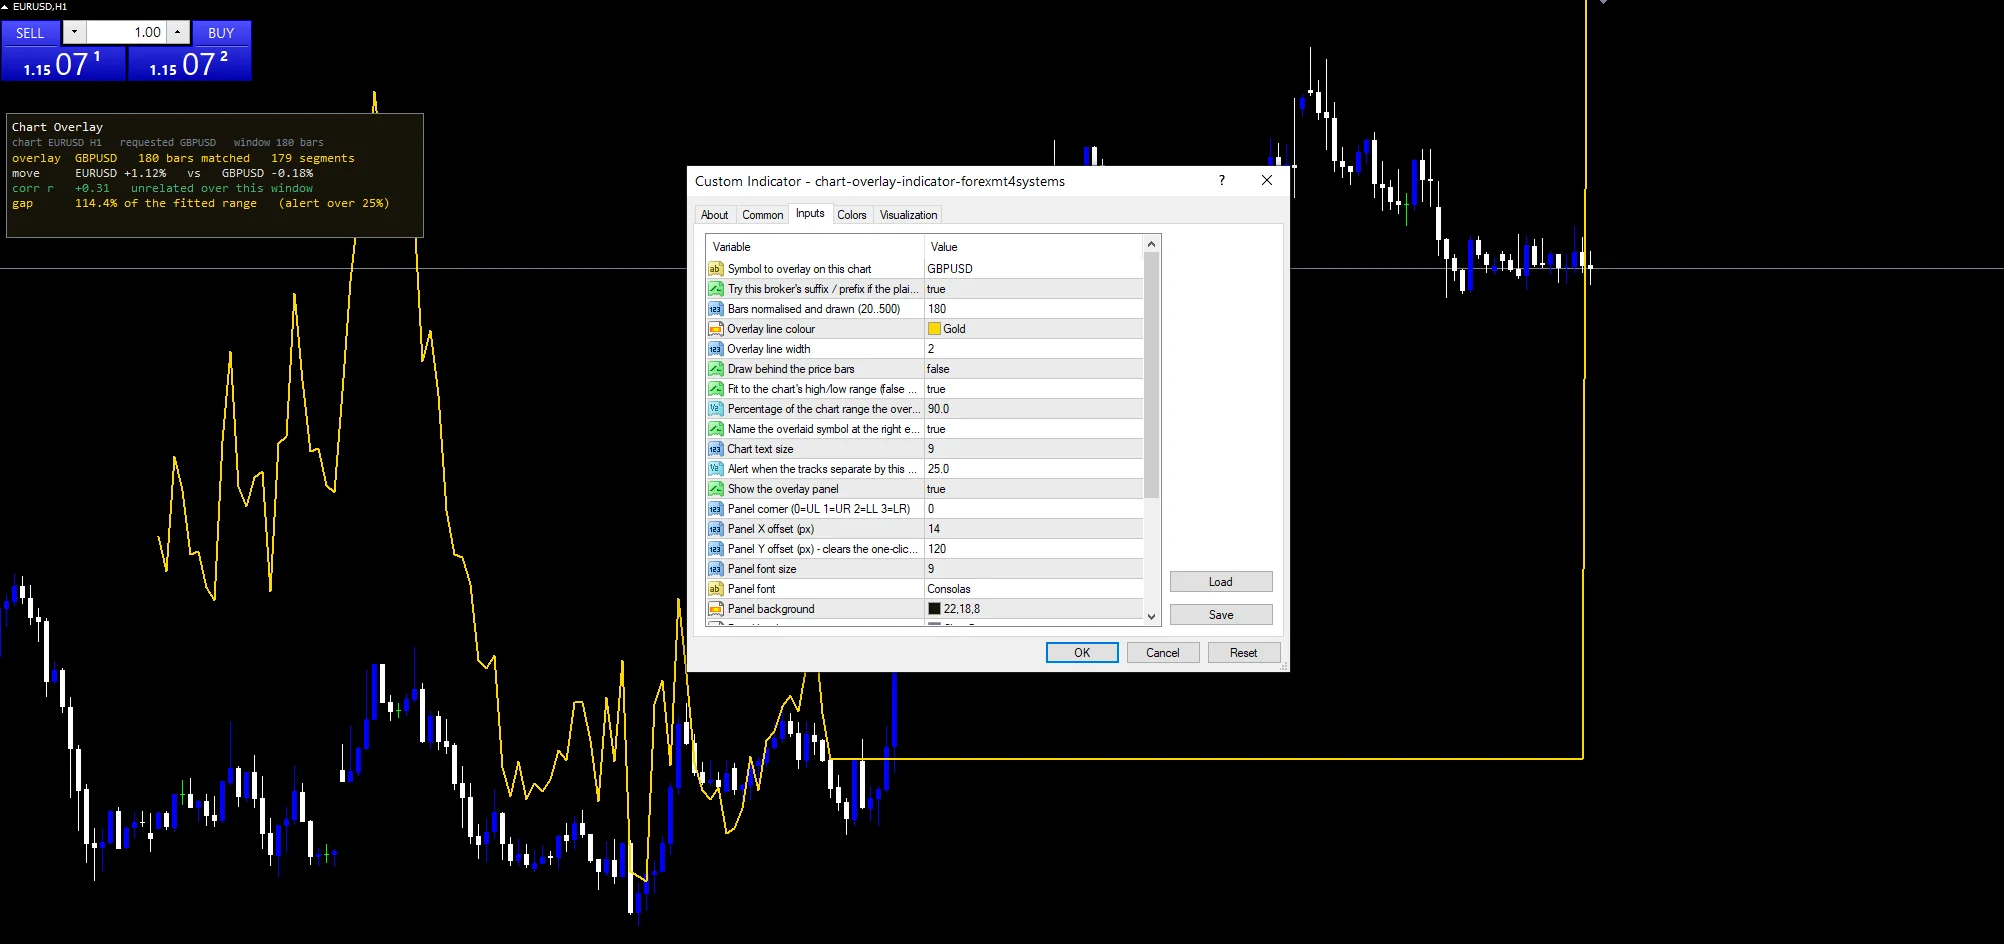
Every Chart Overlay Indicator input
Core settings
| Setting | What it does | Default |
|---|---|---|
InpOverlaySymbol |
Symbol to overlay on this chart. InpOverlaySymbol names the instrument to draw. It defaults to GBPUSD. | GBPUSD |
InpAutoSuffix |
Try this broker’s suffix / prefix if the plain name is absent. InpAutoSuffix resolves broker symbol suffixes so a feed using them still works. It defaults to true. | on |
InpLookback |
Bars normalised and drawn (20..500). InpLookback is how many bars get mapped and drawn, 180 by default. It also sets the window the extremes and correlation come from. | 180 |
InpBackground |
Draw behind the price bars. | off |
InpUseHiLo |
Fit to the chart’s high/low range (false = close range). InpUseHiLo maps against the chart highs and lows rather than its closes. It defaults to true. | on |
InpFitPct |
Percentage of the chart range the overlay may use. InpFitPct shrinks the drawn band towards its midpoint, 90.0 by default, so the overlay does not cover the candles. | 90.0 |
InpDivPct |
Alert when the tracks separate by this % of the range. InpDivPct is how far apart the two normalised tracks have to sit before the gap gets reported, 25.0 by default. | 25.0 |
InpX |
Panel X offset (px). | 14 |
InpY |
Panel Y offset (px) – clears the one-click panel. | 120 |
Display settings
| Setting | What it does | Default |
|---|---|---|
InpLineColor |
Overlay line colour. | gold |
InpLineWidth |
Overlay line width. | 2 |
InpShowLabel |
Name the overlaid symbol at the right edge. | on |
InpTextSize |
Chart text size. | 9 |
InpShowPanel |
Show the overlay panel. InpShowPanel draws the readout block and defaults to true. | on |
InpCorner |
Panel corner (0=UL 1=UR 2=LL 3=LR). | 0 |
InpFontSize |
Panel font size. | 9 |
InpFont |
Panel font. | Consolas |
InpPanelBg |
Panel background. | RGB 22,18,8 |
InpBorderColor |
Panel border. | slate gray |
InpTextColor |
Panel text. | gainsboro |
Alert settings
| Setting | What it does | Default |
|---|---|---|
EnableAlerts |
(see inputs panel) | on |
EnablePopup |
(see inputs panel) | on |
EnablePushNotify |
(see inputs panel) | off |
EnableEmail |
(see inputs panel) | off |
EnableSound |
(see inputs panel) | off |
SoundFile |
(see inputs panel) | alert.wav |
Which chart to load it on
The screenshot uses EURUSD H1. Comparing two symbols works best where they share a driver, so a pair against its counterpart or an index against a currency gives the most readable result. H1 and H4 keep the window meaningful. On M1 the correlation figure swings around too much to act on.
What it gets wrong
You cannot read a price off the overlay. The mapping deliberately discards the vertical units, which is why the panel carries the numbers separately.
Both extremes come from the drawn window, so extending or shortening InpLookback rescales the whole overlay and changes how far apart the tracks appear.
Correlation on bar to bar changes still says nothing about cause. Two markets can move together for reasons that stop applying without warning.
A missing or misnamed second symbol leaves the overlay empty, which looks the same as a market that did not move.
Copy the compiled Chart Overlay Indicator file into your MQL4/Indicators folder, and the MT5 build into MQL5/Indicators, then restart the terminal and drag it onto a chart. The step-by-step guide with screenshots is at how to install MT4 and MT5 indicators.
Background reading on the method behind the Chart Overlay Indicator: Securities market participants (United States) on Wikipedia, Dow Jones Select Indices at StockCharts ChartSchool.
Download the Chart Overlay Indicator for MT4 and MT5
The zip holds the compiled Chart Overlay Indicator build for MT4 and MT5, plus a short README. Compiled files only, no source. Enter your email below and the download link arrives in your inbox.
Download this indicator free
Enter your email and the file is yours. You also get the full MT4 and MT5 library.
FAQ
Is this a higher timeframe overlay of the same symbol?
No. It draws a different instrument on the same timeframe, so it compares two markets rather than two periods of one. Attach it to H1 and both series are read on H1. The symbol comes from InpOverlaySymbol, which defaults to GBPUSD.
Why can I not read a price off the overlay line?
Because the second symbol gets mapped onto your chart range before drawing. That mapping stretches and shifts the series so it fits the band, which preserves every swing exactly and discards the vertical units. The panel reports each symbol percentage move to replace what the line cannot show.
Why does InpLookback correlation use changes not prices?
Two markets that both trend upward report a correlation near one on levels alone, whatever they did day to day. Running it on bar to bar changes asks whether they moved together, which is the question worth asking, and it gives a far more honest figure.
What does InpFitPct 90.0 change?
It shrinks the drawn band towards its midpoint, so the overlay occupies ninety percent of the available height rather than all of it. Lowering it further pulls the line into a tighter band and leaves more of the candles visible underneath.
Are results guaranteed?
No. Trading involves risk. Results are not guaranteed; past performance is not indicative of future results. Use the Chart Overlay Indicator as one input. Always backtest before trading live.
External references
- The core method is documented in Securities market participants (United States) on Wikipedia.
- Additional market context is at Dow Jones Select Indices at StockCharts ChartSchool.

About the author
Written by Dominic Walsh, a Forex trader and MT4/MT5 indicator, Expert Advisor and script developer. Every tool on forexmt4systems.com is tested on live charts before release and ships with ready-to-use compiled MT4 (.ex4) and MT5 (.ex5) files. Learn more about the trader and developer behind this site.
How we build, test and correct every tool: Editorial & Testing Policy. Trading carries risk; see the disclaimer.