
The color fisher indicator runs the Fisher Transform exactly as published, then encodes two facts at once. Which side of zero the reading sits on, and which way it is moving. Four histogram colours cover the four combinations, and the two middle states are the interesting ones.
This build ships as a compiled .ex4 for MT4 and .ex5 for MT5; the screenshots below come from EURUSD H1.
| Platforms | MT4 (.ex4) + MT5 (.ex5) |
|---|---|
| Chart window | Separate window (levels 0 / 1.5 / -1.5) |
| Plots | 7: Rising above zero, Rising below zero, Falling above zero, Falling below zero, Fisher, Trigger, Normalised value |
| Alerts | popup, push notification, email, sound |
| Inputs | 29 |
What appears on the chart
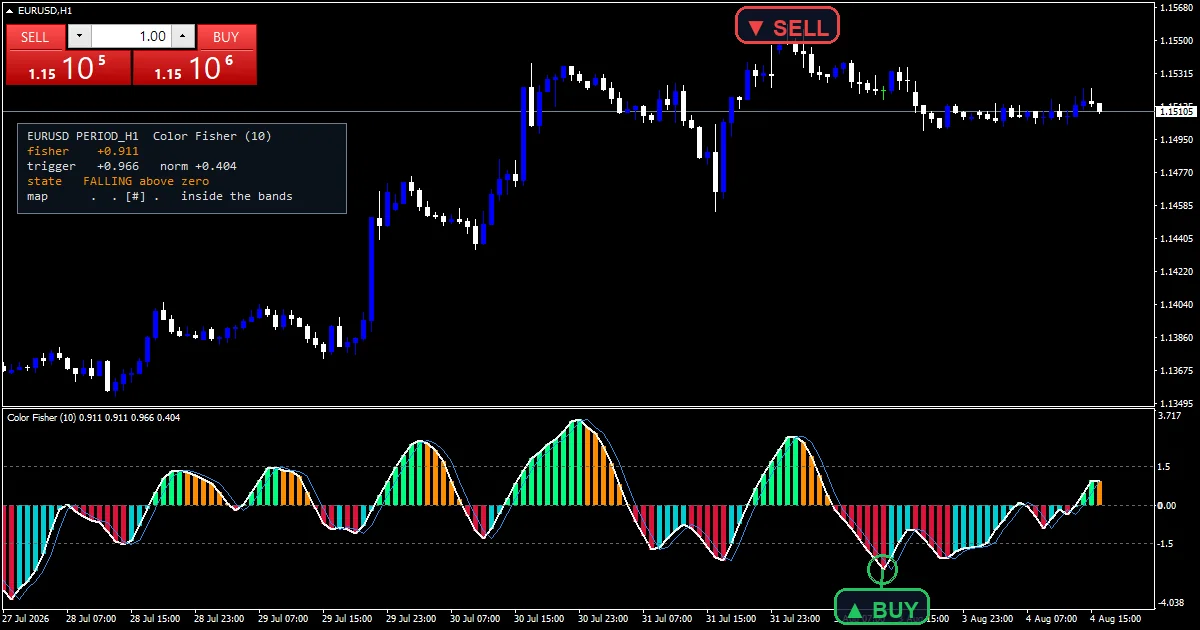
Rising above zero draws spring green, Rising below zero draws dark turquoise.
Falling above zero draws dark orange, Falling below zero draws crimson.
Fisher is the white smoke line and Trigger is its dodger blue one-bar shift.
Reference bands sit at zero and at plus or minus `InpExtreme`.
- Rising above zero: histogram, spring green, width 3
- Rising below zero: histogram, dark turquoise, width 3
- Falling above zero: histogram, dark orange, width 3
- Falling below zero: histogram, crimson, width 3
- Fisher: line, white smoke, width 2
- Trigger: line, dodger blue, width 1
- Normalised value: hidden buffer
The recipe
Normalising the price
raw takes the price minus the lowest low over `InpPeriod` `10` bars, divided by that window range. val then smooths it with `InpAlpha` `0.33` against the previous value. The result sits between minus 1 and plus 1.
Applying the transform
fish takes half the natural log of 1 plus val over 1 minus val, plus `InpFishSmooth` `0.5` times the previous reading. That log stretches values near the edges hard, which is what turns a mushy stochastic turn into a spike.
Why the clamp exists
The log diverges when val reaches exactly 1. `InpClamp` `0.999` stops that. Without it the pane would run to infinity the first time price printed the highest bar of the window.
How to follow it
Dark turquoise means the reading is rising while still below zero.
Dark orange means it is falling while still above zero.
Those two states mark the bar where the slope flipped early.
Bar height is the reading itself, so the pane auto-scales against real data.
Alert channels in this build: popup, push notification, email and sound, one message per closed bar.
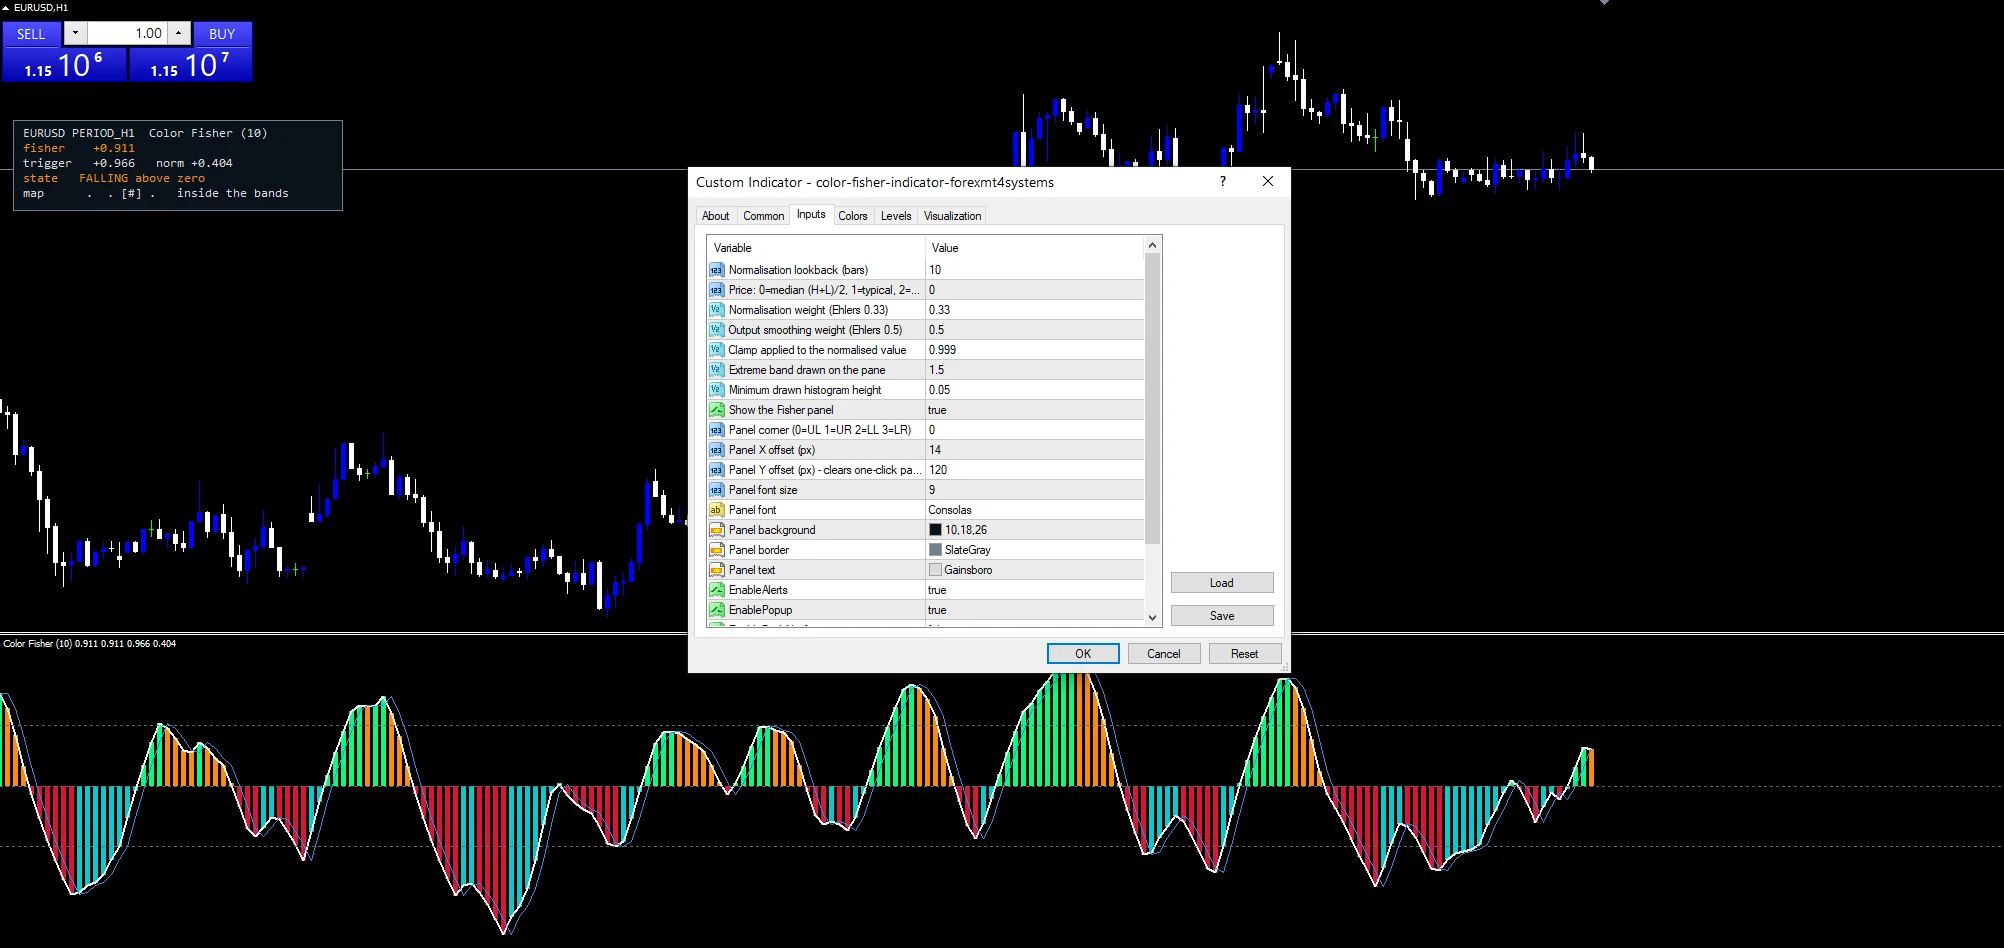
Four channels hang off `EnableAlerts`, which starts on, with `EnablePopup` joining it. `EnablePushNotify`, `EnableEmail` and `EnableSound` all begin false. `SoundFile` picks the clip. Alerts fire on a slope flip only, one per closed bar.
Every Color Fisher Indicator input
Core settings
| Setting | What it does | Default |
|---|---|---|
InpPeriod |
Normalisation lookback (bars). Normalisation window in bars, default `10`. | 10 |
InpPriceMode |
Price: 0=median (H+L)/2, 1=typical, 2=close. Price source, `0` for median, 1 for typical, 2 for close. | 0 |
InpAlpha |
Normalisation weight (Ehlers 0.33). Normalisation weight, default `0.33` from the original work. | 0.33 |
InpFishSmooth |
Output smoothing weight (Ehlers 0.5). Output smoothing weight, default `0.5`. | 0.5 |
InpClamp |
Clamp applied to the normalised value. Limit applied before the log, default `0.999`. | 0.999 |
InpExtreme |
Extreme band drawn on the pane. Extreme band drawn on the pane, default `1.5`. | 1.5 |
InpMinBar |
Minimum drawn histogram height. Smallest drawn histogram height, default `0.05`. | 0.05 |
InpX |
Panel X offset (px). | 14 |
InpY |
Panel Y offset (px) – clears one-click panel. | 120 |
InpMaxRows |
Hard cap on panel rows drawn at once. Cap on panel rows drawn, default `26`. | 26 |
InpPriceScalePx |
Right margin owned by the price scale, in pixels. | 62 |
InpOneClickWpx |
Width of the one-click trade panel zone, top-left. | 260 |
InpOneClickHpx |
Height of the one-click trade panel zone, top-left. | 100 |
Display settings
| Setting | What it does | Default |
|---|---|---|
InpShowPanel |
Show the Fisher panel. Draws the readout panel, default `true`. | on |
InpCorner |
Panel corner (0=UL 1=UR 2=LL 3=LR). Panel corner, default `0` for upper left. | 0 |
InpFontSize |
Panel font size. | 9 |
InpFont |
Panel font. | Consolas |
InpPanelBg |
Panel background. | RGB 10,18,26 |
InpBorderColor |
Panel border. | slate gray |
InpTextColor |
Panel text. | gainsboro |
InpPanelInPane |
Draw the panel inside the pane (short – rows may trim). | off |
InpLabelEdgePadPx |
Padding kept clear at the window edges, in pixels. | 10 |
InpAvoidPanel |
Keep the readout clear of the one-click trade zone. | on |
Alert settings
| Setting | What it does | Default |
|---|---|---|
EnableAlerts |
Master switch for the Fisher turn alerts, default `true`. | on |
EnablePopup |
Terminal dialog on a Fisher turn, default `true`. | on |
EnablePushNotify |
Phone push on a Fisher turn, default `false`. | off |
EnableEmail |
Mail delivery on a Fisher turn, default `false`. | off |
EnableSound |
Sound playback on a Fisher turn, default `false`. | off |
SoundFile |
Wav clip for the Fisher alert, default `alert.wav`. | alert.wav |
Where it earns its keep
The transform sharpens turns wherever price ranges. EURUSD H1 is the reference chart, where `InpPeriod` at `10` covers under half a day. On M5 the colour changes several times an hour. On H4 each colour block covers a genuine swing, and the extreme bands mean more.
What it misses
Stretching the extremes also stretches noise at the extremes.
A ten-bar normalisation window is short, so the reading resets its reference often.
Four colours take practice to read at a glance, and two of them look similar on a small pane.
Copy the compiled Color Fisher Indicator file into your MQL4/Indicators folder, and the MT5 build into MQL5/Indicators, then restart the terminal and drag it onto a chart. The step-by-step guide with screenshots is at how to install MT4 and MT5 indicators.
Background reading on the method behind the Color Fisher Indicator: Spot date on Wikipedia, Stockcharts Theoretical Indices at StockCharts ChartSchool.
Download the Color Fisher Indicator for MT4 and MT5
The zip holds the compiled Color Fisher Indicator build for MT4 and MT5, plus a short README. Compiled files only, no source. Enter your email below and the download link arrives in your inbox.
Download this indicator free
Enter your email and the file is yours. You also get the full MT4 and MT5 library.
FAQ
Why does InpClamp stop at 0.999?
Because the log diverges at exactly 1. A normalised value reaching the edge of its window would send the reading to infinity, which blanks the pane. The clamp is a correctness guard rather than a cosmetic limit.
What does a Rising below zero bar mean?
They mark a slope flip that has not yet crossed zero. Dark turquoise means the reading is rising while still negative, and dark orange means falling while still positive. Those bars are what a turn actually looks like.
Why does InpAlpha default to 0.33?
It comes from the original work. The pairing of 0.33 and the remaining 0.67 makes a one-pole smoother on the normalised position. Without it the transform reacts to every bar and the pane becomes unreadable.
What is the Trigger plot?
The Fisher line shifted one bar, which is the standard companion. Crossings between the two mark where the current reading overtook its own previous value. It is the same idea as a signal line on any oscillator.
Are results guaranteed?
No. Trading involves risk. Results are not guaranteed; past performance is not indicative of future results. Use the Color Fisher Indicator as one input. Always backtest before trading live.
External references
- For background on this concept, see Spot date on Wikipedia.
- For broader market context, see Stockcharts Theoretical Indices at StockCharts ChartSchool.

About the author
Written by Dominic Walsh, a Forex trader and MT4/MT5 indicator, Expert Advisor and script developer. Every tool on forexmt4systems.com is tested on live charts before release and ships with ready-to-use compiled MT4 (.ex4) and MT5 (.ex5) files. Learn more about the trader and developer behind this site.
How we build, test and correct every tool: Editorial & Testing Policy. Trading carries risk; see the disclaimer.