
Naming a turn is more useful than merely marking it. The liquidity swing indicator does both: it finds pivots with the tightest possible three-bar rule, then compares each against the previous same-side turn and writes HH, LH, HL or LL beside it in the matching colour.
This build ships as a compiled .ex4 for MT4 and .ex5 for MT5; the screenshots below come from EURUSD H1.
| Platforms | MT4 (.ex4) + MT5 (.ex5) |
|---|---|
| Chart window | Main price chart |
| Plots | 2: Swing High, Swing Low |
| Alerts | popup, push notification, email, sound |
| Inputs | 18 |
What appears on the chart
Two arrow plots plus text labels.
`Swing High` marks dodger blue using arrow 234.
`Swing Low` marks orange red using arrow 233.
`HHColor` `clrLimeGreen` tints a higher turn.
`LHColor` `clrTomato` tints a lower one.
Objects carry the `ObjectPrefix` `”LSI_”` prefix.
- Swing High: arrow, dodger blue, arrow code 234
- Swing Low: arrow, orange red, arrow code 233
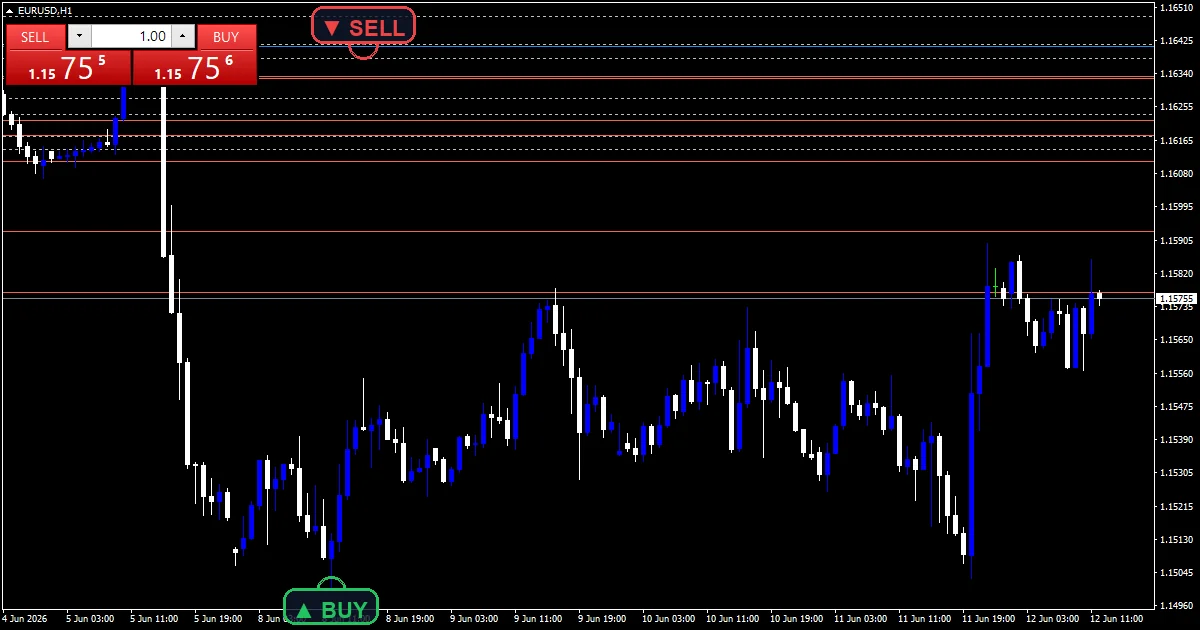
From price to plot
The tightest pivot rule
`PivotLookback` `1` means one bar either side. That is the strict three-bar pivot, the smallest structure the method recognises, and it finds a great many of them.
Naming the turn
The code checks each new pivot against the previous one on its own side. Higher earns the first tag and lower the second, which makes the label meaningful rather than decorative.
Keeping the chart usable
`MaxLabels` `200` caps the text and `HistoryBars` `800` bounds the scan. Both sit above earlier values, which cut the chart short too soon on a busy symbol.
Getting a signal from it
A run of higher tags describes a rising structure.
A run of lower tags describes a falling one.
Mixed tags mean the structure has not settled.
`ArrowWidth` `3` keeps marks visible on a busy chart.
`LabelOffsetPoints` `18` sits each label clear.
Every pivot confirms one bar late.
Alert channels in this build: popup, push notification, email and sound, one message per closed bar.
A pivot that has just confirmed is the event here. `EnableAlerts` decides whether it speaks and a panel already appears in the terminal, while the phone route, the mail route and the file named by `SoundFile` each begin closed.
Every Liquidity swing Indicator input
Core settings
| Setting | What it does | Default |
|---|---|---|
PivotLookback |
1 = strict 3-bar pivot. How many bars flank a pivot, `1`. | 1 |
ObjectPrefix |
Prefix on every object name, `”LSI_”`. | LSI_ |
Display settings
| Setting | What it does | Default |
|---|---|---|
MaxLabels |
Max text labels drawn (was 80 – caps too soon). Text labels drawn at once, `200`. | 200 |
HistoryBars |
Bars the scan covers, `800`. | 800 |
LabelOffsetPoints |
Vertical offset (was 60 – pushed labels off some charts). Vertical gap on each label, `18`. | 18 |
ArrowWidth |
arrow size (was 1 – too small). How large the marks draw, `3`. | 3 |
HHColor |
Tint on a higher high, `clrLimeGreen`. | lime green |
LHColor |
(see inputs panel) | tomato |
HLColor |
(see inputs panel) | lime green |
LLColor |
Tint on a lower low, `clrTomato`. | tomato |
LabelFontSize |
(see inputs panel) | 9 |
LabelFontName |
(see inputs panel) | Arial Bold |
Alert settings
| Setting | What it does | Default |
|---|---|---|
EnableAlerts |
Whether a new pivot speaks, `true`. | on |
EnablePopup |
A panel appears in the terminal, `true`. | on |
EnablePushNotify |
(see inputs panel) | off |
EnableEmail |
(see inputs panel) | off |
EnableSound |
(see inputs panel) | off |
SoundFile |
(see inputs panel) | alert.wav |
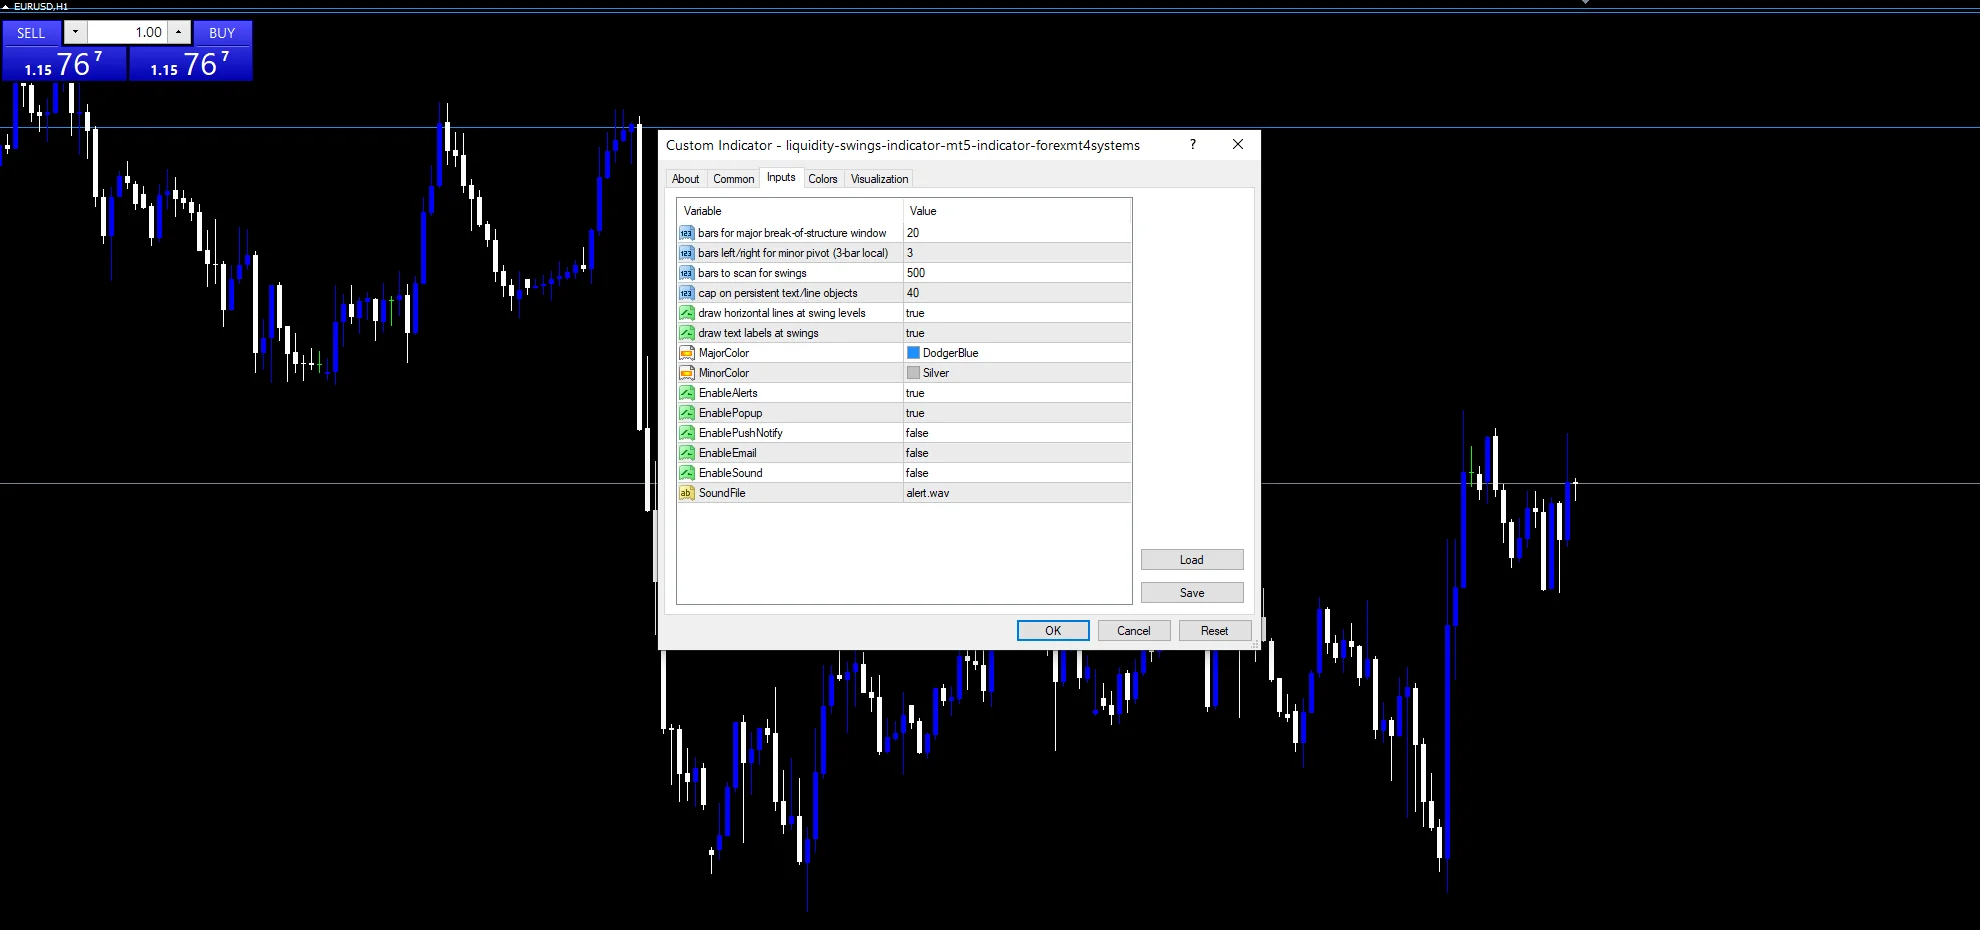
Suitable markets
A three-bar pivot rule across eight hundred bars produces a busy chart. EURUSD H1 is the reference chart, covering about a month. On M5 the labels overwhelm the screen. On H4 the same scan reaches back most of a year.
The downsides
One bar either side is the smallest pivot there is.
So two hundred labels still crowds a chart.
Meanwhile a tag describes structure, not what comes next.
Objects survive a timeframe change until redrawn.
Copy the compiled Liquidity swing Indicator file into your MQL4/Indicators folder, and the MT5 build into MQL5/Indicators, then restart the terminal and drag it onto a chart. The step-by-step guide with screenshots is at how to install MT4 and MT5 indicators.
Download the Liquidity swing Indicator for MT4 and MT5
The zip holds the compiled Liquidity swing Indicator build for MT4 and MT5, plus a short README. Compiled files only, no source. Enter your email below and the download link arrives in your inbox.
Download this indicator free
Enter your email and the file is yours. You also get the full MT4 and MT5 library.
FAQ
What does PivotLookback 1 actually require?
One bar on each side failing to beat the candidate, which is the strict three-bar pivot and the smallest structure this method recognises. It finds many turns, so the labels are what sort them out.
Which colour does HHColor give a higher high?
Lime green, against tomato for a lower one. The tag comes from comparing each new swing high against the previous one, so the colour tells you the structure without reading the text.
What does MaxLabels 200 give you over 80?
Coverage. The earlier cap cut the chart short too soon, leaving recent structure unlabelled on a busy symbol. Two hundred spans a useful stretch without turning the chart into solid text.
Does the Swing High plot use a downward arrow?
Yes, code 234 pointing down above the bar. That keeps the mark clear of the candle it belongs to, and the direction of the symbol is a placement choice rather than a signal.
Are results guaranteed?
No. Trading involves risk. Results are not guaranteed; past performance is not indicative of future results. Use the Liquidity swing Indicator as one input. Always backtest before trading live.
Category: this is part of our Smart Money collection. Also, browse more Smart Money for MetaTrader, or explore every MT4 indicator and MT5 indicator on the site.
External references
- Learn more about the underlying method in Holy grail distribution on Wikipedia.
- For wider market background, see Marketcarpets at StockCharts ChartSchool.

About the author
Written by Dominic Walsh, a Forex trader and MT4/MT5 indicator, Expert Advisor and script developer. Every tool on forexmt4systems.com is tested on live charts before release and ships with ready-to-use compiled MT4 (.ex4) and MT5 (.ex5) files. Learn more about the trader and developer behind this site.
How we build, test and correct every tool: Editorial & Testing Policy. Trading carries risk; see the disclaimer.