
The macd trend indicator splits the histogram into two coloured buffers instead of one grey series. Above zero it draws lime, below zero red. A yellow dot then marks the bar where the main line itself changed direction, which is a different event from a signal crossing.
This build ships as a compiled .ex4 for MT4 and .ex5 for MT5; the screenshots below come from EURUSD H1.
| Platforms | MT4 (.ex4) + MT5 (.ex5) |
|---|---|
| Chart window | Separate window (levels 0) |
| Plots | 5: MACD, Signal, Hist+, Hist-, TrendFlip |
| Alerts | popup, push notification, email, sound |
| Inputs | 9 |
Colours, widths and shapes
MACD is the dodger blue main line and Signal is the orange red one.
Hist+ is the lime histogram above zero.
Hist- is the red histogram below it.
TrendFlip is a yellow dot on the bar where the main line turned.
- MACD: line, dodger blue, width 2
- Signal: line, orange red, width 2
- Hist+: histogram, lime, width 3
- Hist-: histogram, red, width 3
- TrendFlip: arrow, yellow, width 3, arrow code 159
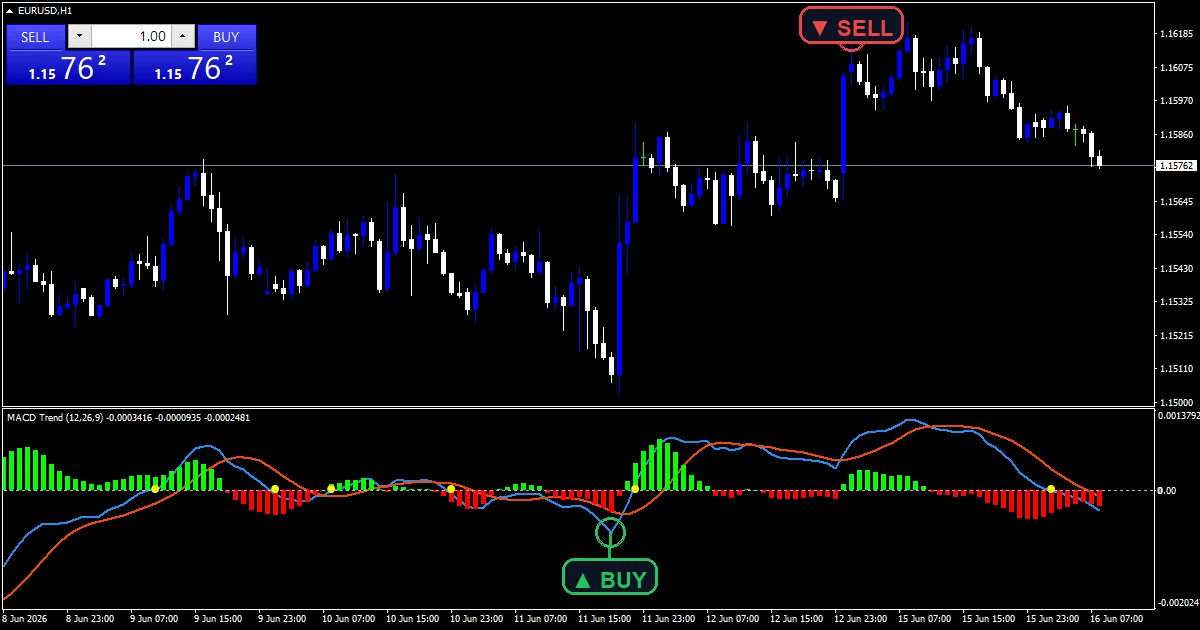
What the build works out
The two lines
iMACD supplies main and signal at `InpFastEMA` `12`, `InpSlowEMA` `26` and `InpSignalSMA` `9` on the close. Both go straight into plotted buffers with no further processing.
Splitting the histogram
hist takes main minus signal. Both BufHistPos and BufHistNeg receive that value, and the sign decides which one you see. Splitting it this way lets each half carry its own colour without a second calculation.
Marking the flip
The code also reads the main line one bar back. A flip means the current value moved the other way to the previous step. BufFlip then marks that bar, independently of where the signal line sits.
What you act on
Colour tells you which side of zero the gap sits on.
The yellow dot marks a turn in the main line, not a signal crossing.
A dot with the histogram still deep in one colour is an early warning.
Both events can happen on the same bar, and often do.
Alert channels in this build: popup, push notification, email and sound, one message per closed bar.
`InpEnableAlerts` starts on with `InpEnablePopup` and `InpEnableSound` both true, while `InpEnablePush` and `InpEnableEmail` begin false. `InpSoundFile` picks the clip. The test reads completed bars, one message per closed bar.
Every Macd trend Indicator input
Core settings
| Setting | What it does | Default |
|---|---|---|
InpFastEMA |
Fast EMA. Fast average length, default `12`. | 12 |
InpSlowEMA |
Slow EMA. Slow average length, default `26`. | 26 |
InpSignalSMA |
Signal SMA period. Signal average length, default `9`. | 9 |
Alert settings
| Setting | What it does | Default |
|---|---|---|
InpEnableAlerts |
Master alert toggle. Master toggle for the histogram flip alerts, default `true`. | on |
InpEnablePopup |
Popup alert. Terminal dialog on a flip, default `true`. | on |
InpEnablePush |
Push notification. Phone push on a flip, default `false`. | off |
InpEnableEmail |
Email alert. Mail delivery on a flip, default `false`. | off |
InpEnableSound |
Sound alert. Sound playback on a flip, default `true`. | on |
InpSoundFile |
Sound file. Wav clip for the flip alert, default `alert.wav`. | alert.wav |

Suitable charts
A split histogram reads best where the pane has room to breathe. EURUSD H1 is the reference chart, where `InpSlowEMA` at `26` covers a day. On M5 the colour changes several times an hour. On H4 each colour block covers a genuine leg of the move.
Honest weaknesses
A turn in the main line can reverse on the next bar, so early dots are often wrong.
Colour reports the sign of the gap and nothing about its size.
Both the lines and the flip test lag price, because averages always do.
Copy the compiled Macd trend Indicator file into your MQL4/Indicators folder, and the MT5 build into MQL5/Indicators, then restart the terminal and drag it onto a chart. The step-by-step guide with screenshots is at how to install MT4 and MT5 indicators.
Download the Macd trend Indicator for MT4 and MT5
The zip holds the compiled Macd trend Indicator build for MT4 and MT5, plus a short README. Compiled files only, no source. Enter your email below and the download link arrives in your inbox.
Download this indicator free
Enter your email and the file is yours. You also get the full MT4 and MT5 library.
FAQ
What separates the Hist+ and Hist- plots?
Only the sign. Both receive main minus signal, and the lime buffer keeps it while positive with the red one taking over below zero. Splitting them lets each half hold its own colour without recalculating anything.
What does the TrendFlip dot mark?
A change of direction in the main line itself. The code compares the current value with the one before, so the dot appears when that step reverses. It is a separate event from the main line crossing its signal.
Can a TrendFlip dot appear without a crossing?
Yes, and that is the useful case. The main line can turn while still sitting well above the signal. The dot then gives an early warning that momentum has stopped building, before any crossing happens.
Does InpSignalSMA affect the flip test?
No. The flip reads only the main line, so `InpSignalSMA` `9` changes the signal line and the histogram without touching the dot. That is why the two events can disagree on the same bar.
Are results guaranteed?
No. Trading involves risk. Results are not guaranteed; past performance is not indicative of future results. Use the Macd trend Indicator as one input. Always backtest before trading live.
Category: this is part of our Oscillators collection. Browse more Oscillators for MetaTrader, or explore every MT4 indicator and MT5 indicator on the site.
External references
- Learn more about the underlying method in Market saturation on Wikipedia.
- For wider market background, see Advance Decline Volume Line at StockCharts ChartSchool.

About the author
Written by Dominic Walsh, a Forex trader and MT4/MT5 indicator, Expert Advisor and script developer. Every tool on forexmt4systems.com is tested on live charts before release and ships with ready-to-use compiled MT4 (.ex4) and MT5 (.ex5) files. Learn more about the trader and developer behind this site.
How we build, test and correct every tool: Editorial & Testing Policy. Trading carries risk; see the disclaimer.