
This one asks an unusual question: not where price is, but where it sits inside its own rhythm. The non repainting cycle identifier indicator runs John Ehlers’ arithmetic to measure a cycle length and a phase angle, then marks the bars where that phase reaches a trough or a peak.
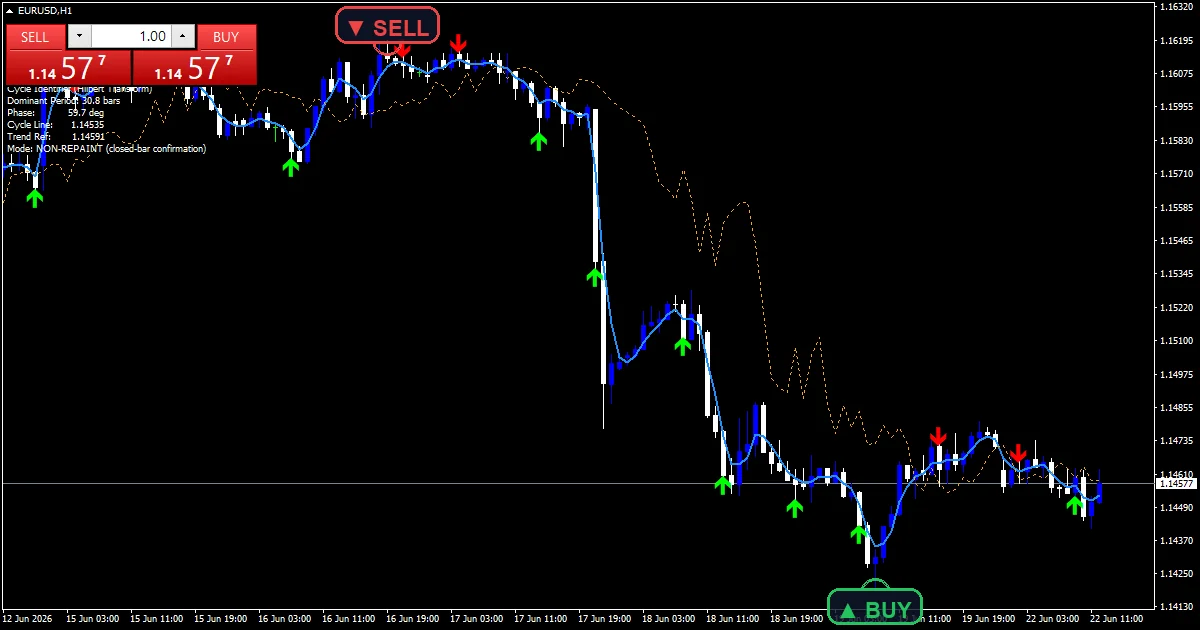
This build ships as a compiled .ex4 for MT4 and .ex5 for MT5; the screenshots below come from EURUSD H1.
| Platforms | MT4 (.ex4) + MT5 (.ex5) |
|---|---|
| Chart window | Main price chart |
| Plots | 4: Cycle Line, Cycle Trend, Cycle BUY, Cycle SELL |
| Alerts | popup, push notification, email, sound |
| Inputs | 14 |
What shows up when you attach it
Two lines and a pair of marks on price.
`Cycle Line` traces dodger blue at width 2.
`Cycle Trend` traces orange at width 1.
`Cycle BUY` prints lime at a measured trough.
`Cycle SELL` prints red at a peak.
Marks stand `ArrowOffsetPts` `18` points clear.
- Cycle Line: line, dodger blue, width 2
- Cycle Trend: line, orange, width 1
- Cycle BUY: arrow, lime, width 2, arrow code 233
- Cycle SELL: arrow, red, width 2, arrow code 234
How the Non repainting cycle identifier Indicator reaches a value
Smoothing first
A four-bar weighted pass starts it. Weights of four, three, two and one over ten, which is Ehlers’ own filter and removes the noise his later stages cannot tolerate.
Measuring the cycle
Two derived series do the work. A detrended copy and a quadrature version of it, which together give a phase angle and an estimate of the current cycle length.
Bounding the estimate
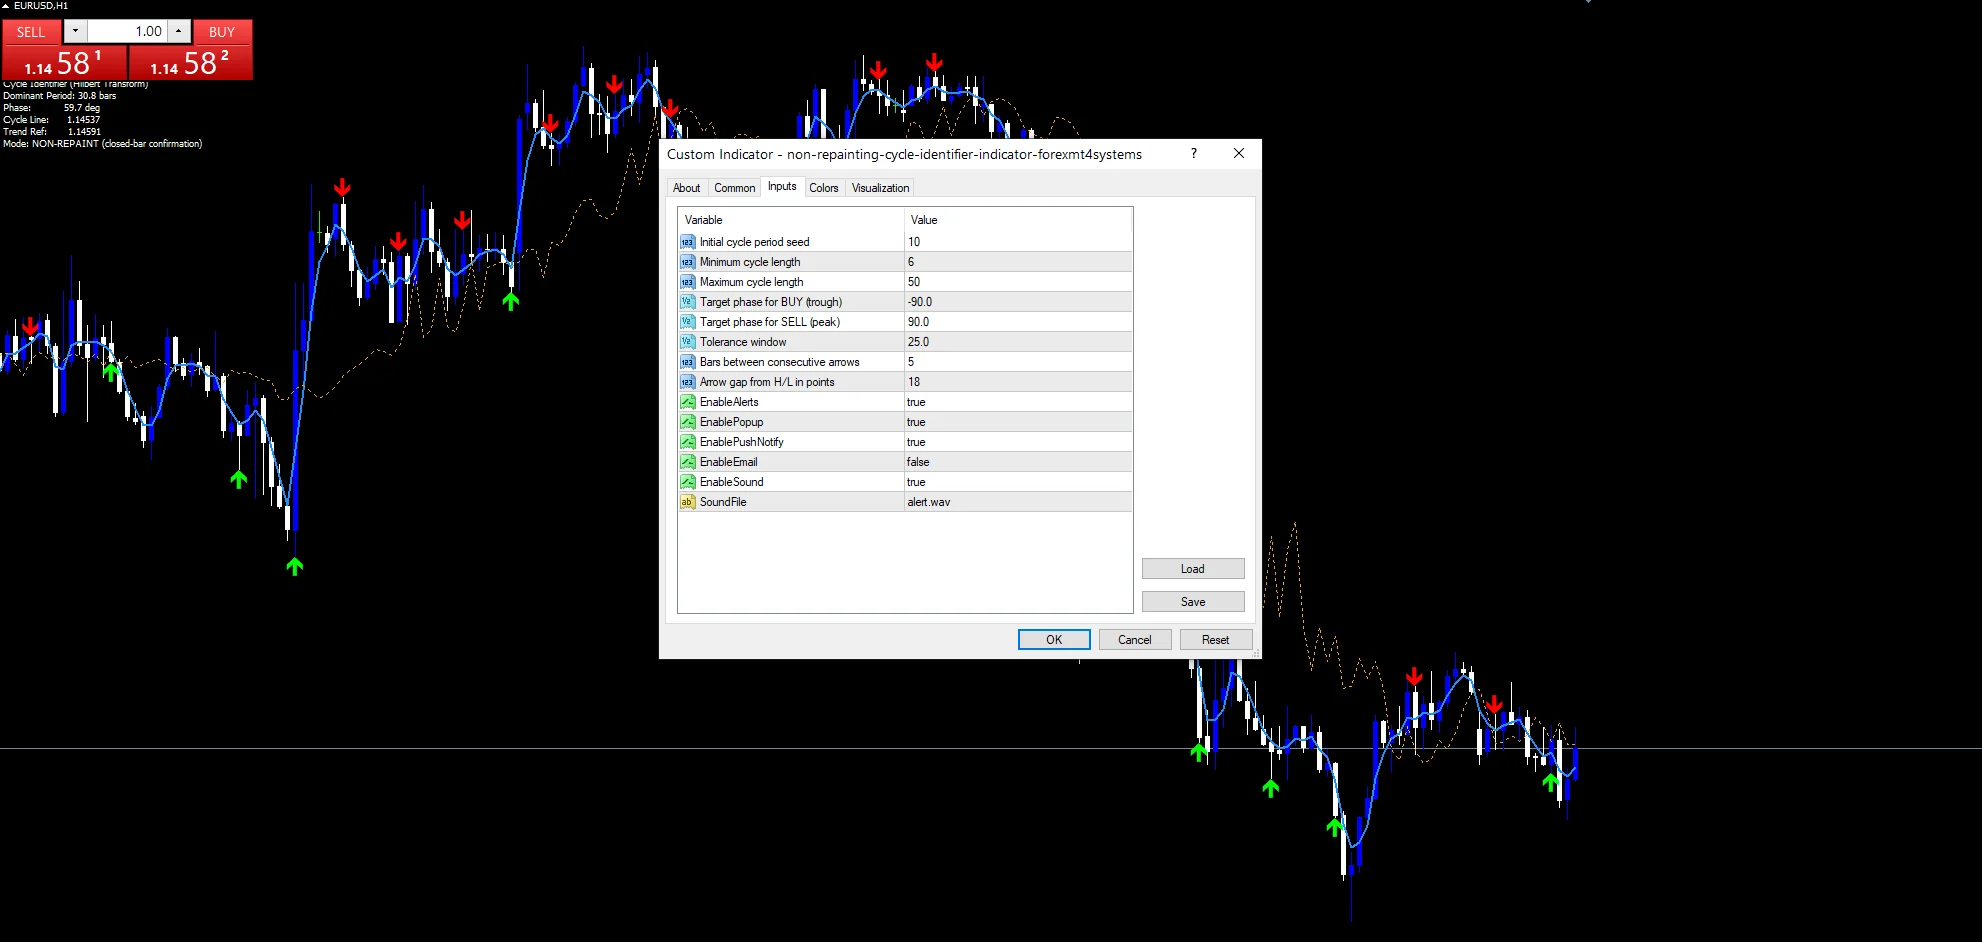
`MinCycle` `6` and `MaxCycle` `50` hold that estimate in range, seeded by `AlphaPeriod` `10`. Without those bounds the measurement wanders on noisy data.
Reading the result
Phase runs through a full circle each cycle.
`PhaseBuyDeg` `-90.0` is the trough of that circle.
`PhaseSellDeg` `90.0` is the peak.
`PhaseToleranceDeg` `25.0` sets how near counts.
`CooldownBars` `5` keeps repeated marks apart.
Every stage reads closed bars only.
Alert channels in this build: popup, push notification, email and sound, one message per closed bar.
A phase reaching its trough or peak is what reports. `EnableAlerts` heads the group and arrives on with `EnablePopup`, `EnablePushNotify` and `EnableSound`, which plays `SoundFile`. Only `EnableEmail` waits, and marks report once a bar.
Every Non repainting cycle identifier Indicator input
Core settings
| Setting | What it does | Default |
|---|---|---|
AlphaPeriod |
Initial cycle period seed. Starting guess at the cycle length, `10`. | 10 |
MinCycle |
Minimum cycle length. Shortest cycle accepted, `6`. | 6 |
MaxCycle |
Maximum cycle length. Longest accepted, `50`. | 50 |
PhaseBuyDeg |
Target phase for BUY (trough). Phase angle counted as a trough, `-90.0`. | -90.0 |
PhaseSellDeg |
Target phase for SELL (peak). Angle counted as a peak, `90.0`. | 90.0 |
PhaseToleranceDeg |
Tolerance window. How near an angle must land, `25.0`. | 25.0 |
CooldownBars |
Bars between consecutive arrows. Bars held between marks, `5`. | 5 |
Display settings
| Setting | What it does | Default |
|---|---|---|
ArrowOffsetPts |
Arrow gap from H/L in points. Gap between a mark and its candle, `18`. | 18 |
Alert settings
| Setting | What it does | Default |
|---|---|---|
EnableAlerts |
(see inputs panel) | on |
EnablePopup |
(see inputs panel) | on |
EnablePushNotify |
A mark reaching a phone, `true`. | on |
EnableEmail |
(see inputs panel) | off |
EnableSound |
A mark through the desktop, `true`. | on |
SoundFile |
(see inputs panel) | alert.wav |
Choosing a timeframe
Cycle measurement needs a market that actually cycles. EURUSD H1 is the reference chart, where the estimate usually settles between ten and thirty bars. Go faster and noise dominates. In a strong trend the measurement means little anywhere.
Its blind spots
A trending market has no cycle to measure.
The estimate is bounded, so it cannot report an honest miss.
Phase arithmetic is sensitive to the smoothing before it.
A twenty-five degree tolerance is a seventh of the circle.
Copy the compiled Non repainting cycle identifier Indicator file into your MQL4/Indicators folder, and the MT5 build into MQL5/Indicators, then restart the terminal and drag it onto a chart. The step-by-step guide with screenshots is at how to install MT4 and MT5 indicators.
Related on forexmt4systems.com: RSI Divergence Swing Strategy for USDCAD on H1.
Background reading on the method behind the Non repainting cycle identifier Indicator: Hilbert transform on Wikipedia, Detrended Price Oscillator at StockCharts ChartSchool.
Download the Non repainting cycle identifier Indicator for MT4 and MT5
The zip holds the compiled Non repainting cycle identifier Indicator build for MT4 and MT5, plus a short README. Compiled files only, no source. Enter your email below and the download link arrives in your inbox.
Download this indicator free
Enter your email and the file is yours. You also get the full MT4 and MT5 library.
FAQ
What does PhaseBuyDeg -90.0 actually mean?
The bottom of the cycle. Phase runs through a full circle over each measured cycle, and minus ninety degrees is the trough of that circle, which is where a low is expected if the rhythm holds.
Why do MinCycle and MaxCycle bound the estimate?
Because the measurement wanders on noisy data. Holding it between six and fifty bars keeps the phase arithmetic stable, at the cost of never reporting that no usable cycle exists.
Can a Cycle BUY arrow move after it prints?
No. The smoothing filter, the detrended series and the phase estimate all read bars that have already closed, so a mark printed on a finished bar stays exactly where it landed.
Is PhaseToleranceDeg 25.0 tight or loose?
Fairly loose. Twenty-five degrees either side covers about a seventh of the full circle, so a mark can print some way from the exact trough. Narrowing it gives fewer and better-timed marks.
Are results guaranteed?
No. Trading involves risk. Results are not guaranteed; past performance is not indicative of future results. Use the Non repainting cycle identifier Indicator as one input. Always backtest before trading live.
Category: this is part of our Signal and Forecast collection. Browse more Signal and Forecast for MetaTrader, or explore every MT4 indicator and MT5 indicator on the site.
External references
- For background on this concept, see United States presidential election cycle on Wikipedia.
- For broader market context, see Morningstar at Investopedia.

About the author
Written by Dominic Walsh, a Forex trader and MT4/MT5 indicator, Expert Advisor and script developer. Every tool on forexmt4systems.com is tested on live charts before release and ships with ready-to-use compiled MT4 (.ex4) and MT5 (.ex5) files. Learn more about the trader and developer behind this site.
How we build, test and correct every tool: Editorial & Testing Policy. Trading carries risk; see the disclaimer.