
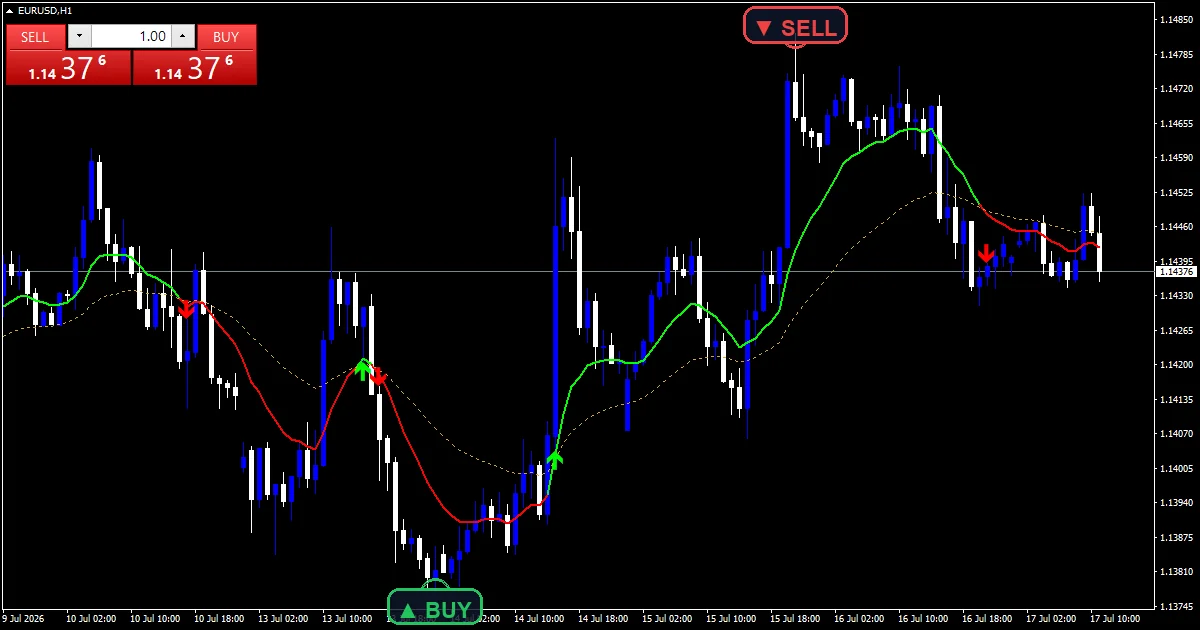
The x trend premium indicator keeps a visible baseline on the chart and marks the crosses that pass a strength test. X Trend Up and X Trend Down colour that baseline by state. X Buy and X Sell only print when the strength reading agrees, so quiet crosses leave no mark.
This build ships as a compiled .ex4 for MT4 and .ex5 for MT5; the screenshots below come from EURUSD H1.
| Platforms | MT4 (.ex4) + MT5 (.ex5) |
|---|---|
| Chart window | Main price chart |
| Plots | 5: X Trend Up, X Trend Down, X Baseline, X Buy, X Sell |
| Alerts | popup, push notification, email, sound |
| Inputs | 11 |
What the X Trend Premium Indicator draws on the chart
X Baseline runs under the state colouring as the reference line.
X Trend Up carries the line while the fast average sits above the slow one.
The other side hands it to X Trend Down instead.
Markers named X Buy and X Sell record the crosses that also clear AdxThreshold.
- X Trend Up: line, lime, width 2
- X Trend Down: line, red, width 2
- X Baseline: line, goldenrod, width 1
- X Buy: arrow, lime, width 2, arrow code 233
- X Sell: arrow, red, width 2, arrow code 234
How the X Trend Premium Indicator calculates its values
Two averages and a state
FastPeriod and SlowPeriod give two exponential averages, read on the current bar and the one before. Their relationship sets the state that colours the baseline.
At 12 and 34 the pair is slower than a scalping cross and faster than a long trend filter, which is what makes the baseline hold its colour through ordinary pullbacks.
The strength gate
A cross alone colours the line but marks nothing. The strength reading over AdxPeriod has to sit above AdxThreshold on the same bar before a marker prints.
At 18.0 that threshold sits below the conventional 20, so it lets through moves that are building rather than only those already established.
Placing the markers
ArrowGapPts sets a fixed gap between a marker and its candle, 15 points by default, which is tight compared with most arrow tools.
The baseline keeps drawing whether or not a marker appeared, so the state and the signal are separate readings.
How to read the signals
Baseline colour is the state, and a marker is a state change that passed the strength test.
A colour change without a marker means the cross happened while strength sat under AdxThreshold.
That gap between colour changes and markers is the most useful thing this tool shows.
A threshold of 18.0 is deliberately permissive, so markers appear earlier than a stricter setting would allow.
Alert channels in this build: popup, push notification, email and sound, one message per closed bar.
Alerts cover popup, push, email and sound on a qualifying cross. A bar time check keeps it to one alert per closed bar.
Every X Trend Premium Indicator input
Core settings
| Setting | What it does | Default |
|---|---|---|
FastPeriod |
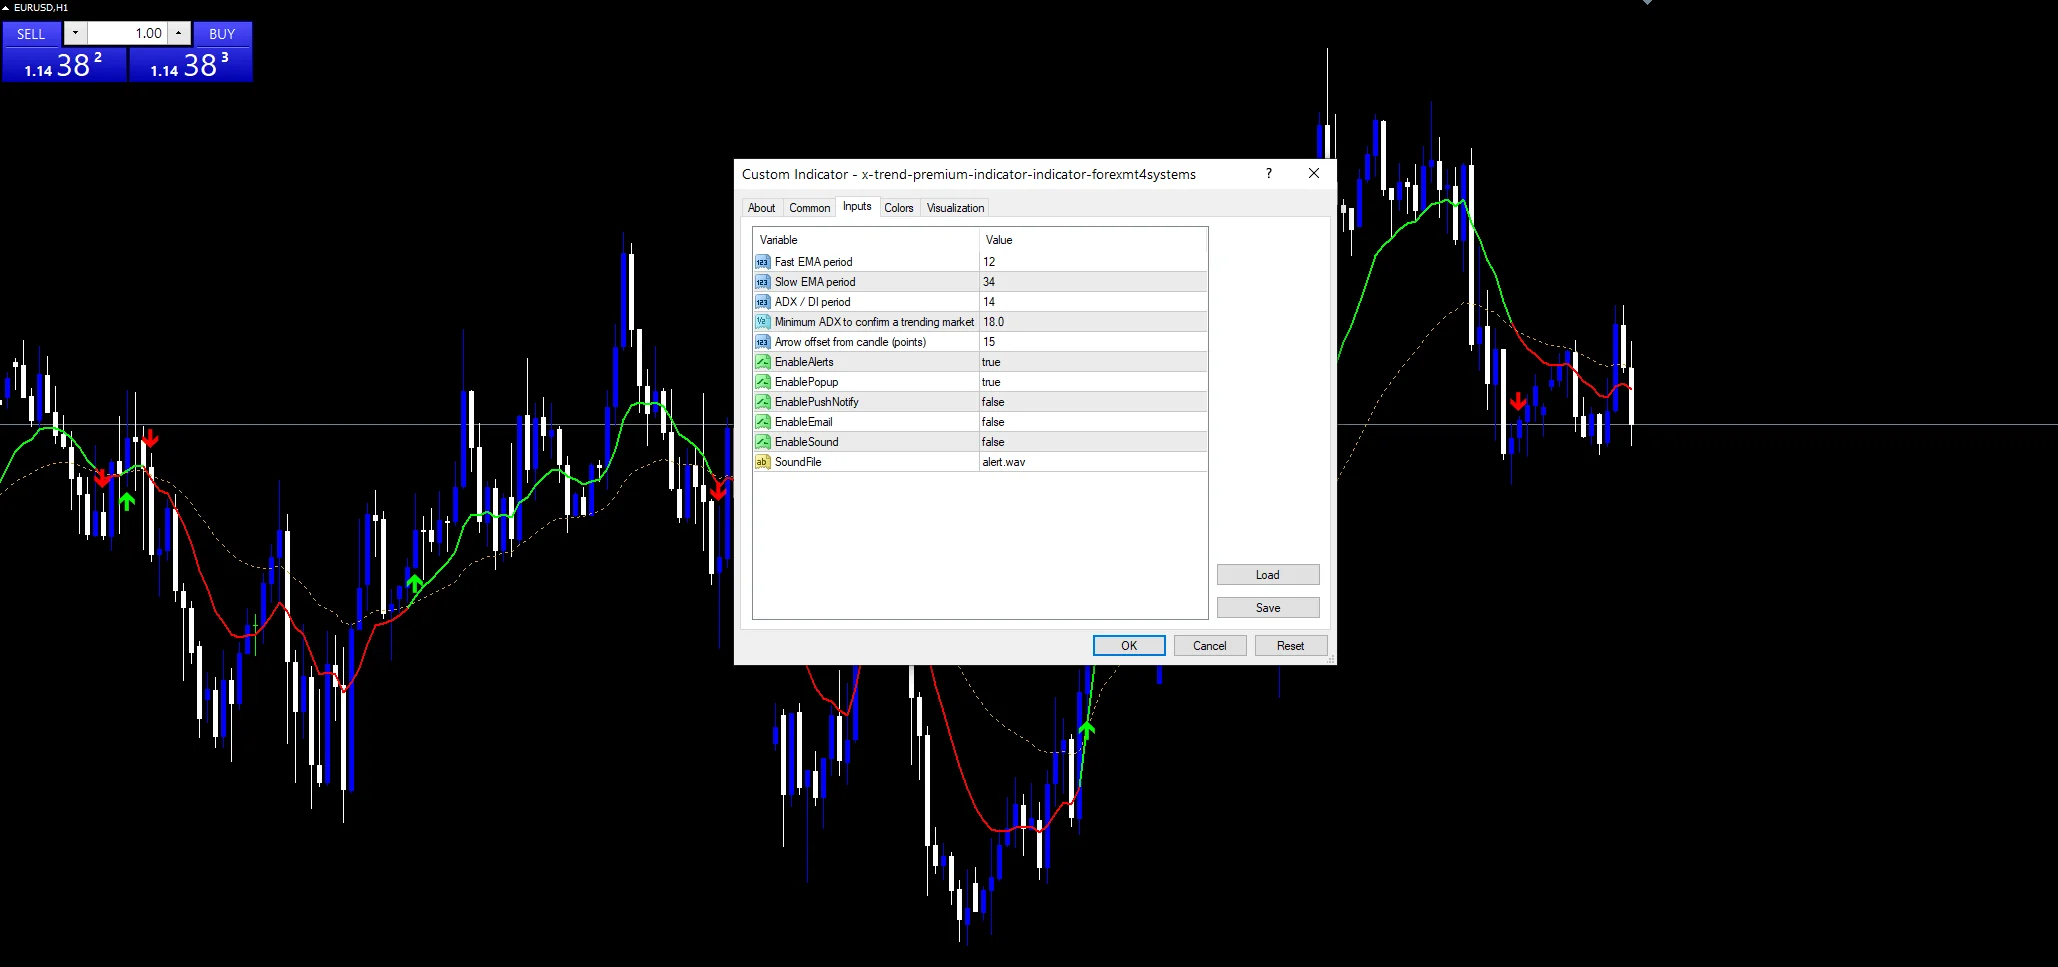
Fast EMA period. FastPeriod is the quick average length. It defaults to 12. | 12 |
SlowPeriod |
Slow EMA period. SlowPeriod is the slow one at 34. | 34 |
AdxPeriod |
ADX / DI period. AdxPeriod is the strength lookback, 14 by default. | 14 |
AdxThreshold |
Minimum ADX to confirm a trending market. AdxThreshold is the minimum strength a cross needs before a marker prints. It defaults to 18.0, and raising it towards 25 cuts the marker count sharply. | 18.0 |
Display settings
| Setting | What it does | Default |
|---|---|---|
ArrowGapPts |
Arrow offset from candle (points). ArrowGapPts is the cosmetic gap between a marker and its candle, 15 points by default. | 15 |
Alert settings
| Setting | What it does | Default |
|---|---|---|
EnableAlerts |
(see inputs panel) | on |
EnablePopup |
(see inputs panel) | on |
EnablePushNotify |
(see inputs panel) | off |
EnableEmail |
(see inputs panel) | off |
EnableSound |
(see inputs panel) | off |
SoundFile |
(see inputs panel) | alert.wav |
Settings that fit your chart
The screenshot uses EURUSD H1. A 12 and 34 pair on H1 holds its state across a session, which is what a baseline is for. On H4 and daily the colour changes become rare events. On M5 the pair crosses often enough that AdxThreshold does nearly all the filtering, so raising it there is the usual adjustment.
When the X Trend Premium Indicator fails
A permissive threshold lets weak moves through. At 18.0 some marked crosses happen in conditions a stricter setting would reject.
The strength reading rises in either direction, so it confirms that something is moving without confirming which way.
Both readings lag. The baseline changes colour after the cross, and the strength reading builds after the move starts.
A 15 point gap is tight, so on a volatile symbol the markers can sit inside the candle wicks.
Copy the compiled X Trend Premium Indicator file into your MQL4/Indicators folder, and the MT5 build into MQL5/Indicators, then restart the terminal and drag it onto a chart. The step-by-step guide with screenshots is at how to install MT4 and MT5 indicators.
Background reading on the method behind the X Trend Premium Indicator: Size premium on Wikipedia, Decisionpoint Price Momentum Oscillator Pmo at StockCharts ChartSchool.
Download the X Trend Premium Indicator for MT4 and MT5
The zip holds the compiled X Trend Premium Indicator build for MT4 and MT5, plus a short README. Compiled files only, no source. Enter your email below and the download link arrives in your inbox.
Download this indicator free
Enter your email and the file is yours. You also get the full MT4 and MT5 library.
FAQ
Why does the X Baseline change colour without a marker?
Because the two events are separate. Colour follows the relationship between the two averages, which changes on every cross. A marker also needs the strength reading above AdxThreshold, so a cross during quiet conditions colours the line and prints nothing.
Is AdxThreshold 18.0 too low?
It is deliberately permissive. Twenty is the more conventional floor, and eighteen lets through moves that are still building. That trade is earlier markers against more of them failing. Raising it to 25 gives far fewer and stronger ones.
What does the gap between FastPeriod and SlowPeriod control?
How often the state changes. Twelve and thirty four sit far enough apart that ordinary pullbacks do not flip the baseline, and close enough that a genuine turn registers within a few bars. Narrowing the gap produces many more crosses.
Should I widen ArrowGapPts from 15?
On a volatile symbol, yes. Fifteen points is tight, and on an instrument with long wicks the markers can end up sitting inside them. Widening it moves the marker clear of the candle without changing anything about when a signal fires.
Are results guaranteed?
No. Trading involves risk. Results are not guaranteed; past performance is not indicative of future results. Use the X Trend Premium Indicator as one input. Always backtest before trading live.
Category: this is part of our Smart Money collection. Browse more Smart Money for MetaTrader, or explore every MT4 indicator and MT5 indicator on the site.
External references
- Learn more about the underlying method in Size premium on Wikipedia.
- For wider market background, see Decisionpoint Price Momentum Oscillator Pmo at StockCharts ChartSchool.

About the author
Written by Dominic Walsh, a Forex trader and MT4/MT5 indicator, Expert Advisor and script developer. Every tool on forexmt4systems.com is tested on live charts before release and ships with ready-to-use compiled MT4 (.ex4) and MT5 (.ex5) files. Learn more about the trader and developer behind this site.
How we build, test and correct every tool: Editorial & Testing Policy. Trading carries risk; see the disclaimer.